American Battery Technology Com (ABAT)
Industrials • Waste Management • $1.39 • MCap: 211,015,088
https://americanbatterytechnology.com • American Battery Technology Company operates as a battery materials company in the United States. It explores critical minerals, such as lithium, nickel, cobalt, manganese, copper, aluminum, and graphite. The company also involved in the the development and commercialization of new technologies for the extraction of these critical minerals; and commercialization of an internally developed integrated process for the recycling of lithium-ion batteries. The company was formerly known as American Battery Metals Corporation and changed its name to American Battery Technology Company in August 2021. American Battery Technology Company was incorporated in 2011 and is headquartered in Reno, Nevada.
Watch List
ET
Notes
10/14/2026
Keep an eye.. the price is $1.66.. volumne should showup
10/05/2026
Hold off on buying a large position
| Score | Price | 52 Week & Averages | Relative Strength | Risk | |||||
|---|---|---|---|---|---|---|---|---|---|
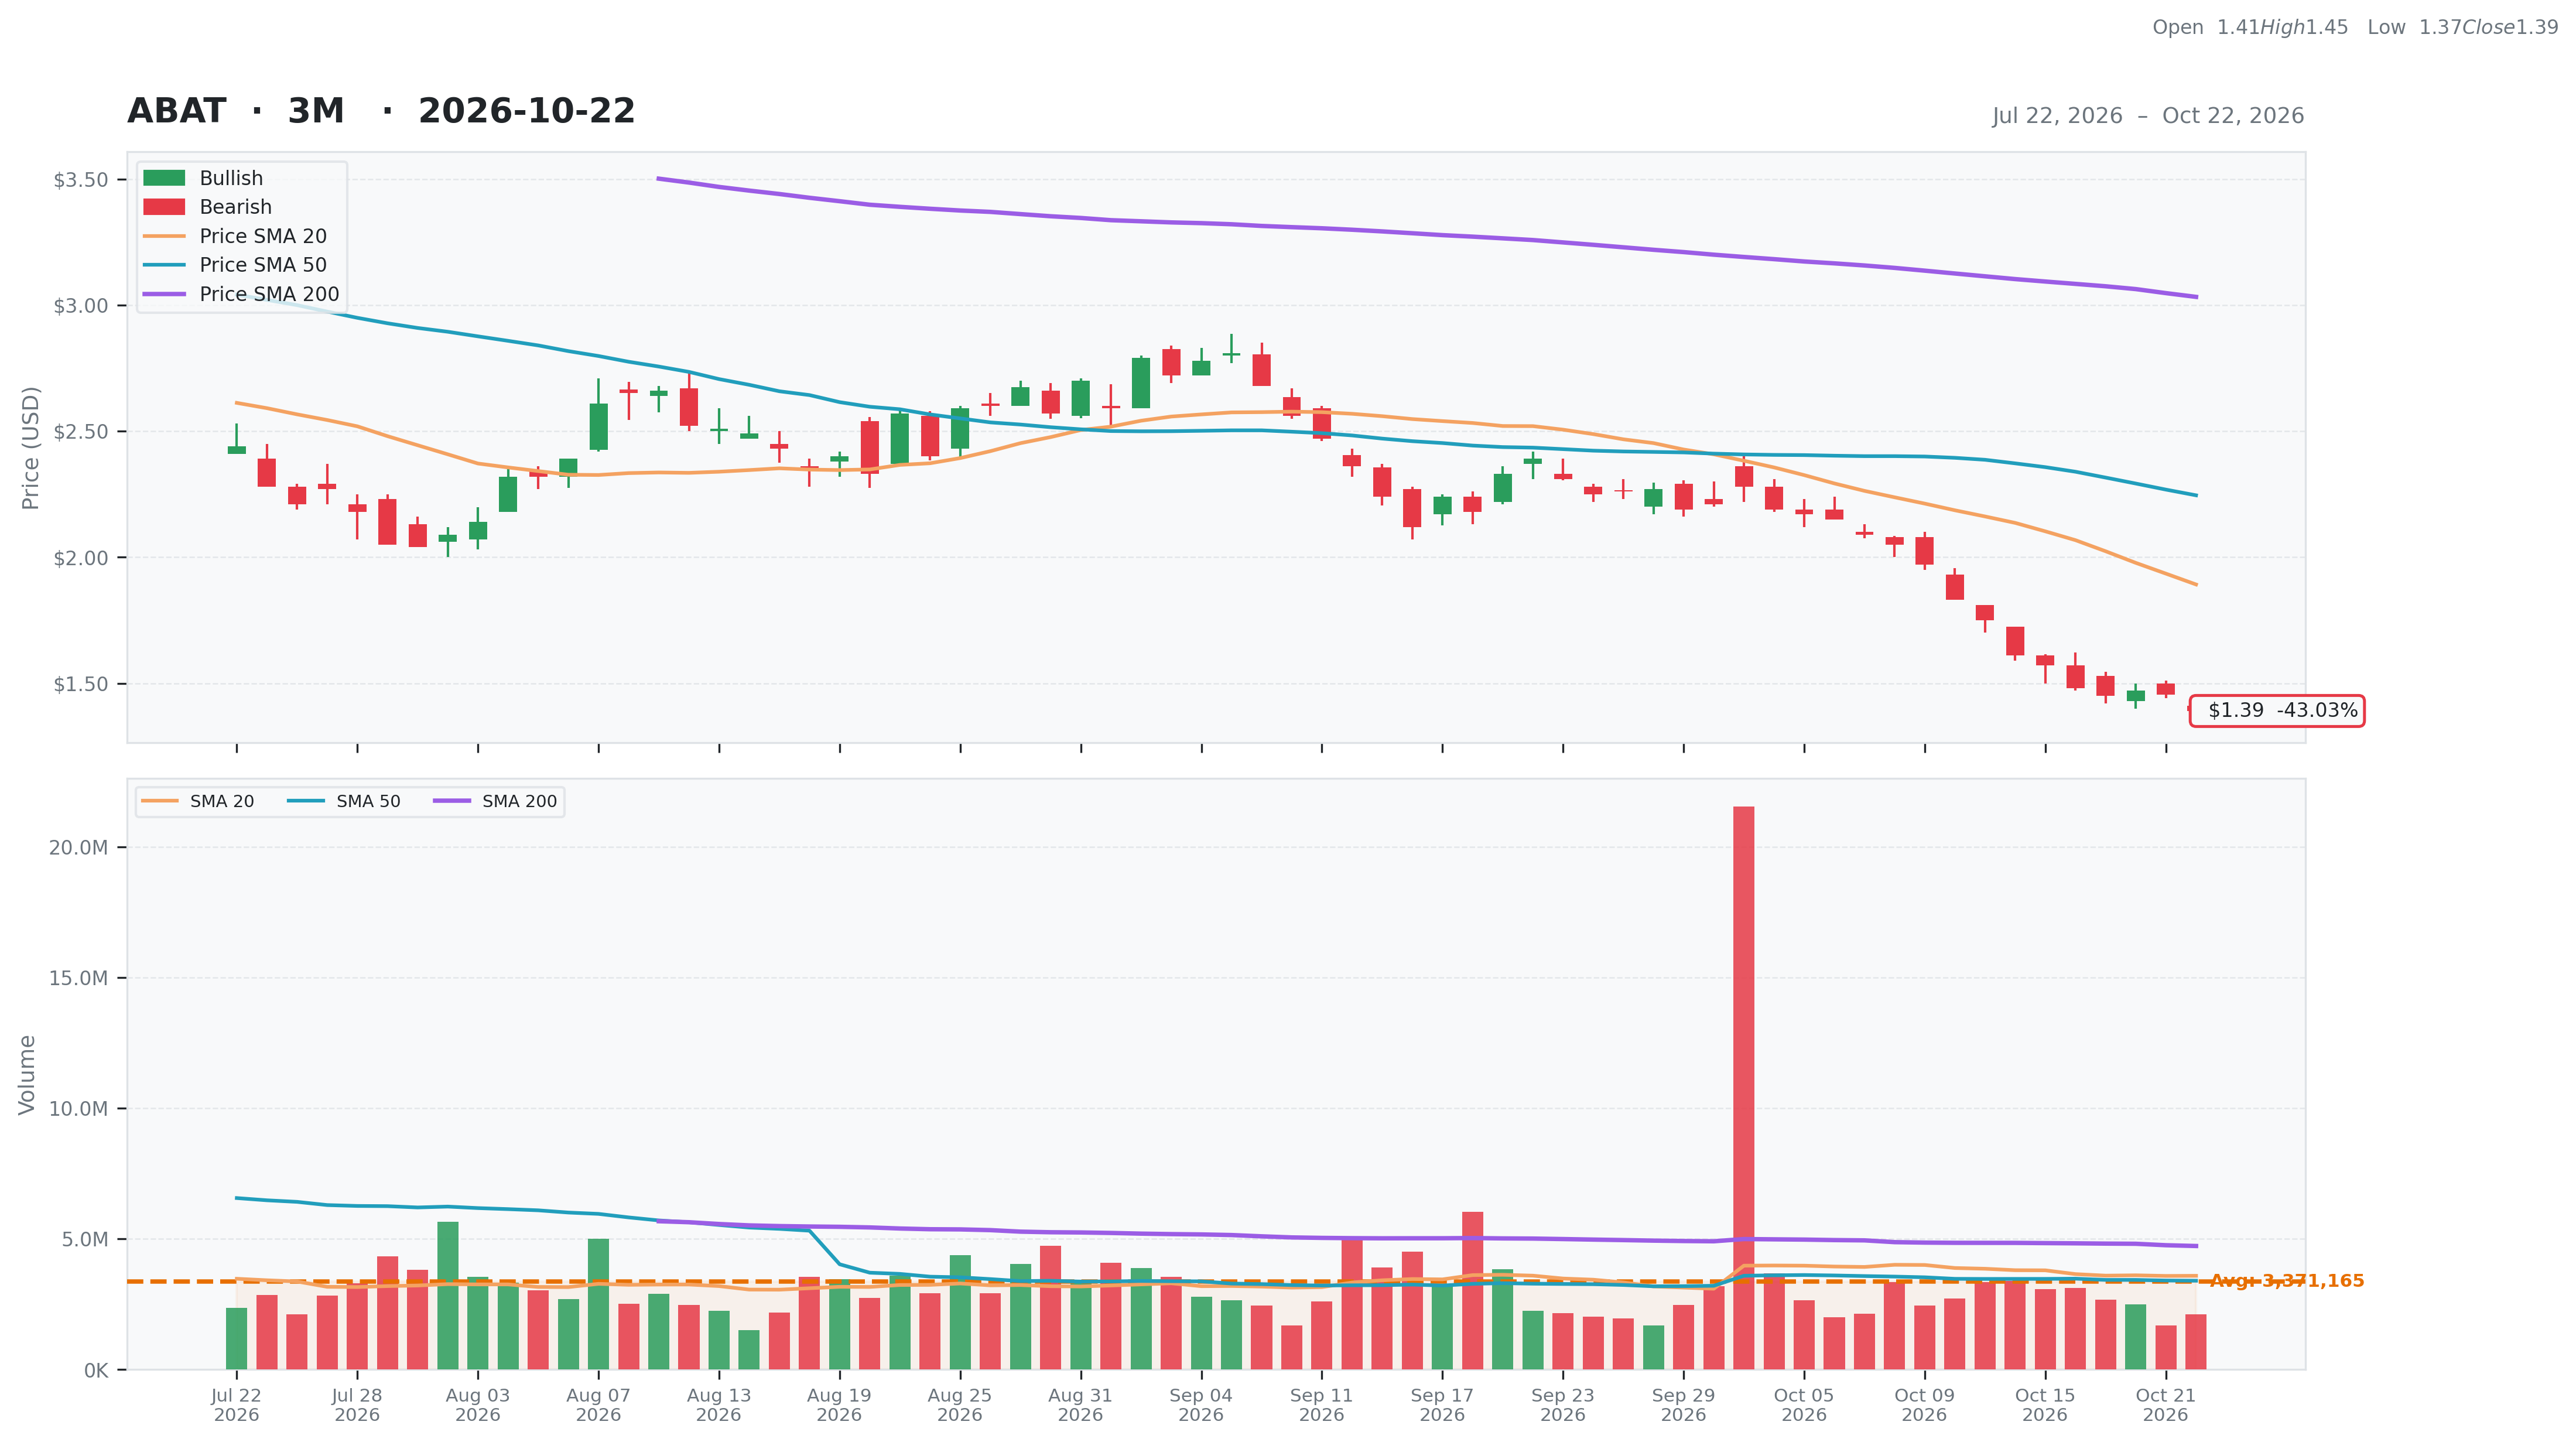
| Total | 38 | Current | $1.39 | 52W High | $5.98 -76.76% | Relative Strength | -0.56 | Beta | 1.31 |
| Business Quality | 1 | Weekly | $1.57 -11.46% | 52W Low | $1.39 0.00% | 3M | -0.37 | Short % | 0.16 |
| Financial Strength | 18 | Monthly | $2.39 -41.84% | Above 50DMA | $2.25 -38.10% | 6M | -0.58 | Risk Score | 6 |
| Growth Outlook | 1 | Quarterly | $2.21 -37.10% | Above 200DMA | $3.03 -54.16% | 9M | -0.71 | ||
| Momentum | 2 | Yearly | $5.39 -74.21% | 12M | -0.77 | ||||
| Valuation | Financial Strength | Growth/Profitability | |||
|---|---|---|---|---|---|
| Trailing P/E | N/A | Cash | 50M | Revenue Growth | 1.97% |
| Forward P/E | -10.57 | Debt | 0M | Earnings Growth | N/A |
| PEG Ratio | N/A | Debt/Equity | 0.15 | Qtr Earnings Growth | N/A |
| Price/Sales | 9.71 | Current Ratio | 9.53 | Gross Margin | -0.14% |
| Price/Book | 1.66 | Quick Ratio | 8.95 | Operating Margin | -2.46% |
| EV/Revenue | 7.44 | Operating CF | -24M | Profit Margin | 0.00% |
| EV/EBITDA | -2.32 | Free CF | 3M | EBITDA Margin | 0.00% |
| Ent Value | 162M | Return on Assets | -0.43% | ||
| Return on Equity | -0.75% | ||||
| Technical | Volume & Bollinger Bands | Analyst | |||
|---|---|---|---|---|---|
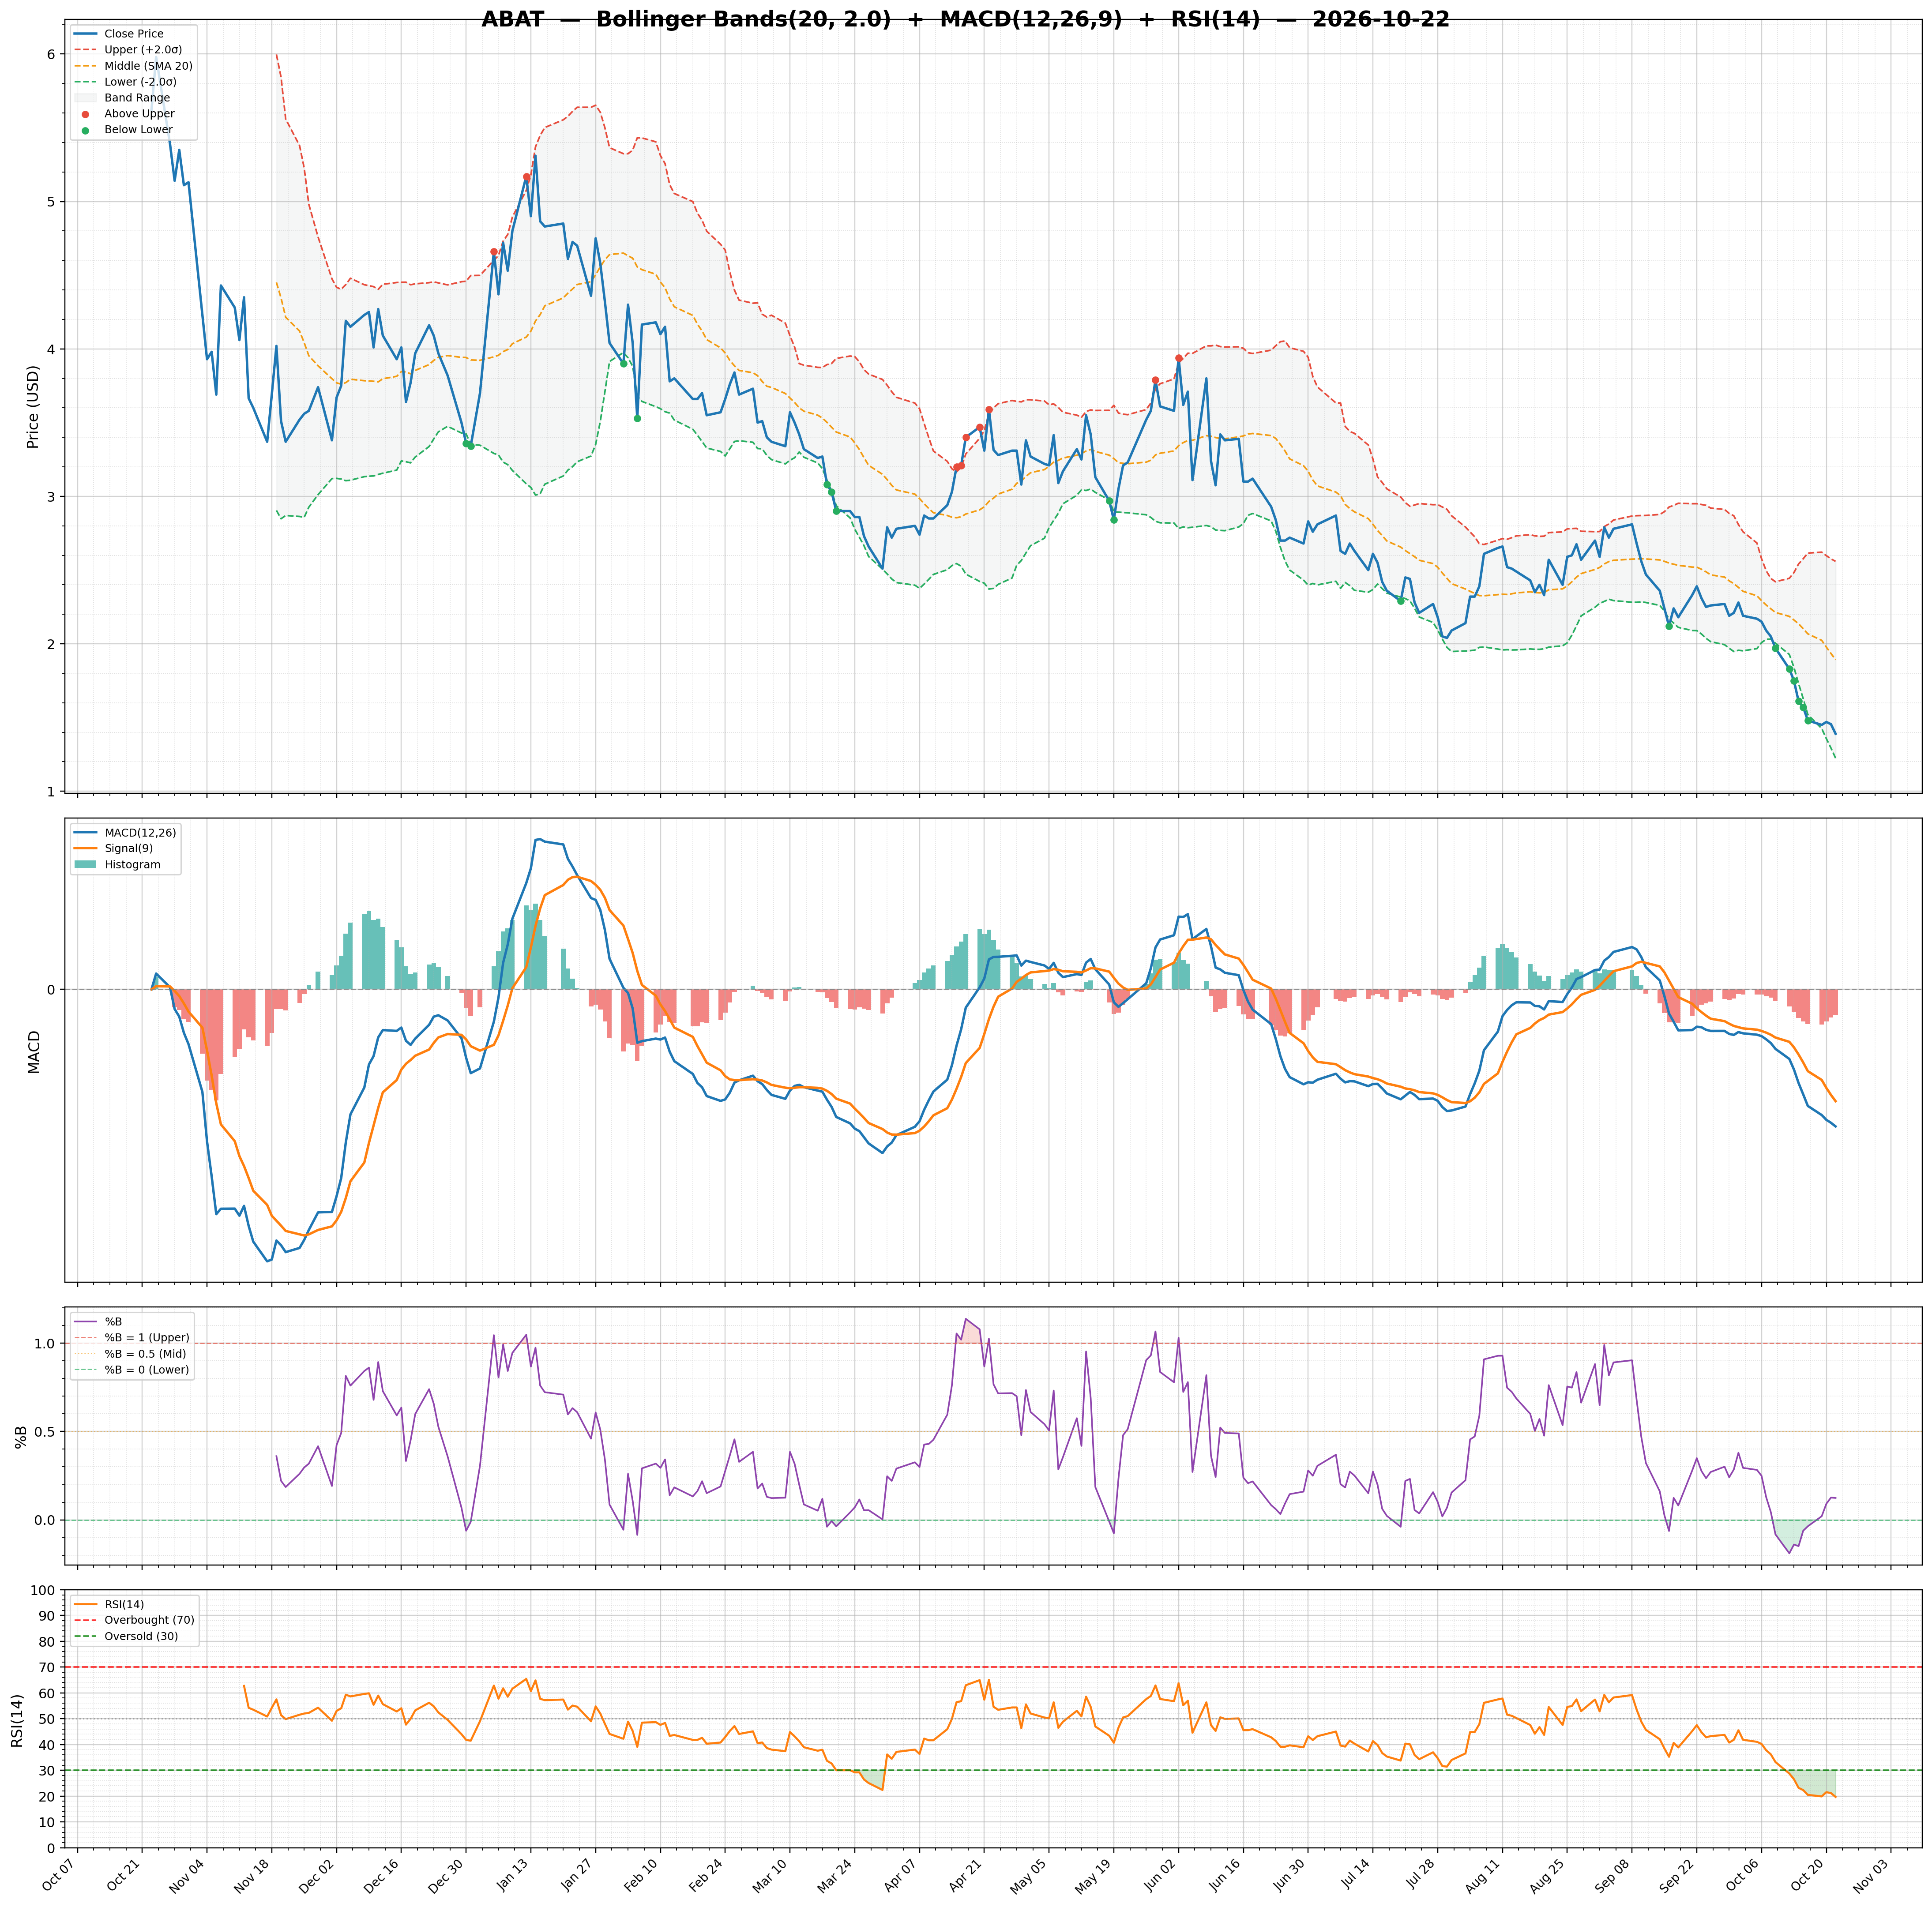
| RSI | 19.69 | Volume | 3.11M | Rating | none |
| Previous RSI | 21.17 | Avg Volume 20D | 3.58M | Target Mean | $6.00 |
| RSI Trend | Down | Relative Volume | 0.59 | Target High | $7.00 |
| MACD | -0.25 | Lower Band | 1.22 | Target Low | $5.00 |
| MACD Signal | -0.20 | Middle Band | 1.89 | Target Median | $6.00 |
| Histogram | -0.05 | Upper Band | 2.56 | Analysts | 2 |
| Previous Histogram | -0.05 | Bandwidth | 70.550 | Upside | 305.41% |
| Histogram Trend | Increasing | %B | 0.12 | ||