AECOM (ACM)
Industrials • Engineering & Construction • $60.83 • MCap: 7,585,367,040
https://www.aecom.com • AECOM, together with its subsidiaries, provides professional infrastructure consulting services for governments, businesses, and organizations internationally. The company operates in three segments: Americas, International, and AECOM Capital. The company offers advisory, planning, consulting, architectural and engineering design, construction and program management services, and investment and development services to public and private clients in major end markets such as transportation, facilities, water, environmental, and energy. It is also involved in the investment and development of real estate projects. The company was formerly known as AECOM Technology Corporation and changed its name to AECOM in January 2015. AECOM was incorporated in 1980 and is headquartered in Dallas, Texas.
ET
| Score | Price | 52 Week & Averages | Relative Strength | Risk | |||||
|---|---|---|---|---|---|---|---|---|---|
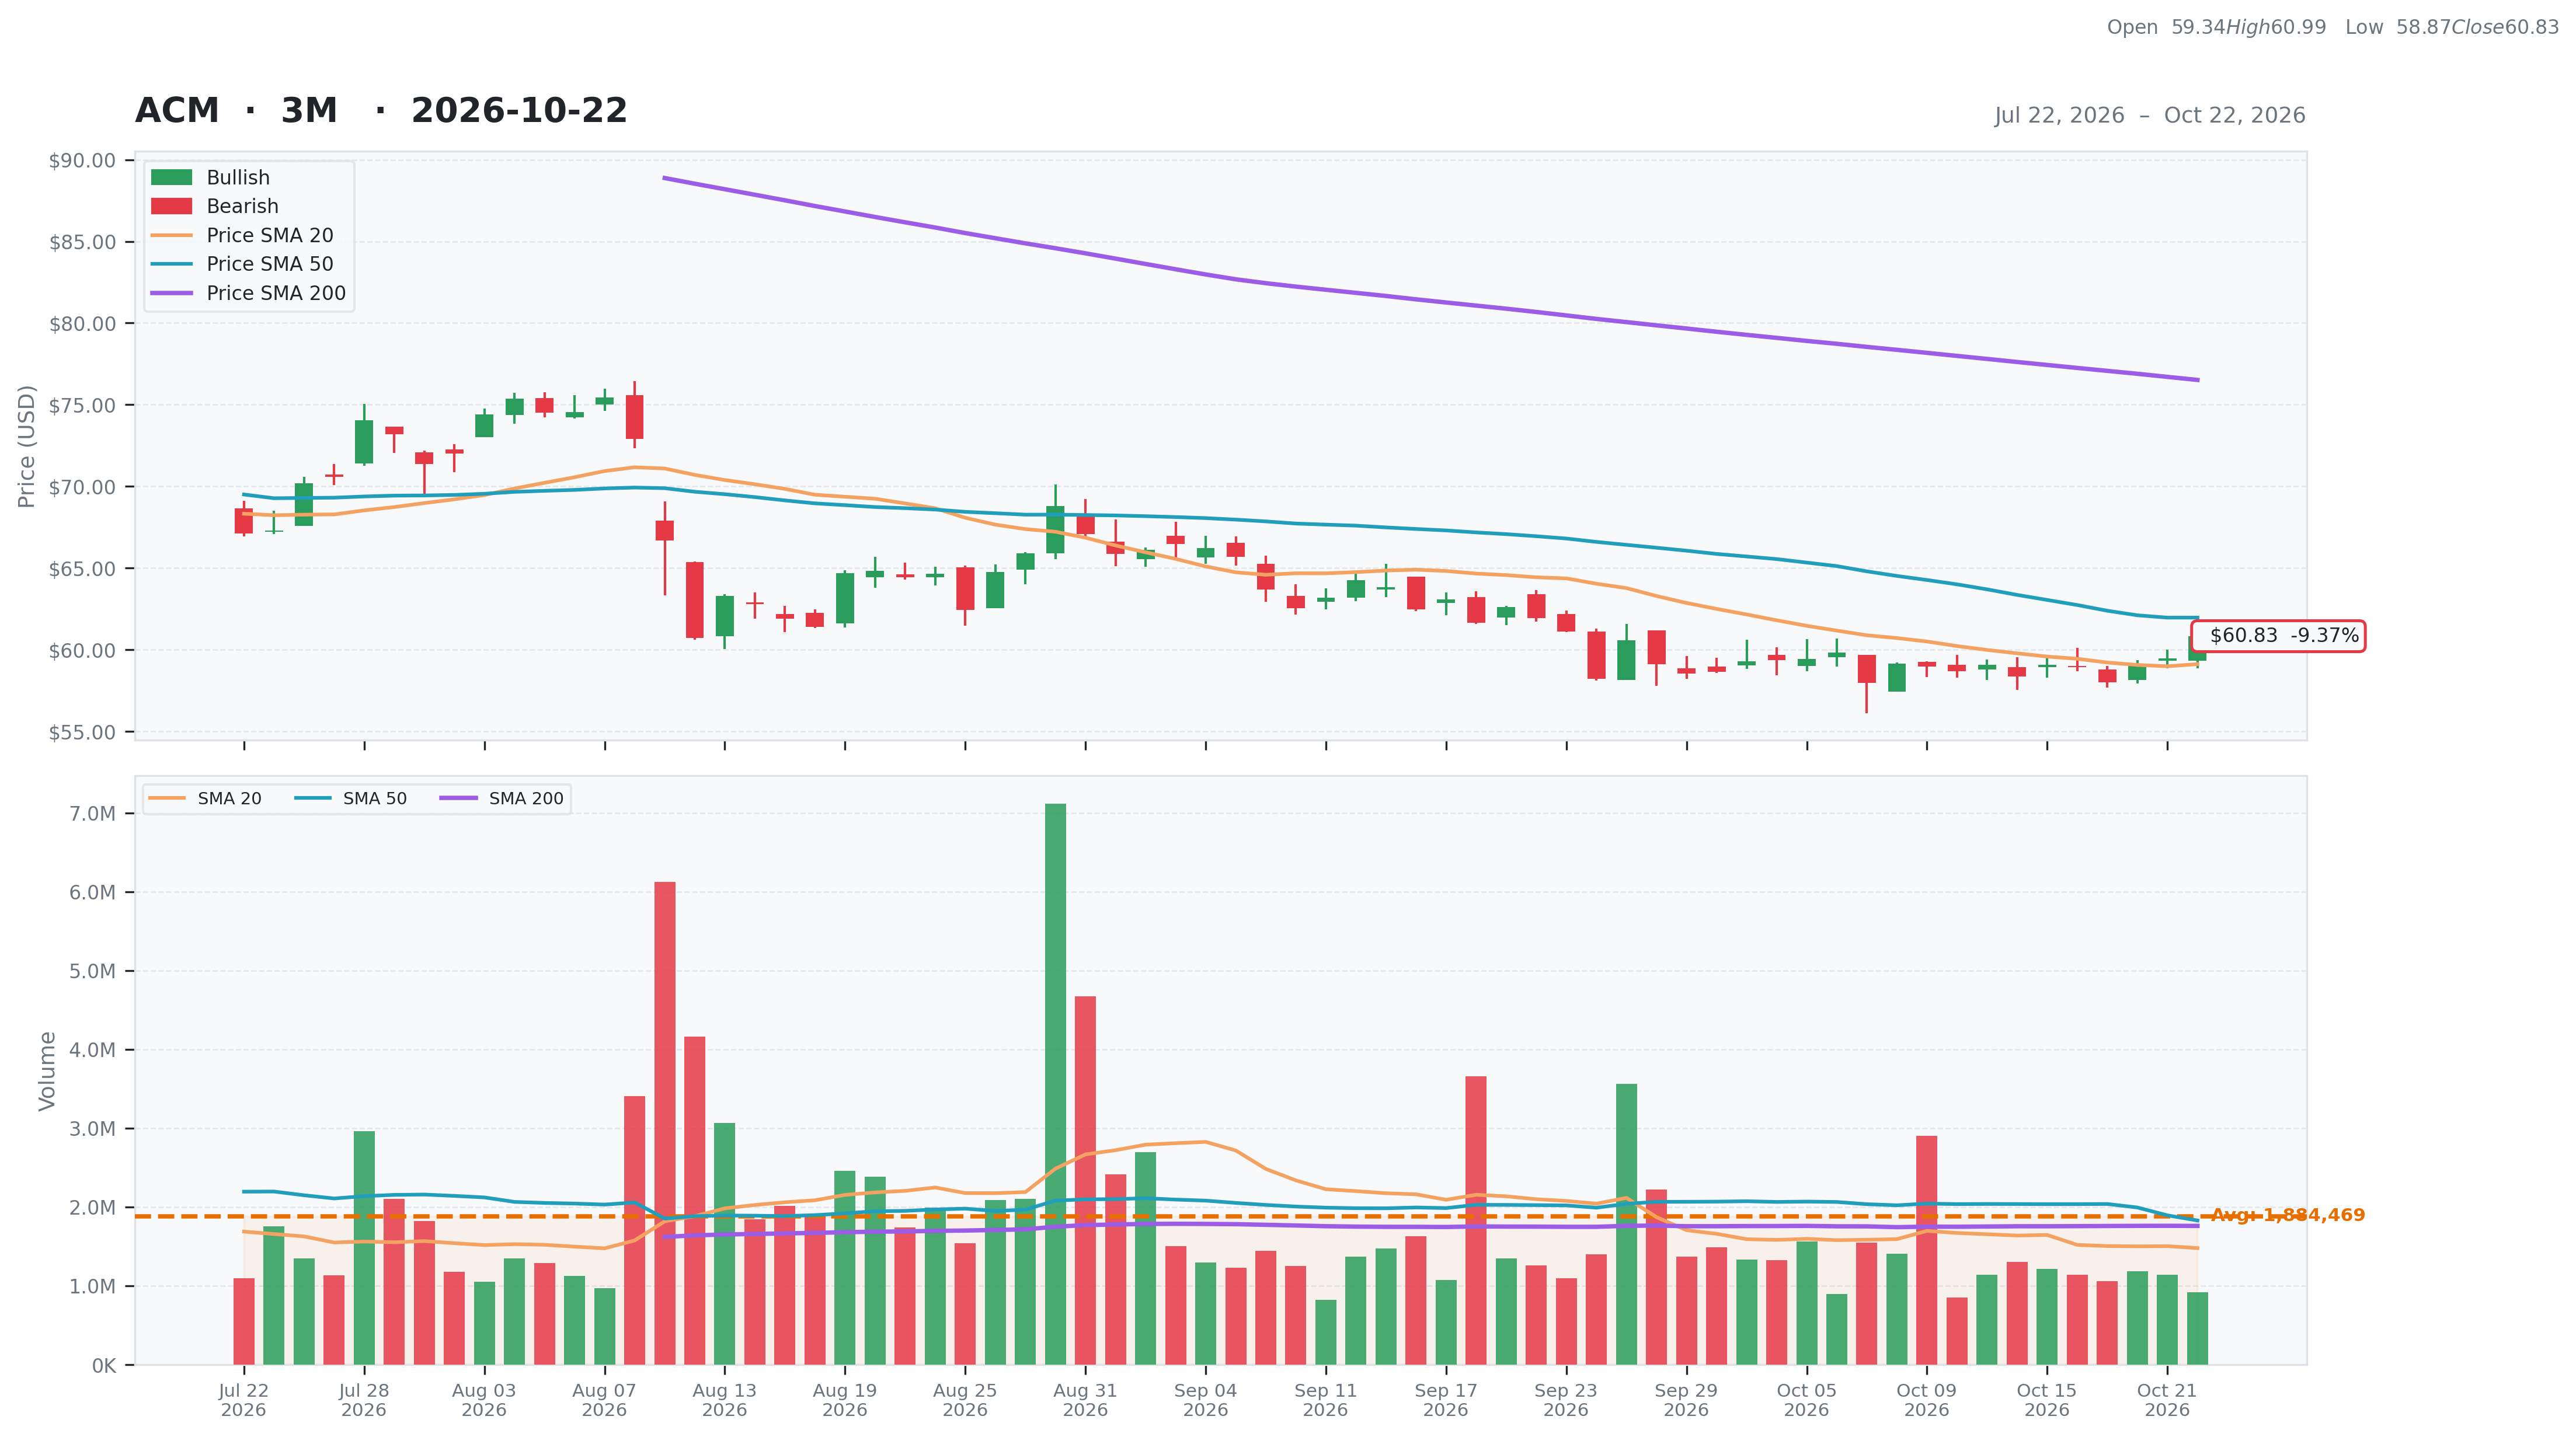
| Total | 38 | Current | $60.83 | 52W High | $132.16 -53.97% | Relative Strength | -0.28 | Beta | 0.93 |
| Business Quality | 1 | Weekly | $59.09 2.94% | 52W Low | $57.98 4.92% | 3M | -0.13 | Short % | 0.06 |
| Financial Strength | 7 | Monthly | $61.94 -1.80% | Above 50DMA | $61.97 -1.84% | 6M | -0.24 | Risk Score | 2 |
| Growth Outlook | 5 | Quarterly | $70.19 -13.34% | Above 200DMA | $76.52 -20.50% | 9M | -0.37 | ||
| Momentum | 3 | Yearly | $130.39 -53.35% | 12M | -0.53 | ||||
| Valuation | Financial Strength | Growth/Profitability | |||
|---|---|---|---|---|---|
| Trailing P/E | 20.75 | Cash | 1,023M | Revenue Growth | -0.14% |
| Forward P/E | 9.40 | Debt | 3,332M | Earnings Growth | N/A |
| PEG Ratio | 0.65 | Debt/Equity | 138.88 | Qtr Earnings Growth | N/A |
| Price/Sales | 0.49 | Current Ratio | 1.06 | Gross Margin | 0.06% |
| Price/Book | 3.46 | Quick Ratio | 0.93 | Operating Margin | -0.02% |
| EV/Revenue | 0.66 | Operating CF | 365M | Profit Margin | 0.02% |
| EV/EBITDA | 10.84 | Free CF | 380M | EBITDA Margin | 0.06% |
| Ent Value | 10,100M | Return on Assets | 0.04% | ||
| Return on Equity | 0.17% | ||||
| Technical | Volume & Bollinger Bands | Analyst | |||
|---|---|---|---|---|---|
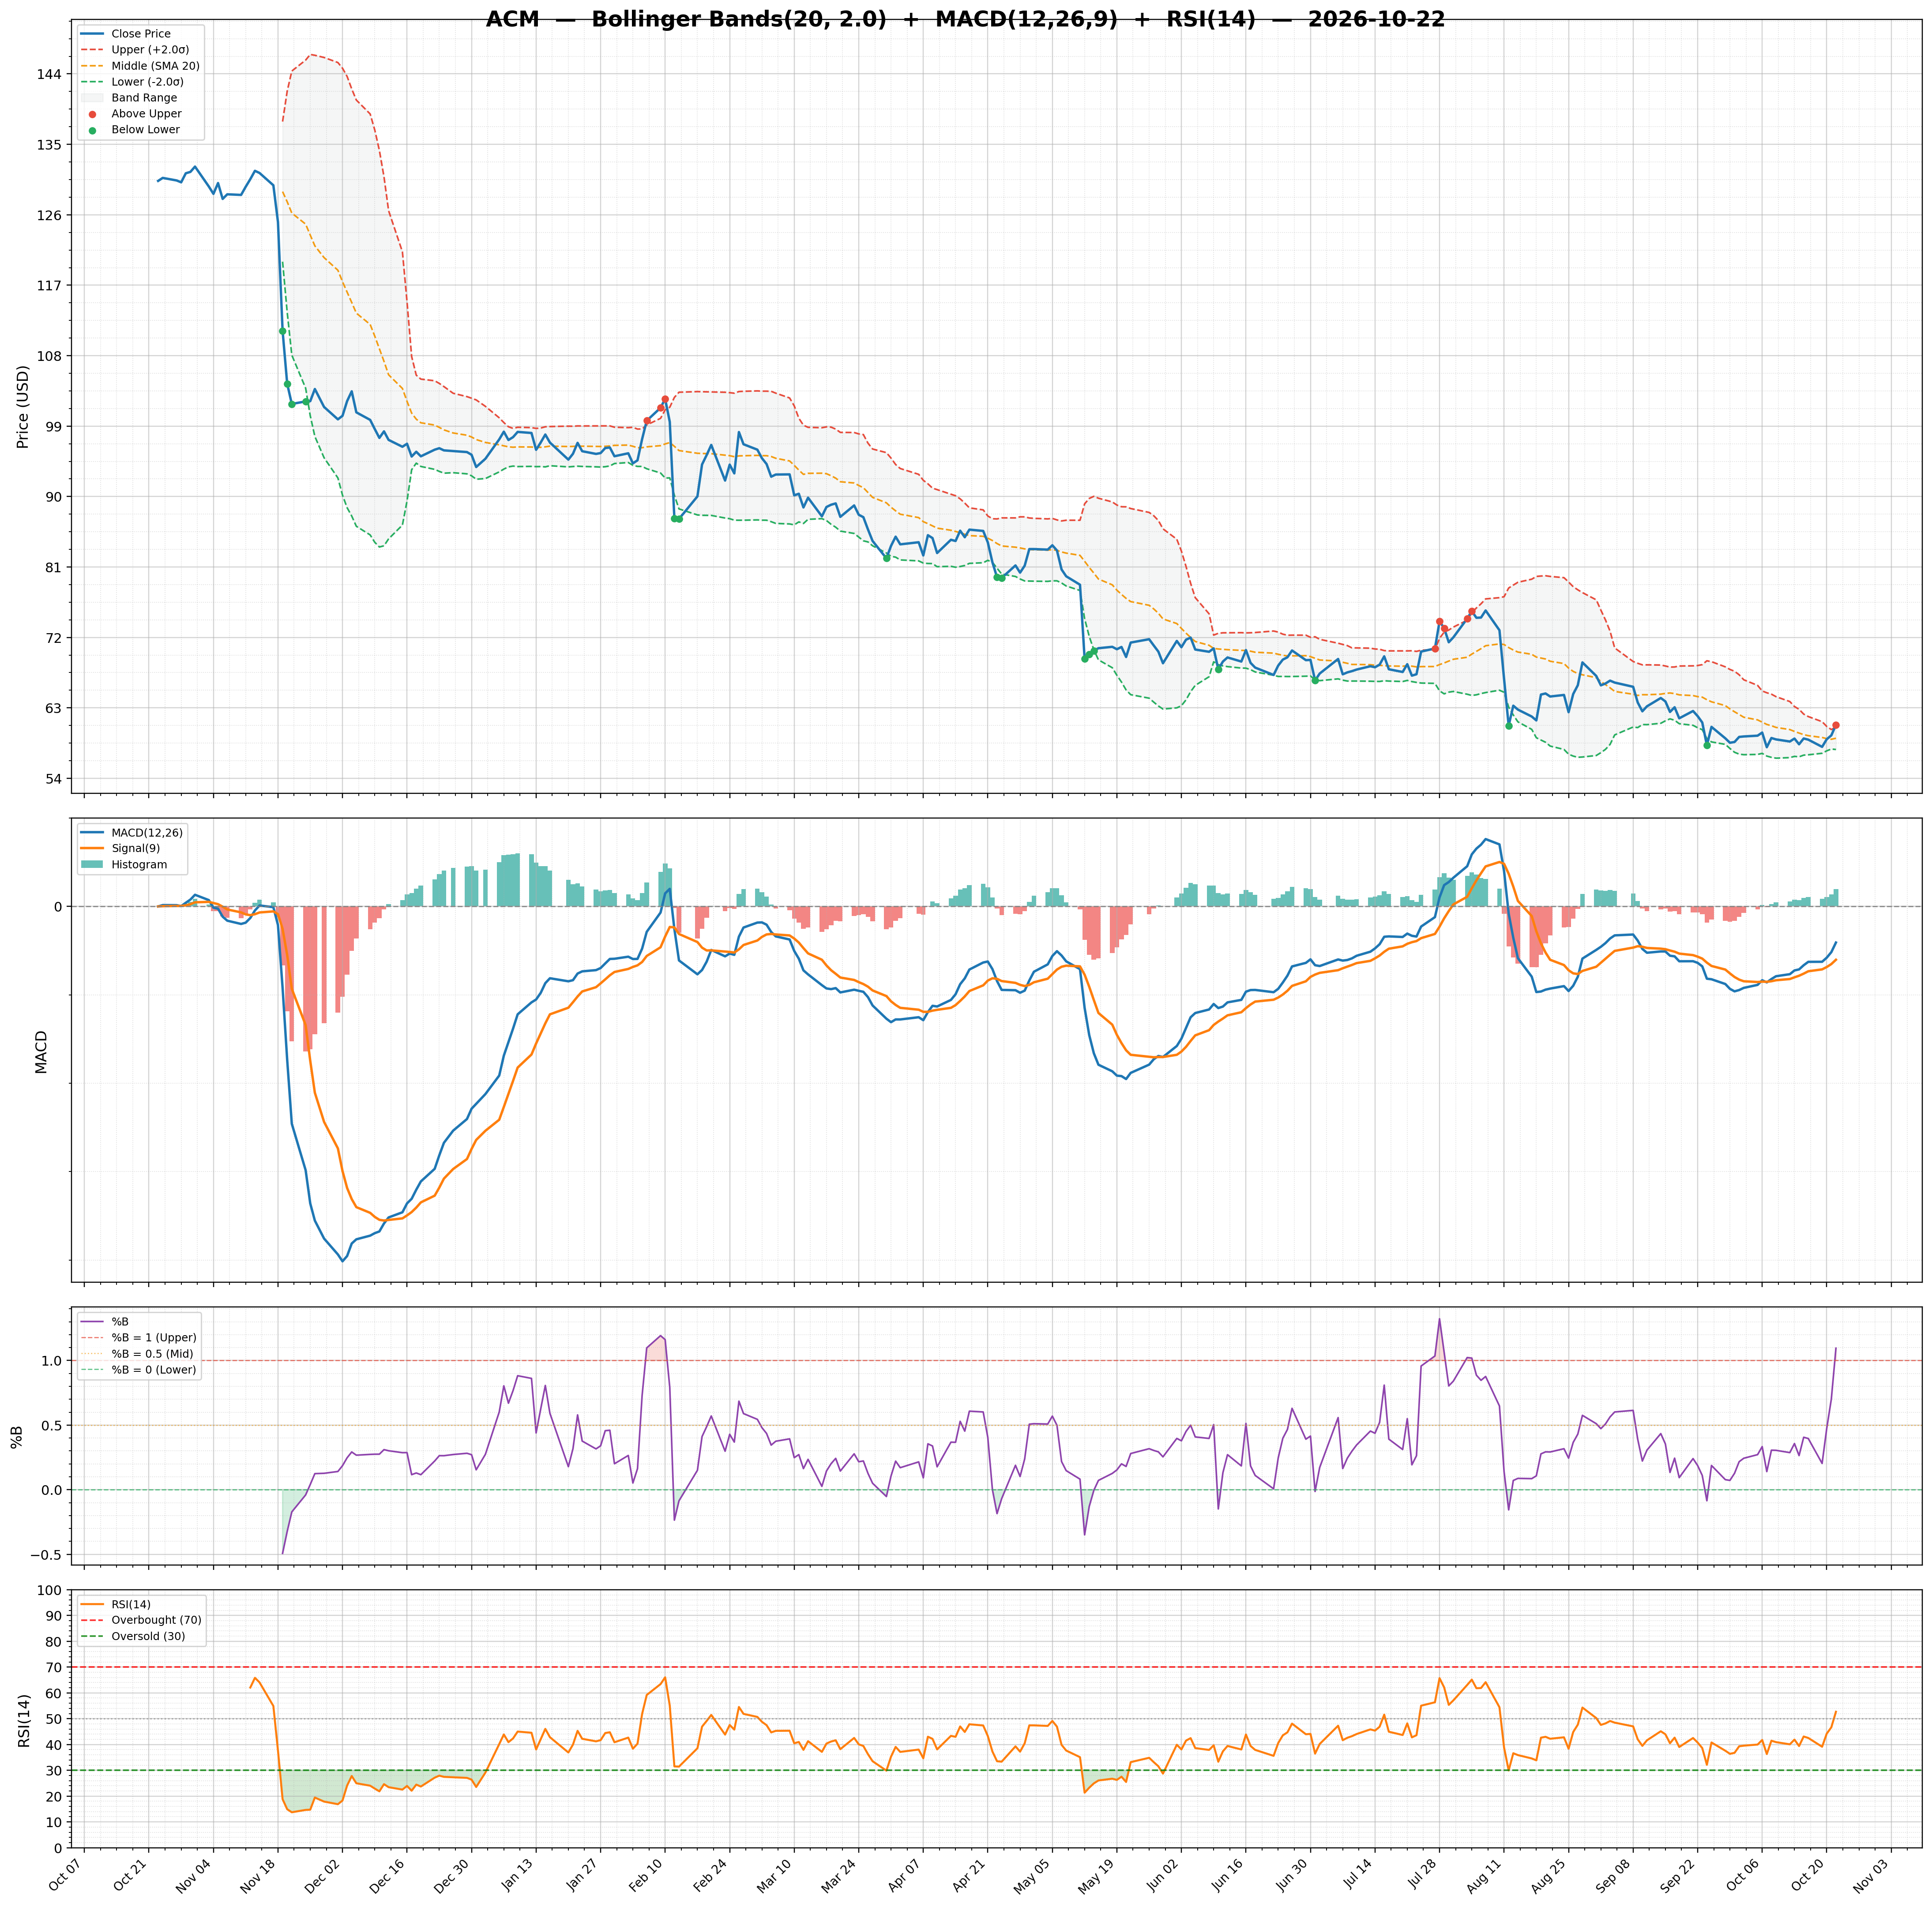
| RSI | 52.70 | Volume | 1.14M | Rating | strong_buy |
| Previous RSI | 46.67 | Avg Volume 20D | 1.48M | Target Mean | $84.33 |
| RSI Trend | Up | Relative Volume | 0.61 | Target High | $104.00 |
| MACD | -0.82 | Lower Band | 57.68 | Target Low | $65.00 |
| MACD Signal | -1.21 | Middle Band | 59.12 | Target Median | $82.50 |
| Histogram | 0.39 | Upper Band | 60.56 | Analysts | 12 |
| Previous Histogram | 0.27 | Bandwidth | 4.860 | Upside | 43.08% |
| Histogram Trend | Increasing | %B | 1.10 | ||