Addus HomeCare Corporation (ADUS)
Healthcare • Medical Care Facilities • $122.67 • MCap: 2,165,845,504
https://www.addus.com • Addus HomeCare Corporation, together with its subsidiaries, provides personal care services to elderly, chronically ill, disabled persons, and individuals who are at risk of hospitalization or institutionalization in the United States. The company operates through three segments: Personal Care, Hospice, and Home Health. Its Personal Care segment provides non-medical assistance with activities of daily living. This segment offers services that include assistance with bathing, grooming, oral care, feeding and dressing, medication reminders, meal planning and preparation, housekeeping, and transportation services. The Hospice segment provides palliative nursing care, social work, spiritual counseling, homemaker, and bereavement counseling services for people who are terminally ill, as well as related services for their families. Its Home Health segment offers skilled nursing and physical, occupational, and speech therapy for the individuals who requires assistance during an illness or after hospitalization. The company serves federal, state, and local governmental agencies; managed care organizations; commercial insurers; and private individuals. Addus HomeCare Corporation was founded in 1979 and is based in Frisco, Texas.
Ex-AAII
| Score | Price | 52 Week & Averages | Relative Strength | Risk | |||||
|---|---|---|---|---|---|---|---|---|---|
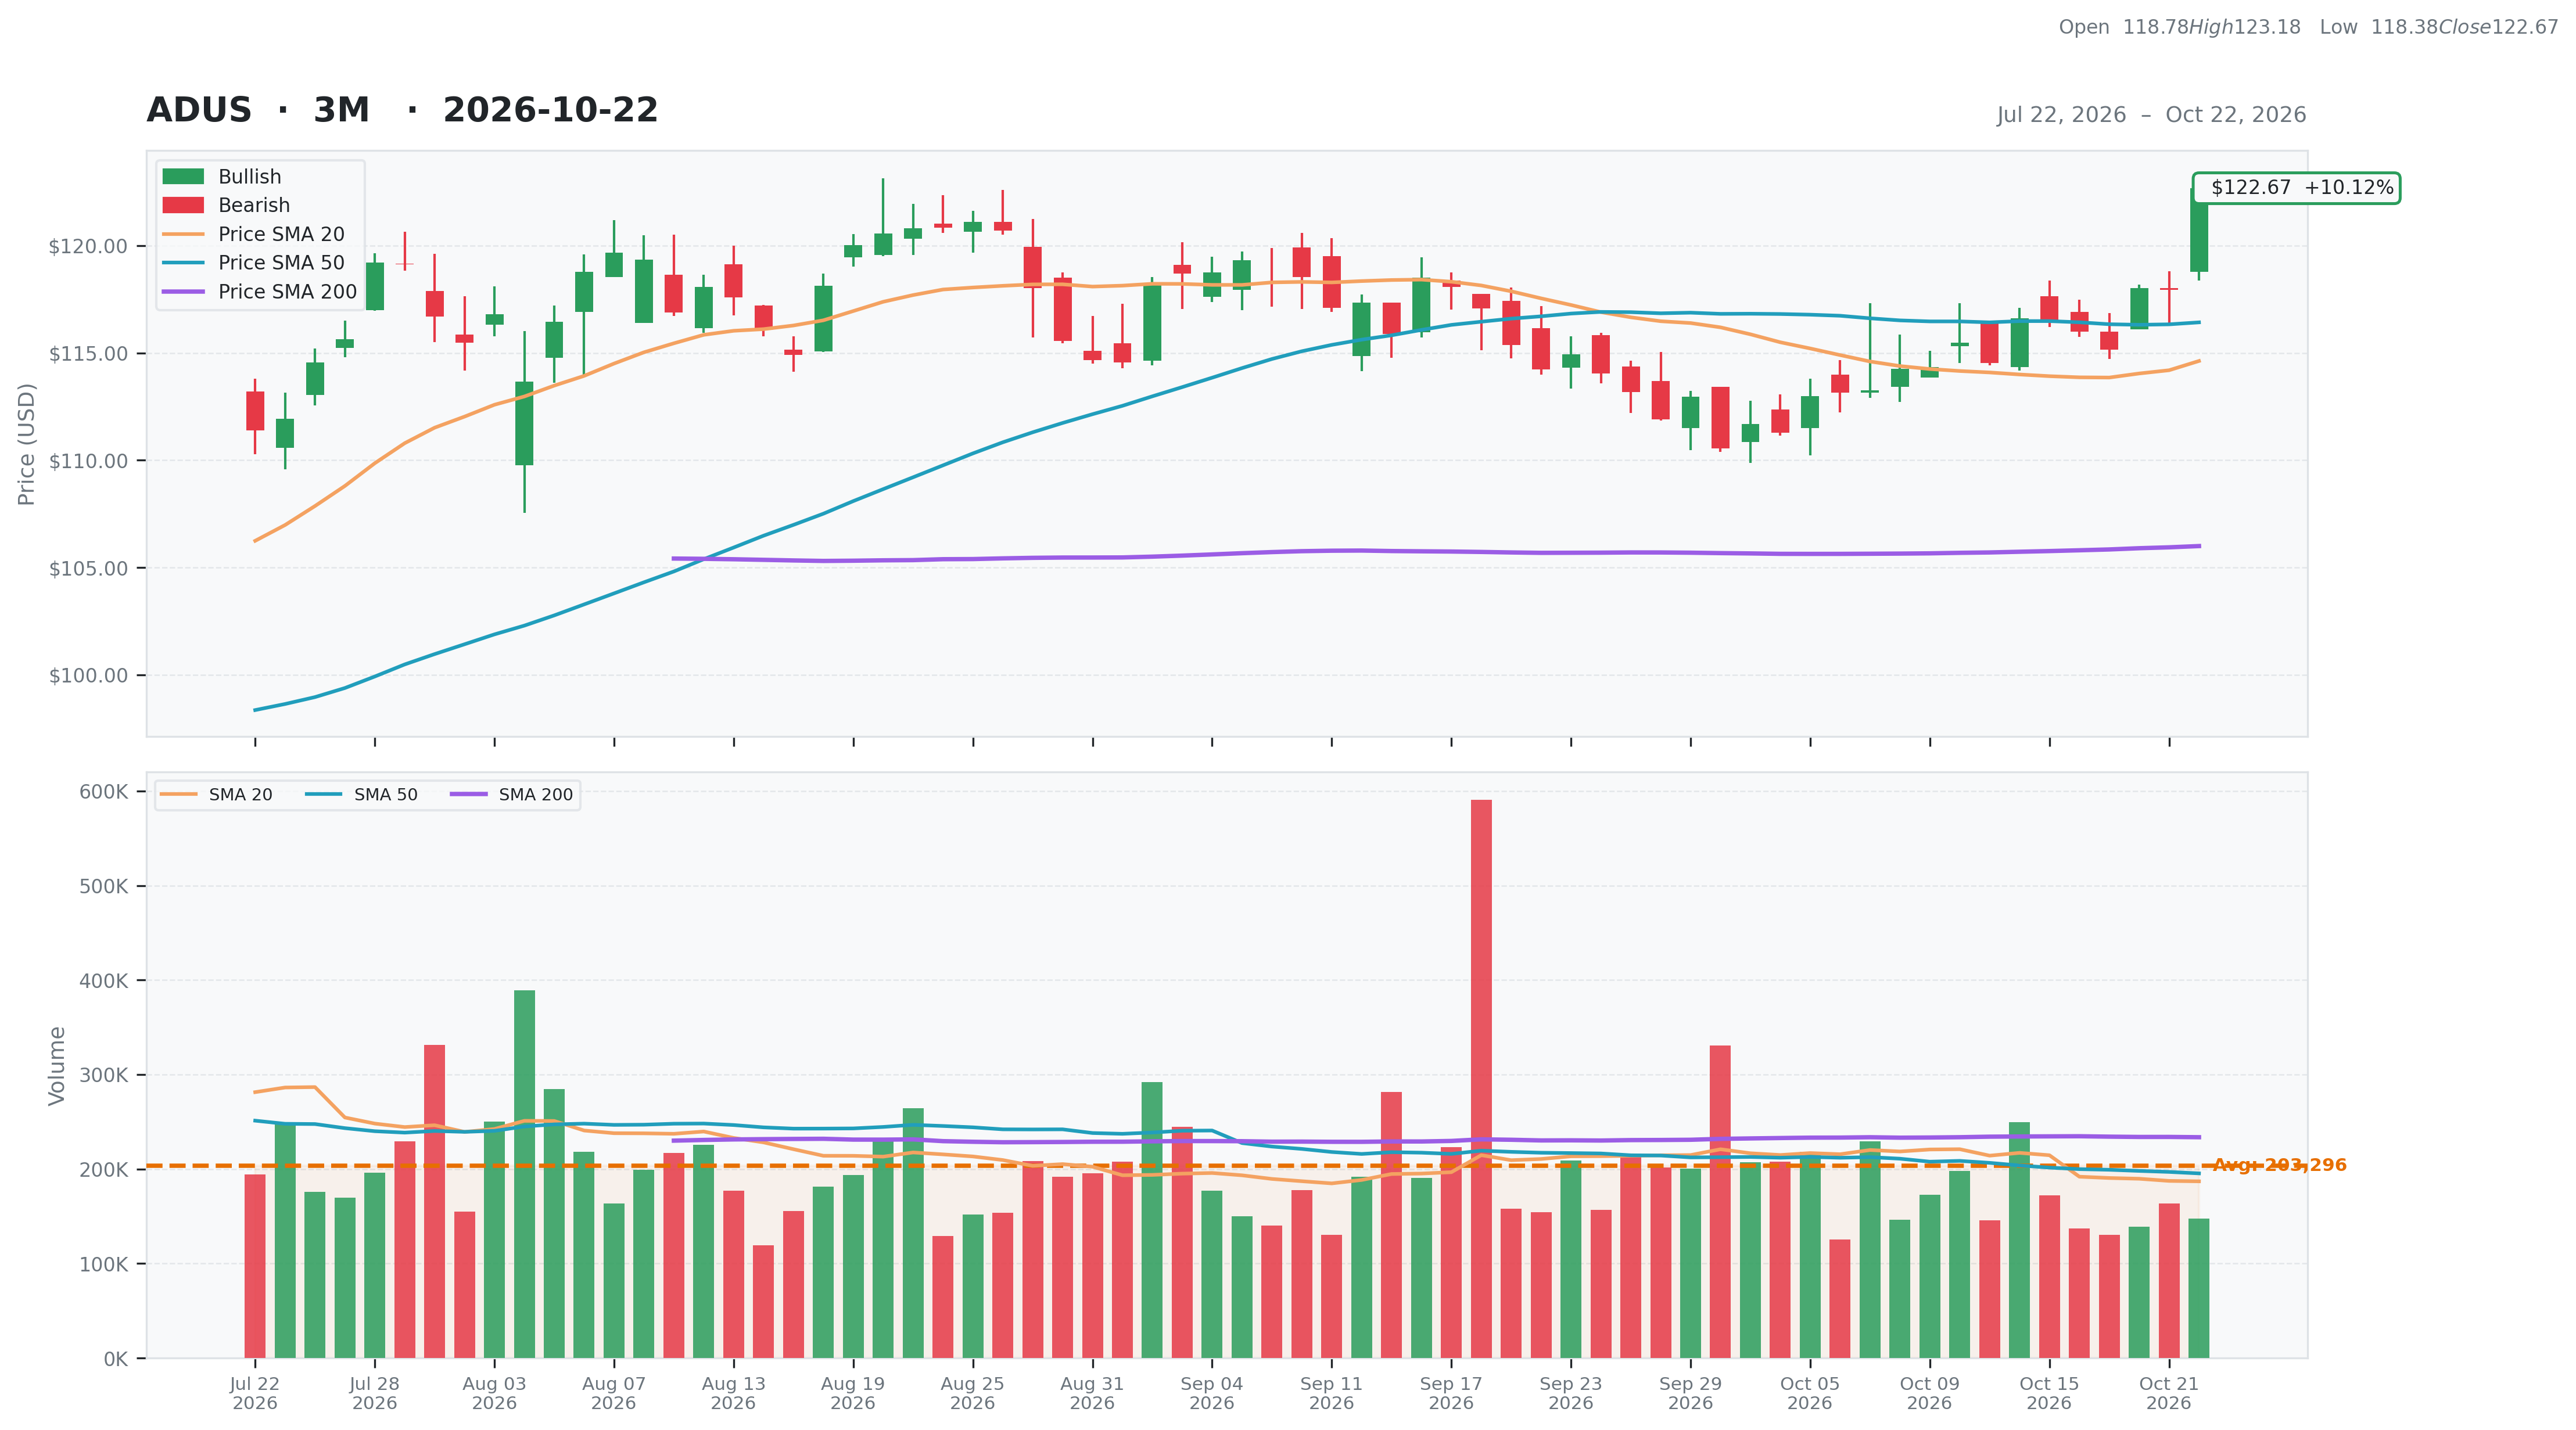
| Total | 60 | Current | $122.67 | 52W High | $122.75 -0.07% | Relative Strength | 0.11 | Beta | 0.83 |
| Business Quality | 8 | Weekly | $116.49 5.31% | 52W Low | $88.49 38.63% | 3M | 0.07 | Short % | 0.06 |
| Financial Strength | 14 | Monthly | $114.24 7.38% | Above 50DMA | $116.42 5.37% | 6M | 0.30 | Risk Score | 6 |
| Growth Outlook | 13 | Quarterly | $114.55 7.09% | Above 200DMA | $106.00 15.72% | 9M | 0.11 | ||
| Momentum | 5 | Yearly | $121.46 1.00% | 12M | 0.01 | ||||
| Valuation | Financial Strength | Growth/Profitability | |||
|---|---|---|---|---|---|
| Trailing P/E | 20.31 | Cash | 100M | Revenue Growth | 0.08% |
| Forward P/E | 15.43 | Debt | 109M | Earnings Growth | 0.24% |
| PEG Ratio | 1.02 | Debt/Equity | 9.48 | Qtr Earnings Growth | 0.25% |
| Price/Sales | 1.47 | Current Ratio | 1.69 | Gross Margin | 0.32% |
| Price/Book | 1.85 | Quick Ratio | 1.46 | Operating Margin | 0.10% |
| EV/Revenue | 1.44 | Operating CF | 162M | Profit Margin | 0.07% |
| EV/EBITDA | 13.27 | Free CF | 116M | EBITDA Margin | 0.11% |
| Ent Value | 2,131M | Return on Assets | 0.06% | ||
| Return on Equity | 0.10% | ||||
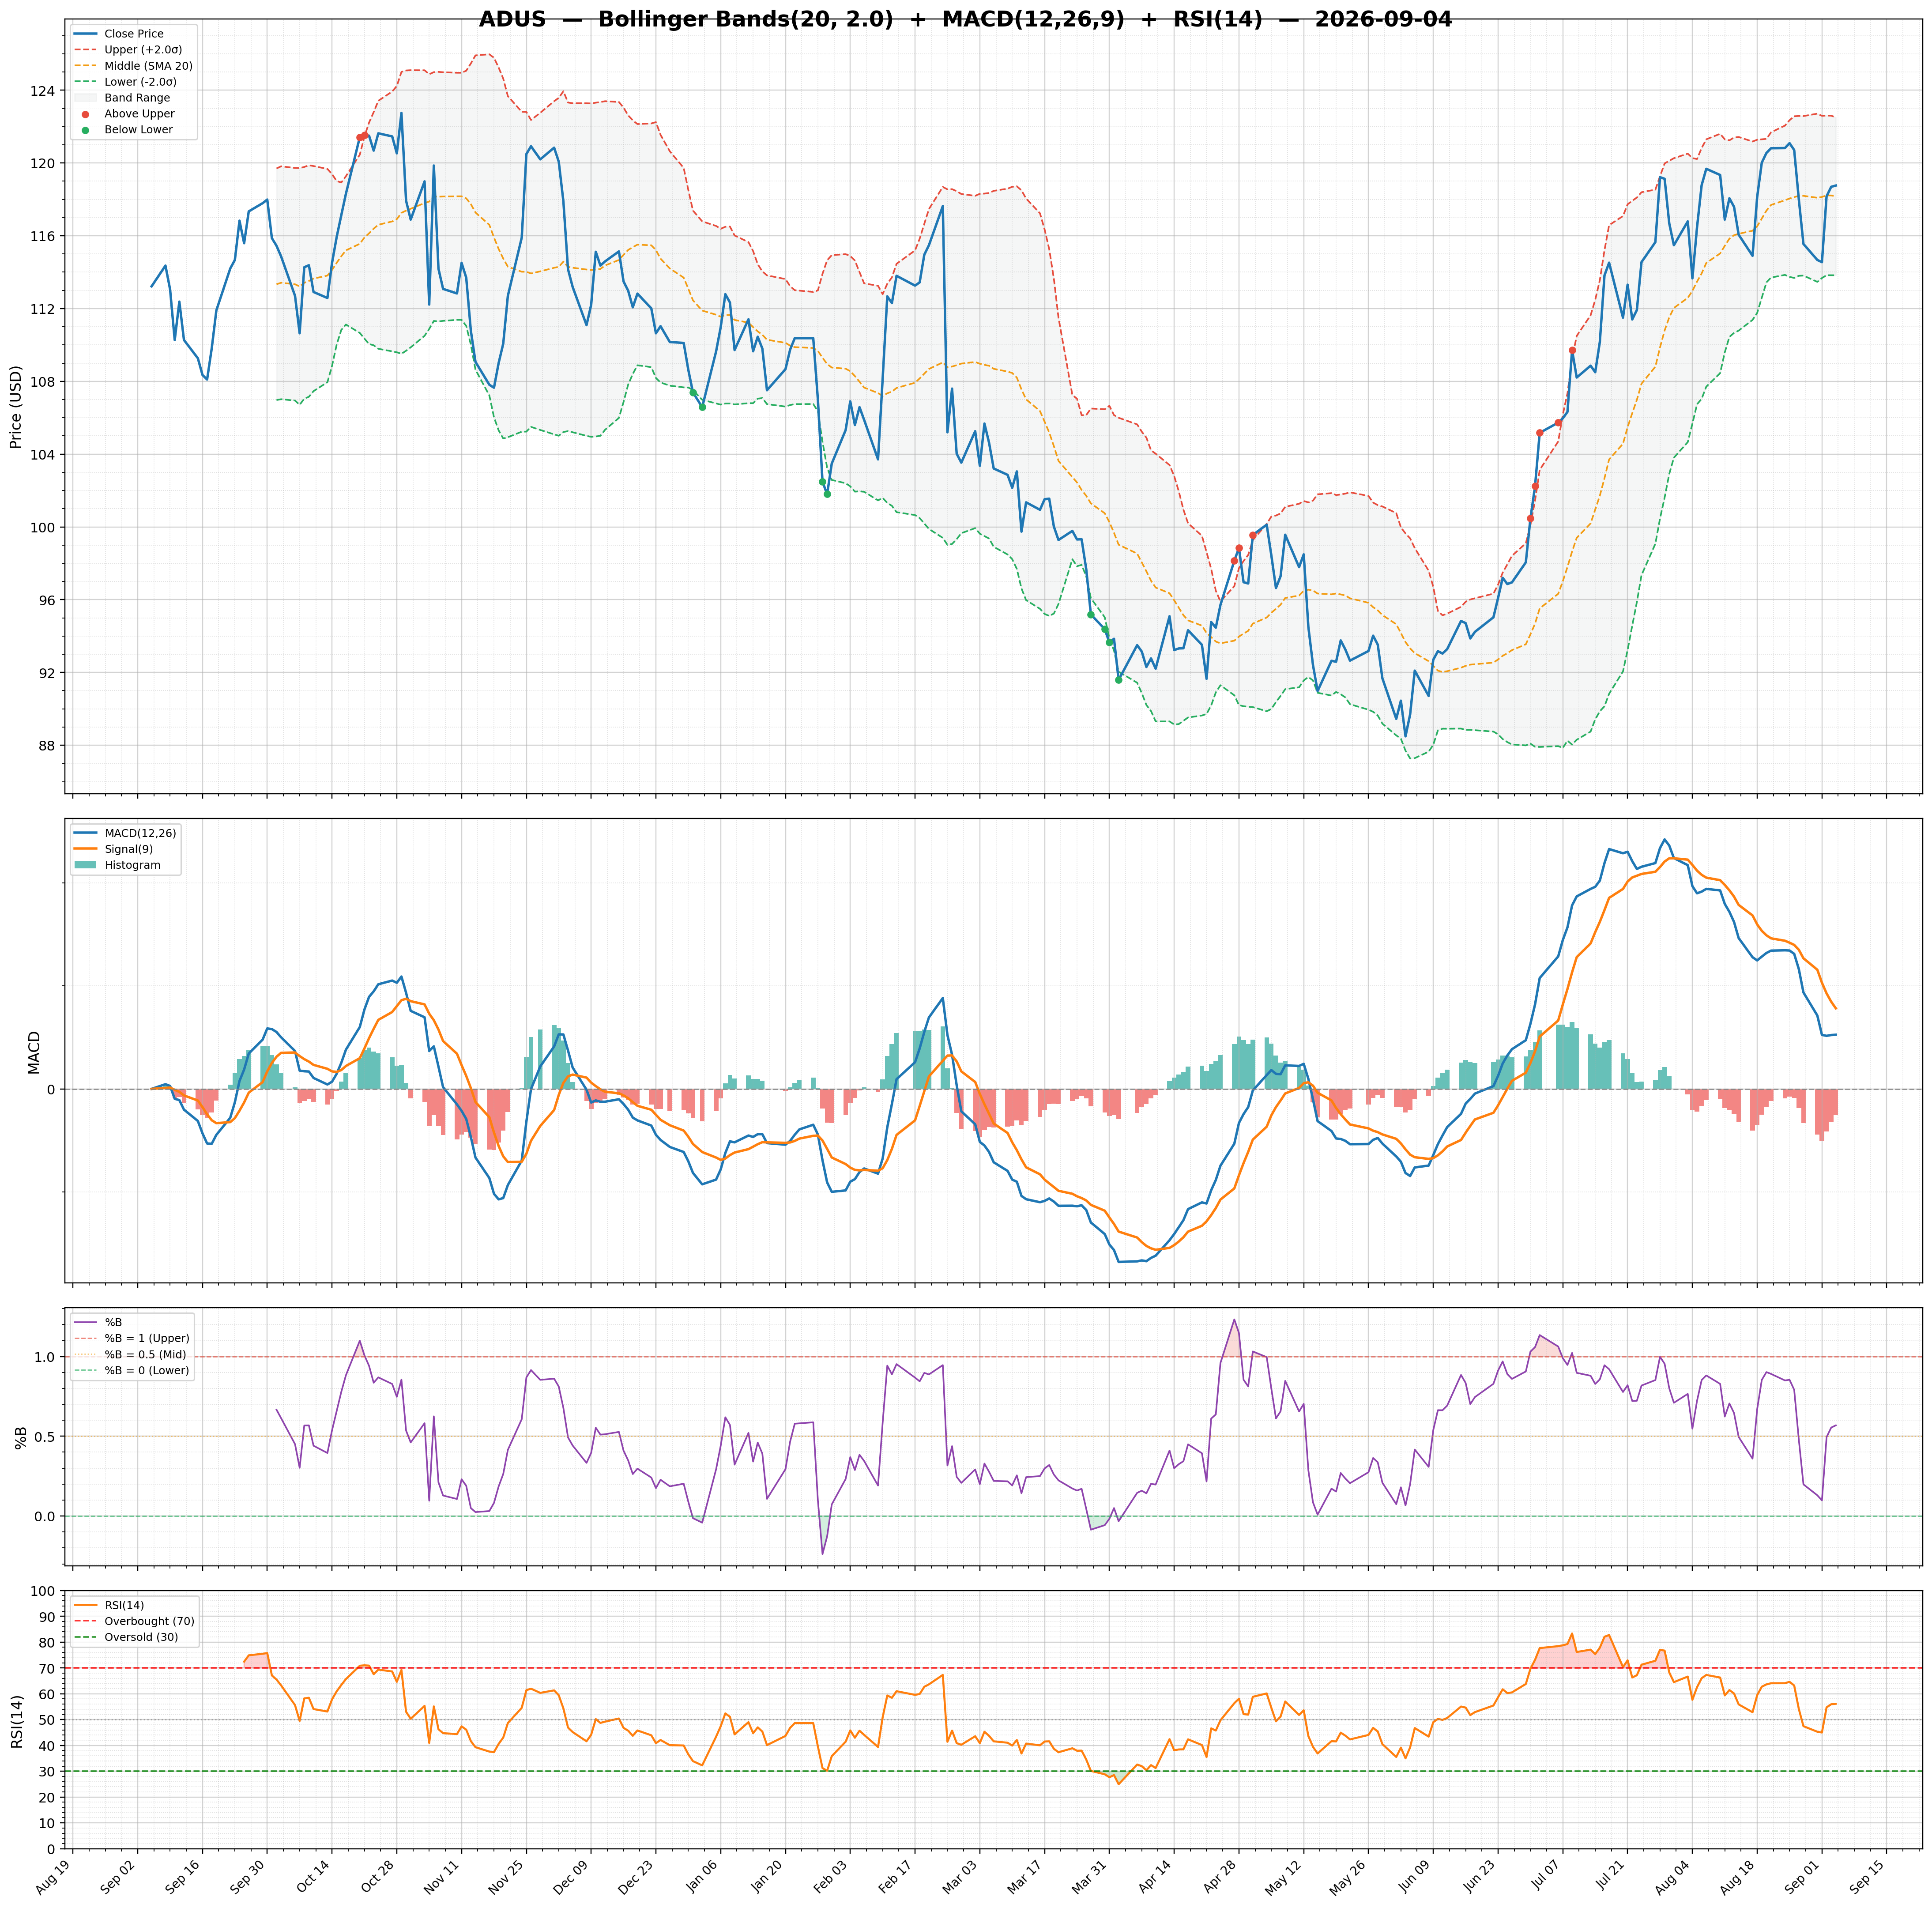
| Technical | Volume & Bollinger Bands | Analyst | |||
|---|---|---|---|---|---|
| RSI | 70.39 | Volume | 0.14M | Rating | buy |
| Previous RSI | 59.81 | Avg Volume 20D | 0.19M | Target Mean | $134.08 |
| RSI Trend | Up | Relative Volume | 0.73 | Target High | $155.00 |
| MACD | 0.96 | Lower Band | 108.94 | Target Low | $96.00 |
| MACD Signal | 0.09 | Middle Band | 114.62 | Target Median | $137.00 |
| Histogram | 0.87 | Upper Band | 120.30 | Analysts | 13 |
| Previous Histogram | 0.57 | Bandwidth | 9.910 | Upside | 15.60% |
| Histogram Trend | Increasing | %B | 1.21 | ||