American Eagle Outfitters, Inc. (AEO)
Consumer Cyclical • Apparel Retail • $17.89 • MCap: 3,012,968,448
https://www.aeo-inc.com • American Eagle Outfitters, Inc. operates as a multi-brand specialty retailer in the United States and internationally. It provides jeans, apparel and accessories, and personal care products for women and men under the American Eagle brand; and intimates, apparel, activewear, and swim collections under the Aerie and OFFLINE by Aerie brands. The company also offers menswear products under the Todd Snyder New York brand; and fashion clothing and accessories under the Unsubscribed brand. It sells its products through its own and licensed retail stores, concession-based shops-within-shops, wholesale markets, and online marketplaces; and digital channels, such as www.ae.com, www.aerie.com, www.toddsnyder.com, and www.unsubscribed.com. American Eagle Outfitters, Inc. was founded in 1977 and is headquartered in Pittsburgh, Pennsylvania.
ET
| Score | Price | 52 Week & Averages | Relative Strength | Risk | |||||
|---|---|---|---|---|---|---|---|---|---|
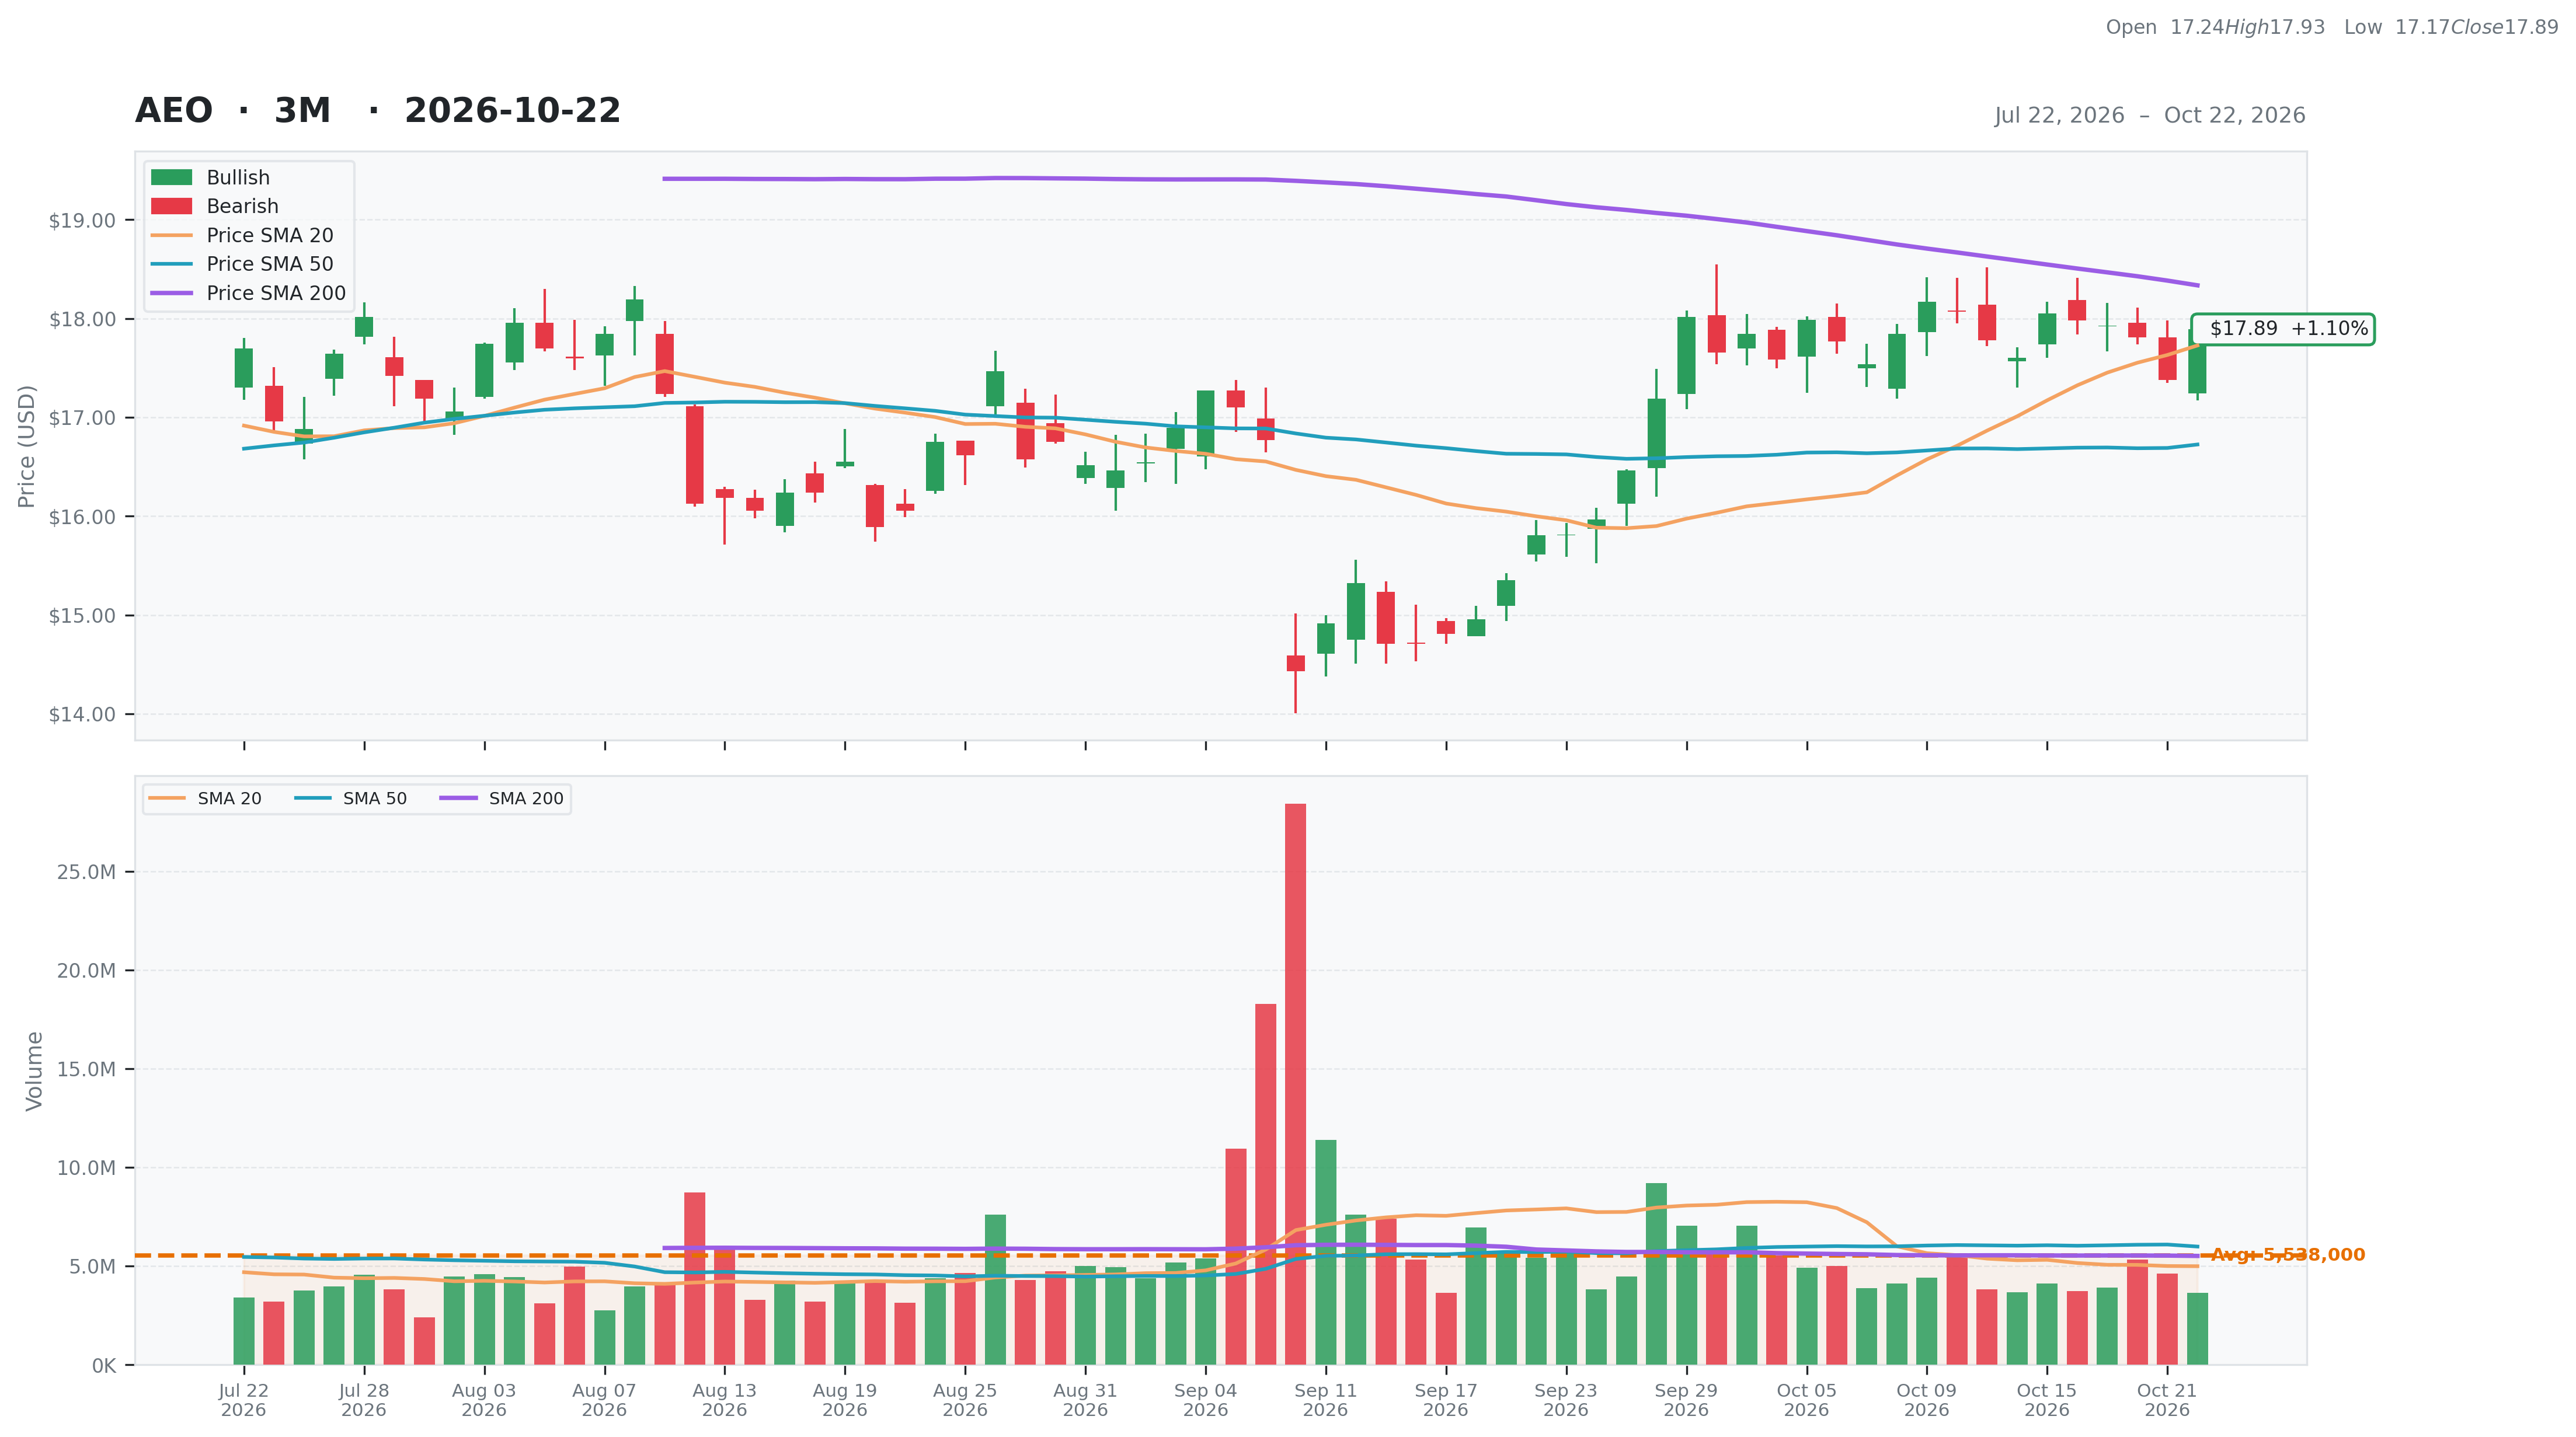
| Total | 51 | Current | $17.89 | 52W High | $27.47 -34.88% | Relative Strength | -0.01 | Beta | 1.26 |
| Business Quality | 9 | Weekly | $18.05 -0.89% | 52W Low | $14.43 23.99% | 3M | 0.06 | Short % | 0.13 |
| Financial Strength | 13 | Monthly | $15.81 13.16% | Above 50DMA | $16.73 6.96% | 6M | 0.00 | Risk Score | 3 |
| Growth Outlook | 11 | Quarterly | $16.88 5.97% | Above 200DMA | $18.34 -2.43% | 9M | -0.27 | ||
| Momentum | 0 | Yearly | $16.45 8.75% | 12M | 0.11 | ||||
| Valuation | Financial Strength | Growth/Profitability | |||
|---|---|---|---|---|---|
| Trailing P/E | 9.22 | Cash | 148M | Revenue Growth | 0.08% |
| Forward P/E | 9.35 | Debt | 1,921M | Earnings Growth | 0.76% |
| PEG Ratio | 3.34 | Debt/Equity | 108.99 | Qtr Earnings Growth | 0.73% |
| Price/Sales | 0.52 | Current Ratio | 1.59 | Gross Margin | 0.37% |
| Price/Book | 1.71 | Quick Ratio | 0.47 | Operating Margin | 0.02% |
| EV/Revenue | 0.83 | Operating CF | 599M | Profit Margin | 0.06% |
| EV/EBITDA | 8.39 | Free CF | 211M | EBITDA Margin | 0.10% |
| Ent Value | 4,785M | Return on Assets | 0.05% | ||
| Return on Equity | 0.20% | ||||
| Technical | Volume & Bollinger Bands | Analyst | |||
|---|---|---|---|---|---|
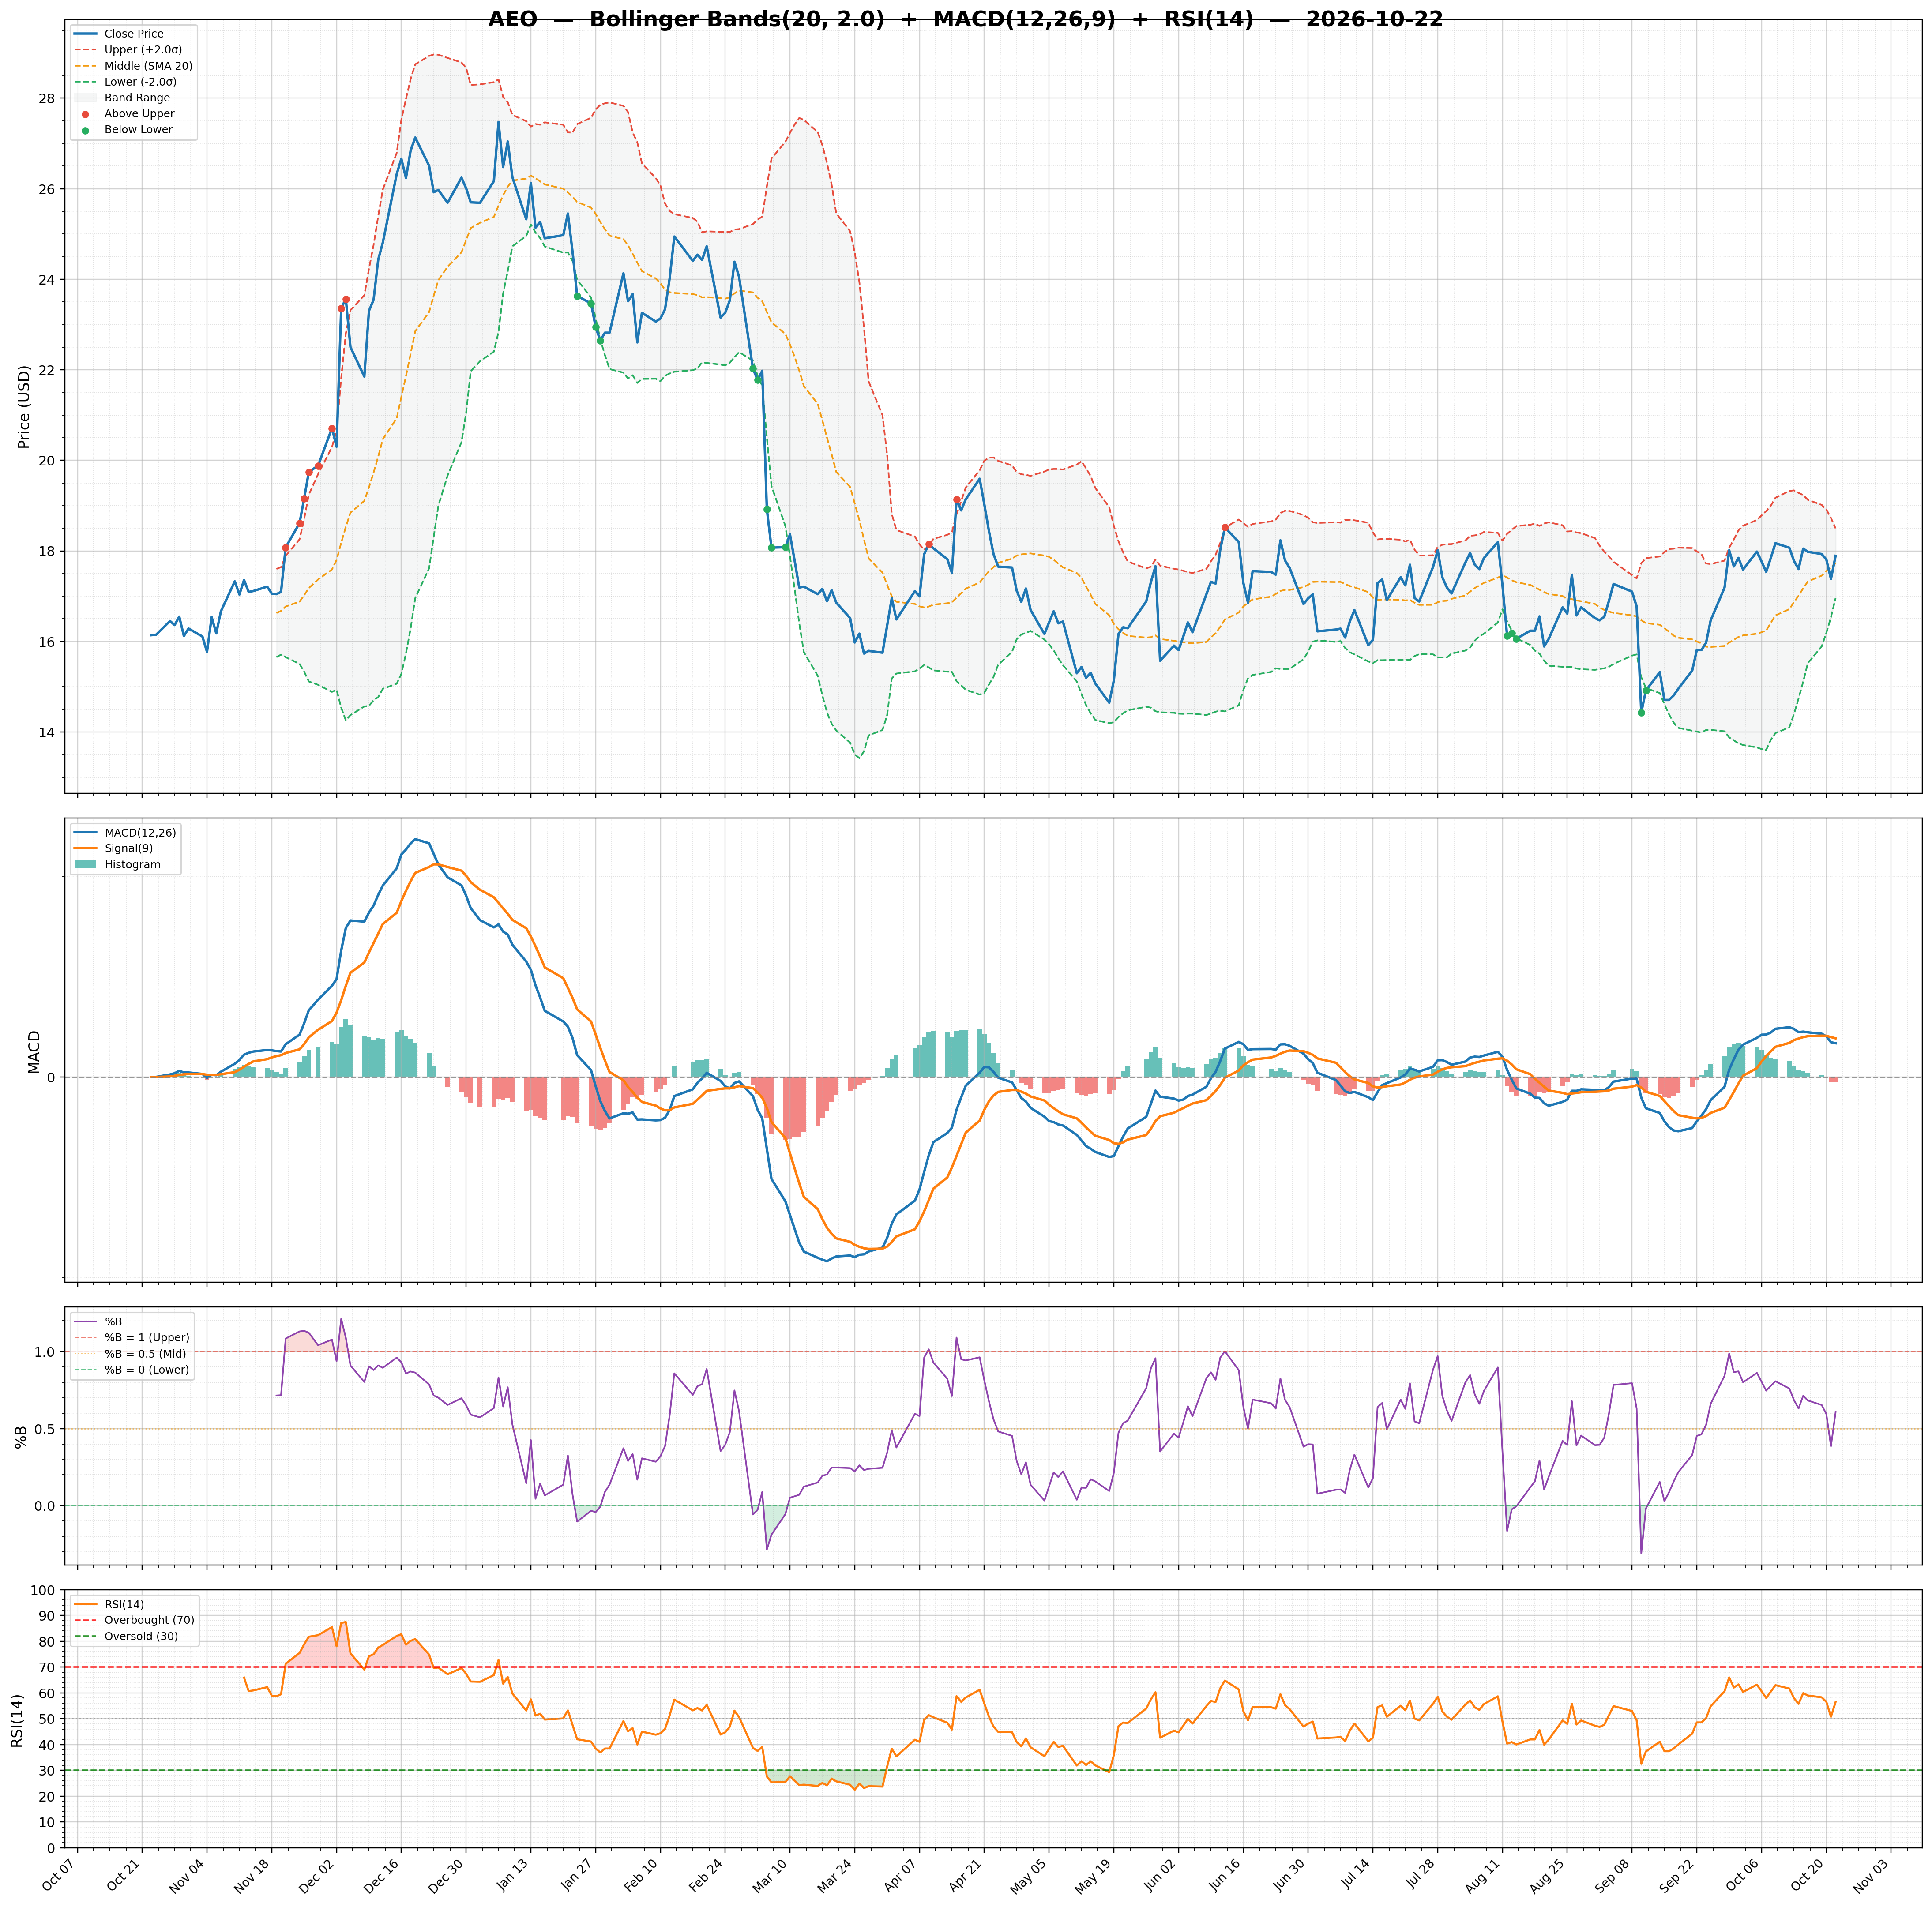
| RSI | 56.46 | Volume | 3.32M | Rating | none |
| Previous RSI | 50.75 | Avg Volume 20D | 4.99M | Target Mean | $18.55 |
| RSI Trend | Up | Relative Volume | 0.67 | Target High | $27.00 |
| MACD | 0.34 | Lower Band | 16.96 | Target Low | $15.00 |
| MACD Signal | 0.39 | Middle Band | 17.73 | Target Median | $18.00 |
| Histogram | -0.05 | Upper Band | 18.50 | Analysts | 11 |
| Previous Histogram | -0.05 | Bandwidth | 8.690 | Upside | 3.14% |
| Histogram Trend | Increasing | %B | 0.61 | ||