AirSculpt Technologies, Inc. (AIRS)
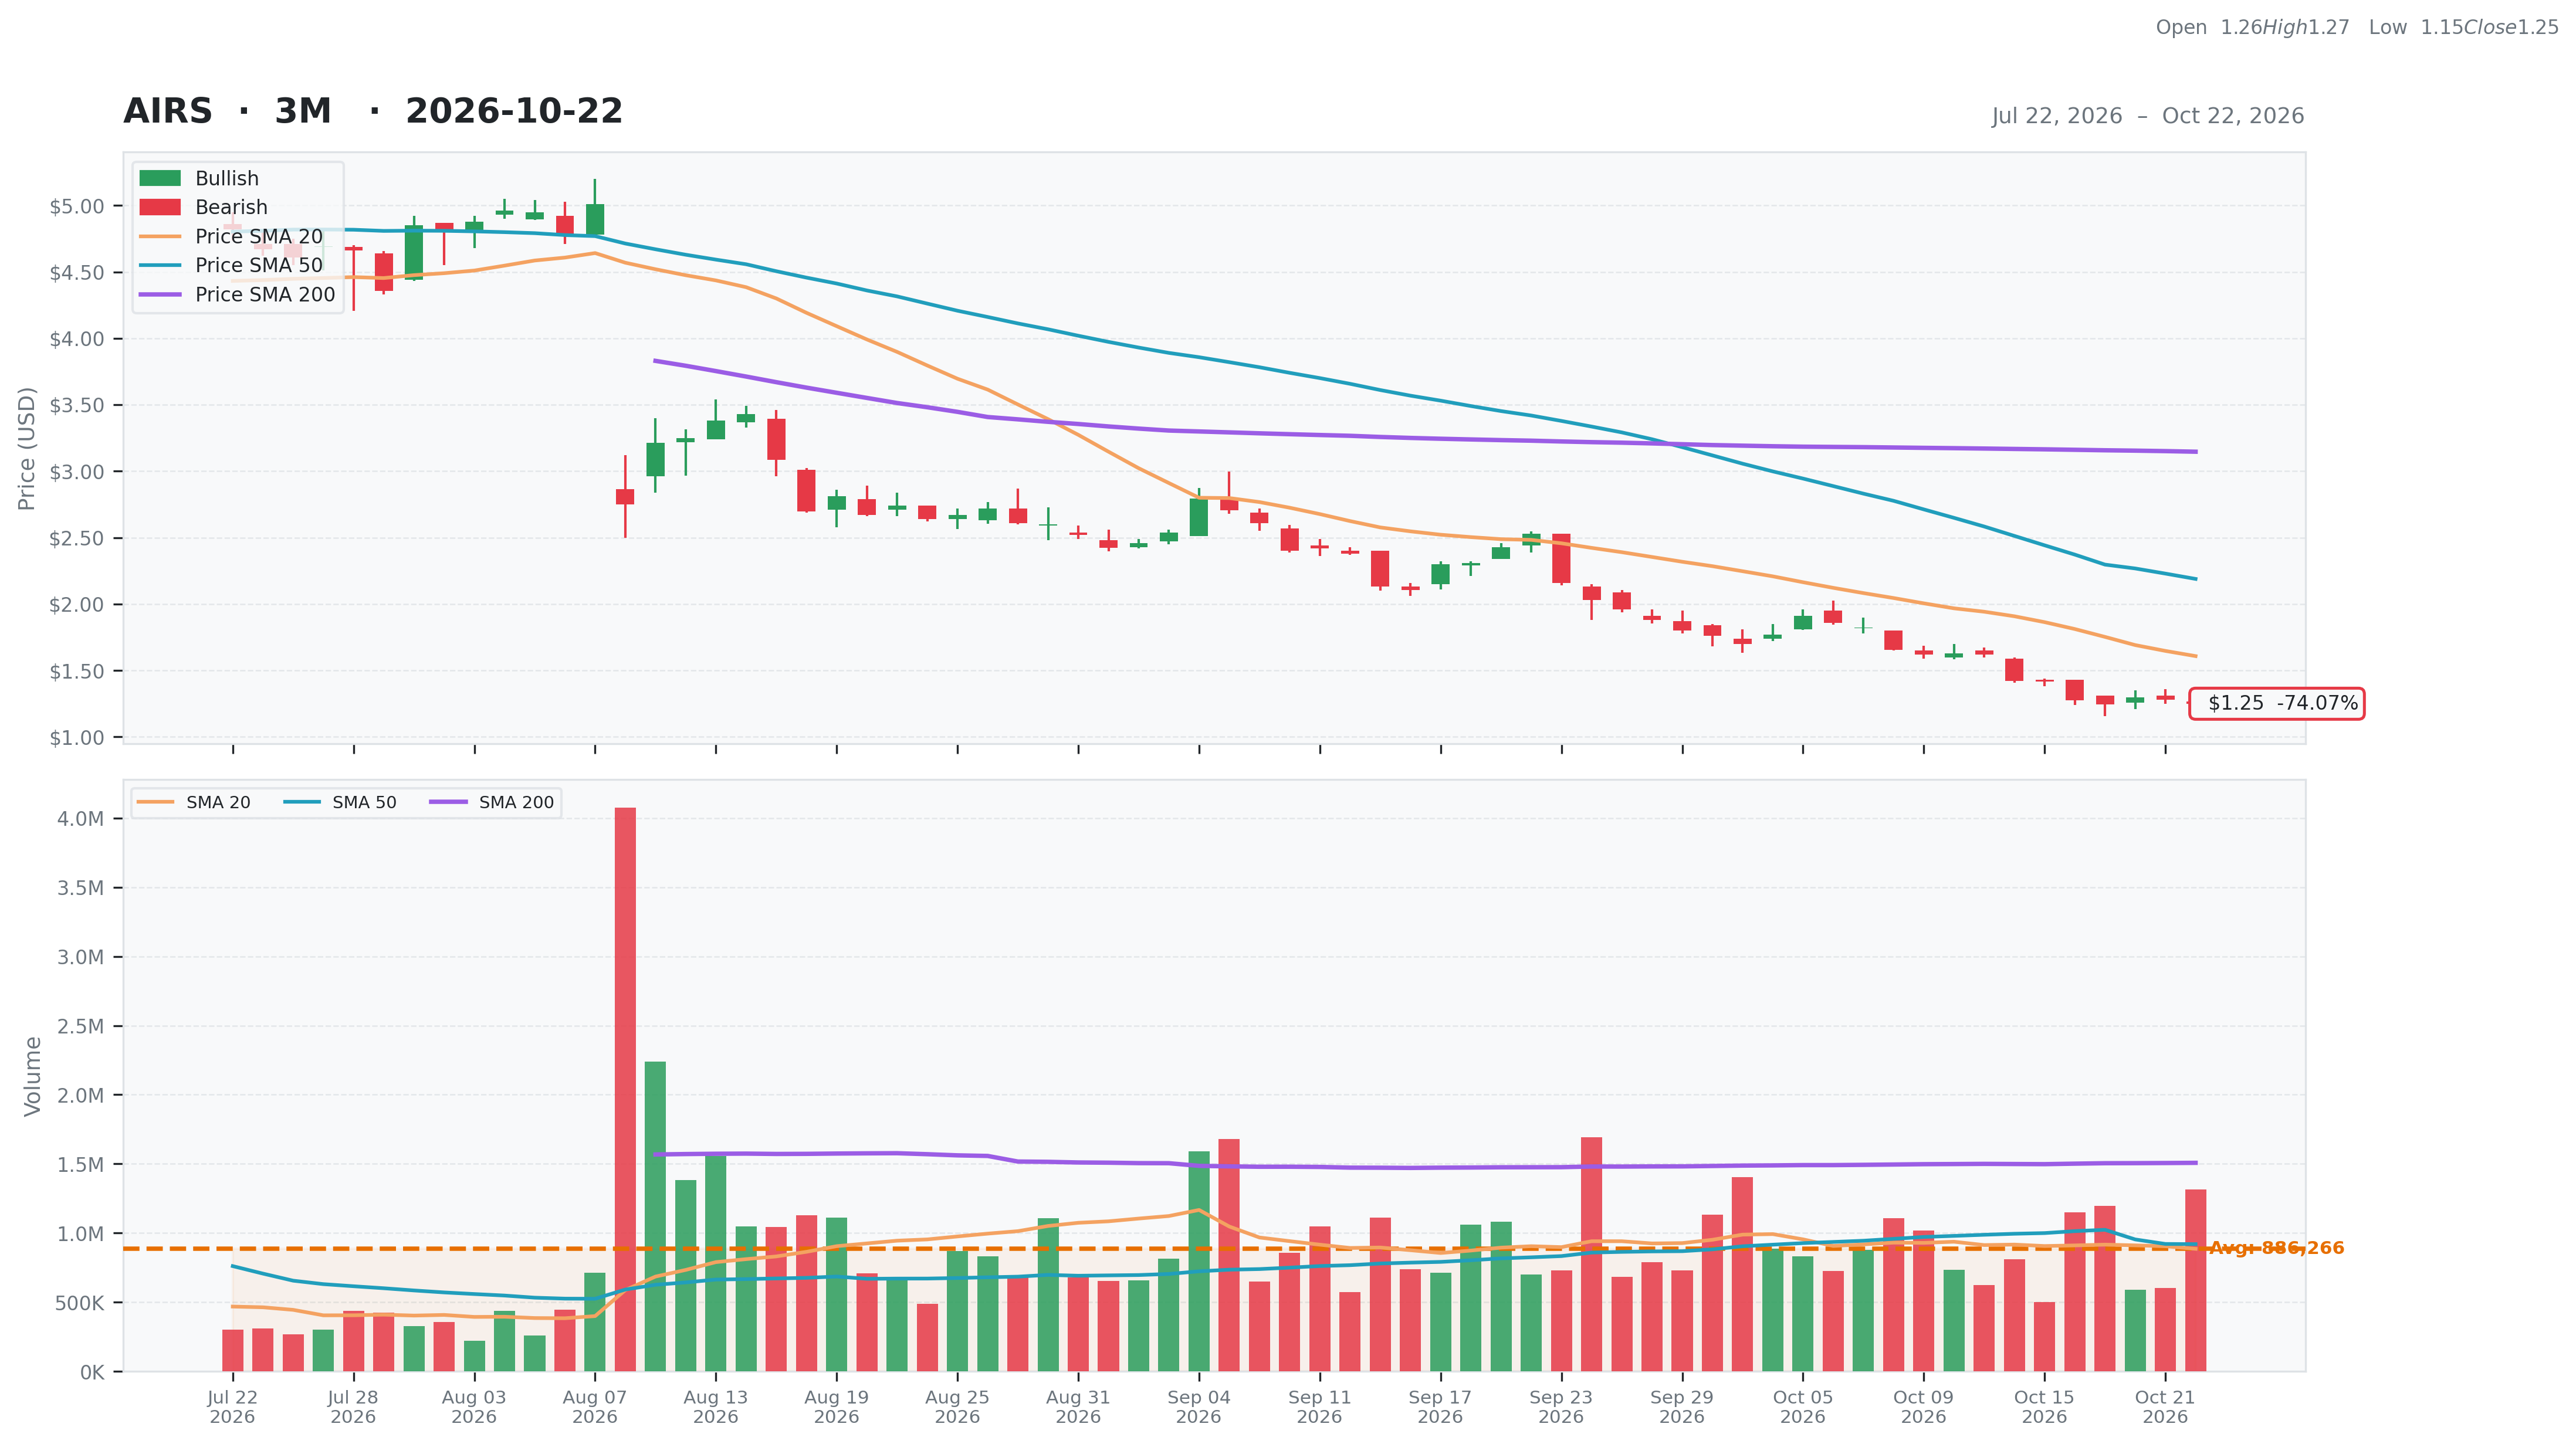
Healthcare • Medical Care Facilities • $1.25 • MCap: 91,921,392
https://www.airsculpt.com • AirSculpt Technologies, Inc., together with its subsidiaries, focuses on operating as a holding company for EBS Intermediate Parent LLC that provides body contouring procedure services in the United States and Canada. The company offers AirSculpt, a body contouring treatment that removes fat and tightens skin while sculpting targeted areas of the body in a minimally invasive procedure. It also provides AirSculpt+, a procedure that permanently removes fat and tightens the skin with unparalleled precision and finesse; and AirSculpt Smooth, an advanced cellulite removal tool. In addition, it provides fat removal procedures across treatment areas, such as the stomach, back, and buttocks; and fat transfer procedures that transfers the patient's own fat cells to enhance the buttocks, breasts, hips, aging hands, or other areas. Further, the company's body contouring procedures include the Power BBL, a Brazilian butt lift procedure; the Up a Cup, a breast enhancement procedure; and the Hip Flip, an hourglass contouring procedure. Additionally, it operates various centers. The company was founded in 2012 and is headquartered in Tampa, Florida.
Watch List
| Score | Price | 52 Week & Averages | Relative Strength | Risk | |||||
|---|---|---|---|---|---|---|---|---|---|
| Total | 37 | Current | $1.25 | 52W High | $11.65 -89.27% | Relative Strength | -0.68 | Beta | 2.33 |
| Business Quality | 10 | Weekly | $1.41 -11.66% | 52W Low | $1.25 0.40% | 3M | -0.73 | Short % | 0.07 |
| Financial Strength | 6 | Monthly | $2.53 -50.59% | Above 50DMA | $2.19 -42.91% | 6M | -0.50 | Risk Score | 9 |
| Growth Outlook | 1 | Quarterly | $4.61 -72.89% | Above 200DMA | $3.15 -60.28% | 9M | -0.57 | ||
| Momentum | 2 | Yearly | $11.65 -89.27% | 12M | -0.89 | ||||
| Valuation | Financial Strength | Growth/Profitability | |||
|---|---|---|---|---|---|
| Trailing P/E | N/A | Cash | 19M | Revenue Growth | -0.02% |
| Forward P/E | -127.50 | Debt | 70M | Earnings Growth | N/A |
| PEG Ratio | N/A | Debt/Equity | 67.22 | Qtr Earnings Growth | N/A |
| Price/Sales | 0.61 | Current Ratio | 0.79 | Gross Margin | 0.66% |
| Price/Book | 0.87 | Quick Ratio | 0.61 | Operating Margin | 0.00% |
| EV/Revenue | 0.95 | Operating CF | 1M | Profit Margin | -0.08% |
| EV/EBITDA | 22.84 | Free CF | 8M | EBITDA Margin | 0.04% |
| Ent Value | 144M | Return on Assets | -0.02% | ||
| Return on Equity | -0.12% | ||||
| Technical | Volume & Bollinger Bands | Analyst | |||
|---|---|---|---|---|---|
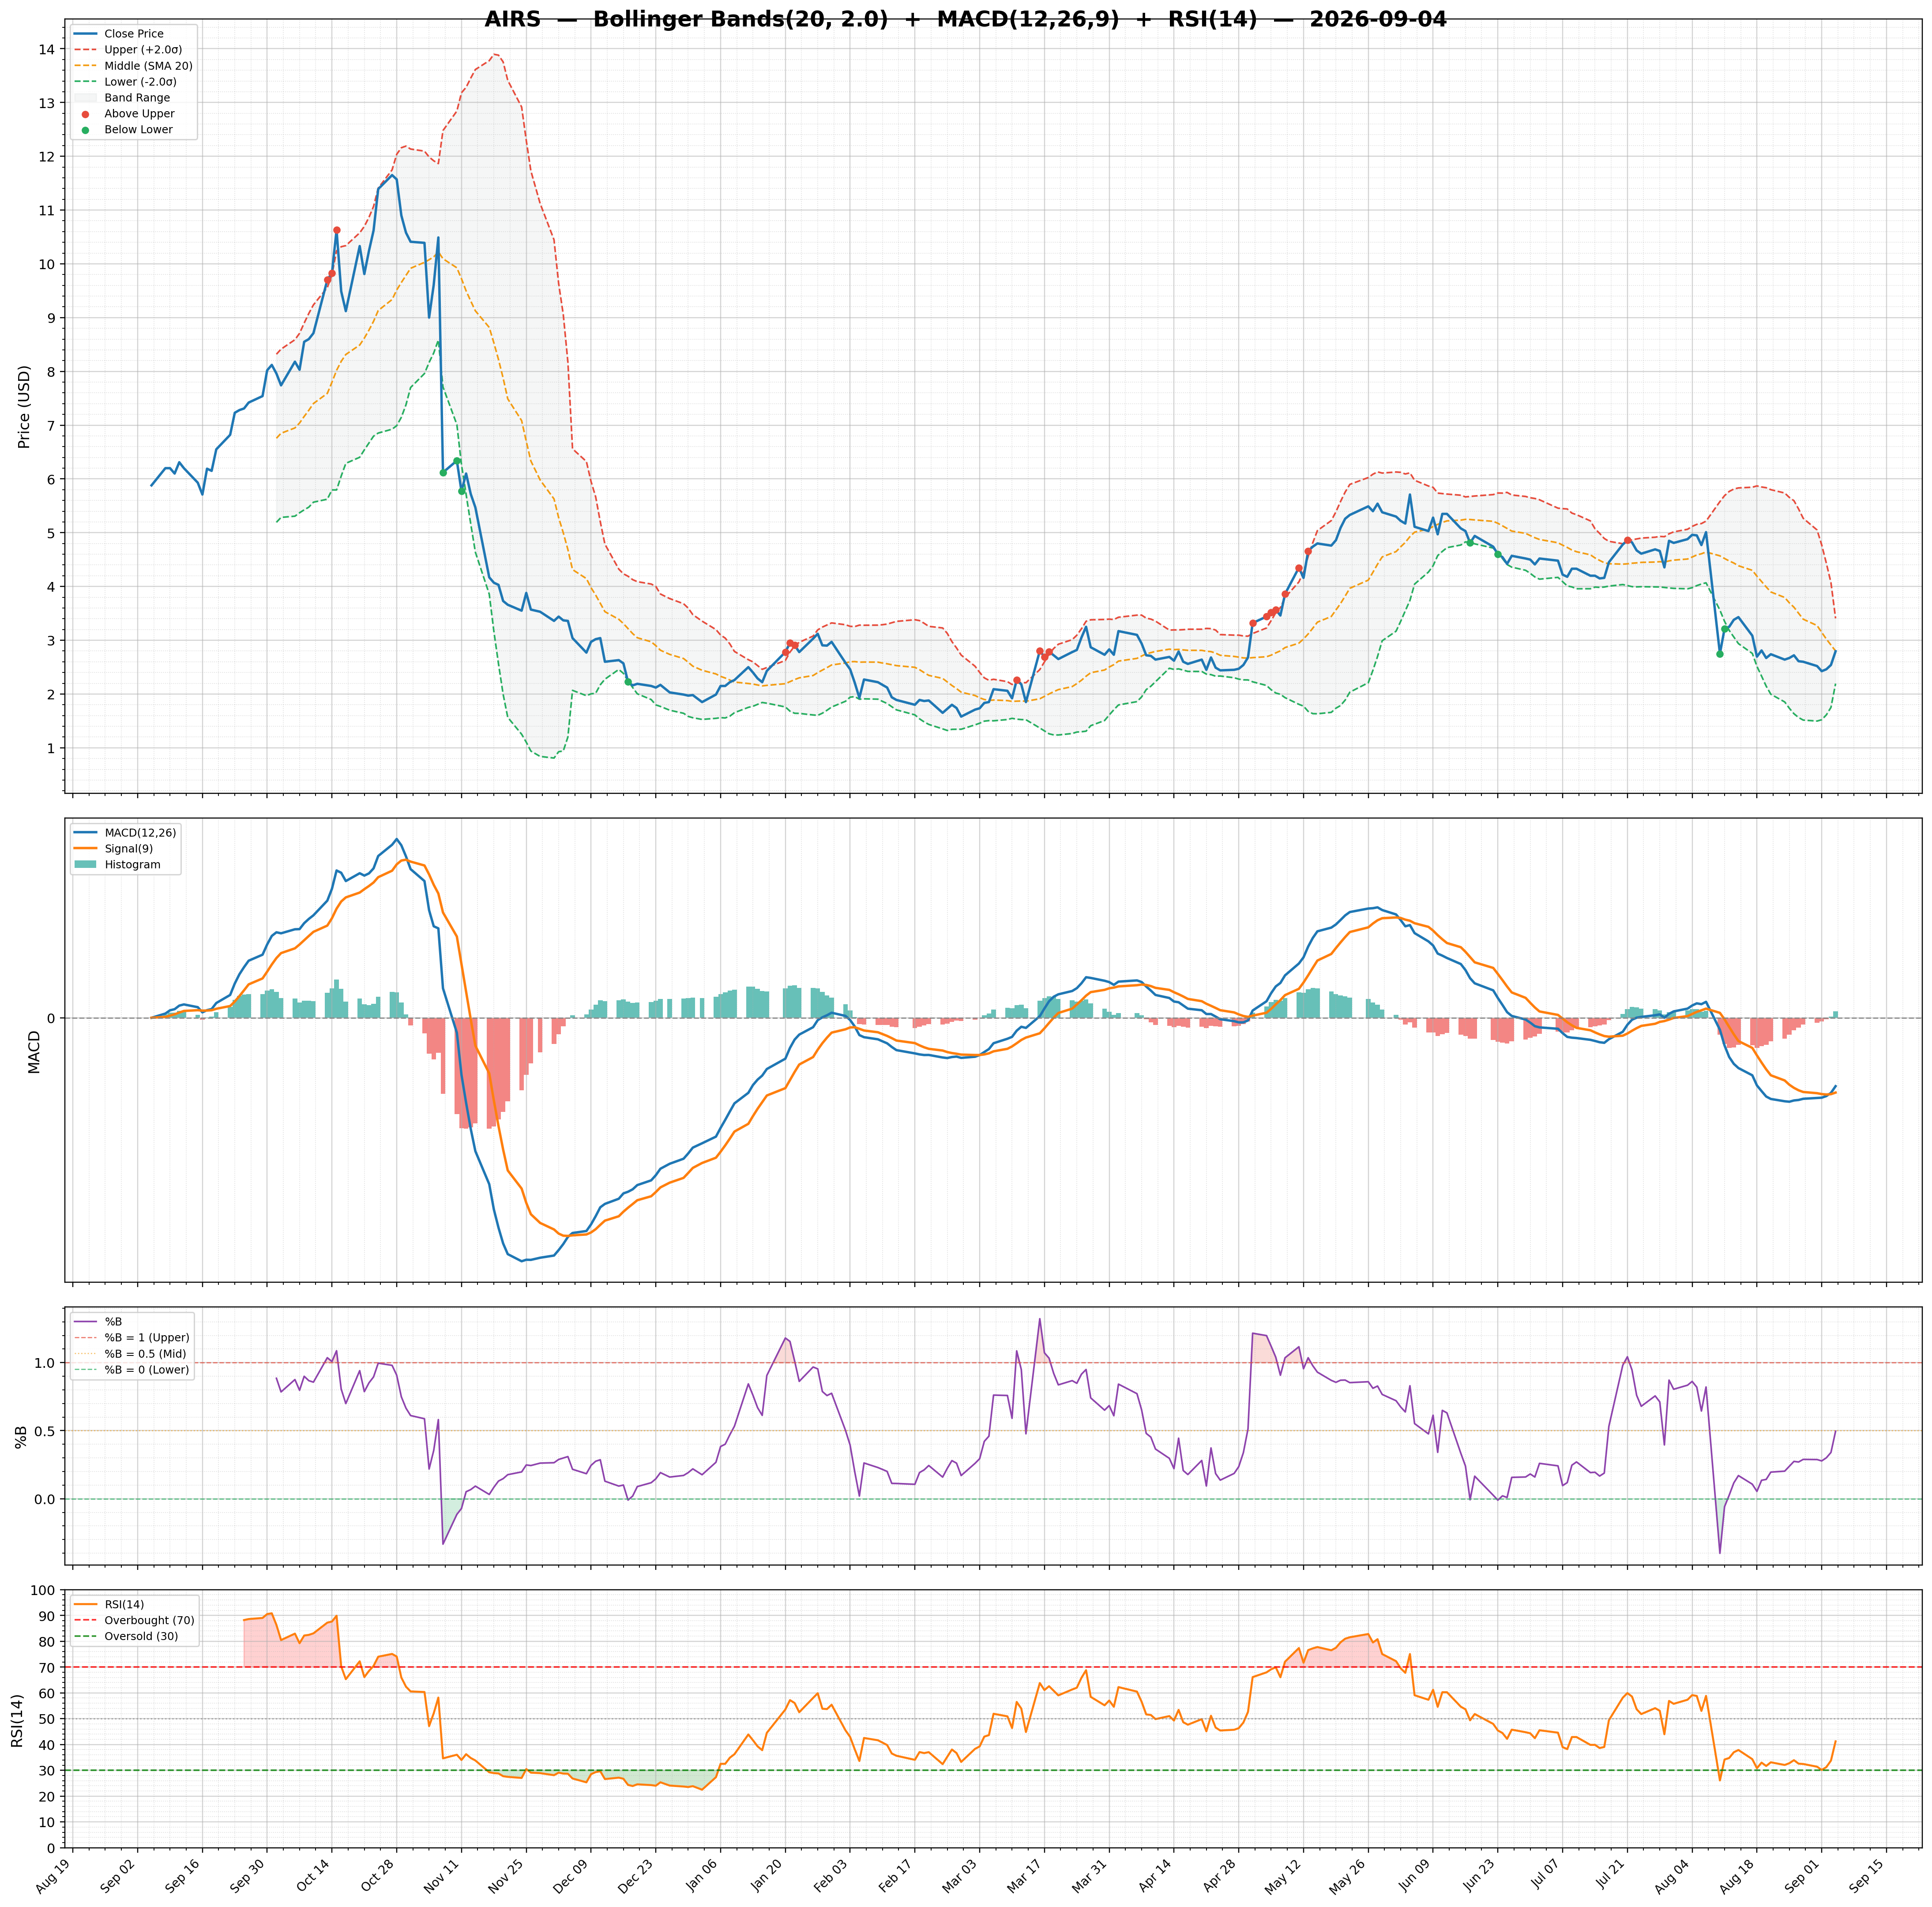
| RSI | 25.36 | Volume | 1.15M | Rating | none |
| Previous RSI | 26.05 | Avg Volume 20D | 0.89M | Target Mean | $4.50 |
| RSI Trend | Down | Relative Volume | 1.45 | Target High | $6.00 |
| MACD | -0.30 | Lower Band | 1.12 | Target Low | $3.00 |
| MACD Signal | -0.30 | Middle Band | 1.61 | Target Median | $4.50 |
| Histogram | 0.00 | Upper Band | 2.10 | Analysts | 2 |
| Previous Histogram | -0.00 | Bandwidth | 60.940 | Upside | 252.94% |
| Histogram Trend | Increasing | %B | 0.13 | ||