Amazon.com, Inc. (AMZN)
Consumer Cyclical • Internet Retail • $250.38 • MCap: 2,696,578,334,720
https://www.amazon.com • Amazon.com, Inc. engages in the retail sale of consumer products, advertising, and subscriptions service through online and physical stores in North America and internationally. The company operates through three segments: North America, International, and Amazon Web Services (AWS). It also manufactures and sells electronic devices, including Kindle, fire tablets, fire TVs, echo, ring, blink, and eero; and develops and produces media content. In addition, the company offers programs that enable sellers to sell their products in its stores; and programs that allow authors, independent publishers, musicians, filmmakers, Twitch streamers, skill and app developers, and others to publish and sell content. Further, it provides compute, storage, Artificial intelligence, database, analytics, machine learning, and other services, as well as advertising services through programs, such as sponsored ads, display, and video advertising. Additionally, the company offers Amazon Prime, a membership program. The company's products offered through its stores include merchandise and content purchased for resale and products offered by third-party sellers. It serves consumers, sellers, developers, enterprises, content creators, advertisers, and employees. The company was incorporated in 1994 and is headquartered in Seattle, Washington.
Joie
| Score | Price | 52 Week & Averages | Relative Strength | Risk | |||||
|---|---|---|---|---|---|---|---|---|---|
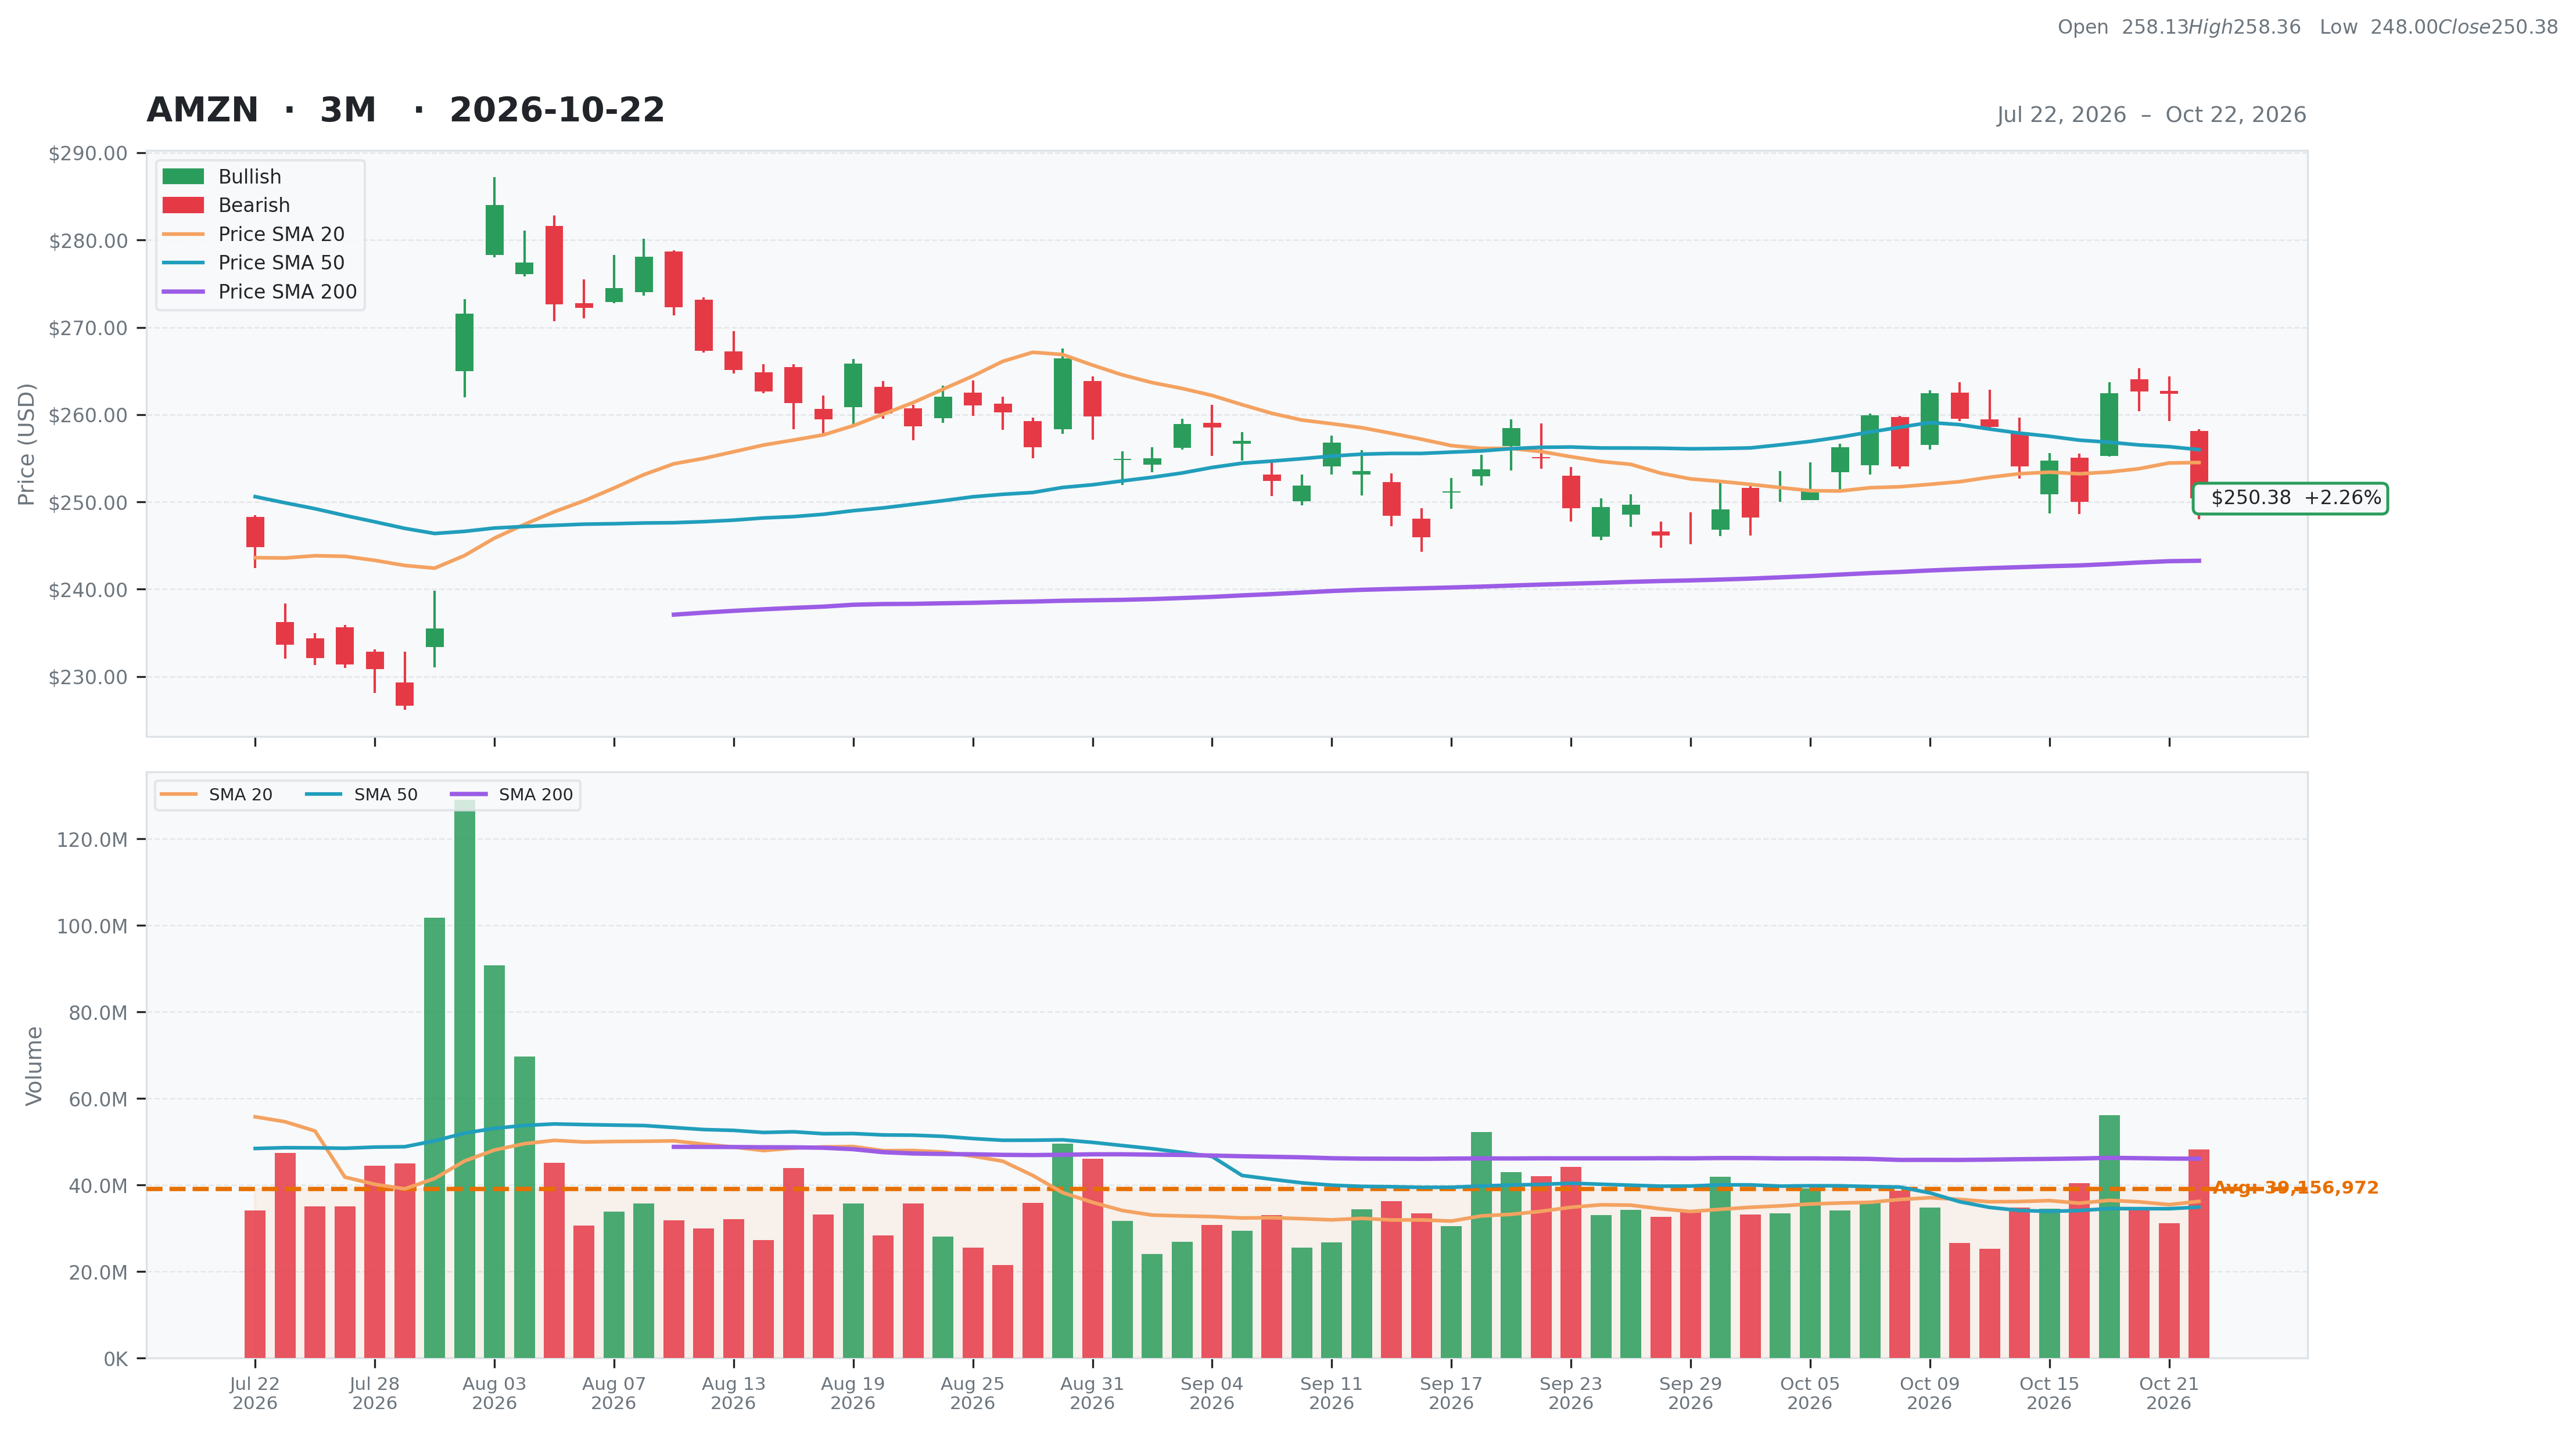
| Total | 71 | Current | $250.38 | 52W High | $284.02 -11.84% | Relative Strength | 0.06 | Beta | 1.46 |
| Business Quality | 20 | Weekly | $254.76 -1.72% | 52W Low | $198.79 25.95% | 3M | 0.08 | Short % | 0.01 |
| Financial Strength | 15 | Monthly | $254.98 -1.80% | Above 50DMA | $255.99 -2.19% | 6M | -0.02 | Risk Score | 9 |
| Growth Outlook | 11 | Quarterly | $232.11 7.87% | Above 200DMA | $243.26 2.93% | 9M | 0.07 | ||
| Momentum | 5 | Yearly | $226.97 10.31% | 12M | 0.12 | ||||
| Valuation | Financial Strength | Growth/Profitability | |||
|---|---|---|---|---|---|
| Trailing P/E | 20.11 | Cash | 122,988M | Revenue Growth | 0.20% |
| Forward P/E | 23.94 | Debt | 251,635M | Earnings Growth | 2.42% |
| PEG Ratio | 1.48 | Debt/Equity | 45.62 | Qtr Earnings Growth | 2.45% |
| Price/Sales | 3.48 | Current Ratio | 1.03 | Gross Margin | 0.51% |
| Price/Book | 4.89 | Quick Ratio | 0.84 | Operating Margin | 0.14% |
| EV/Revenue | 3.64 | Operating CF | 161,403M | Profit Margin | 0.17% |
| EV/EBITDA | 16.73 | Free CF | 3,219M | EBITDA Margin | 0.22% |
| Ent Value | 2,825,226M | Return on Assets | 0.07% | ||
| Return on Equity | 0.31% | ||||
| Technical | Volume & Bollinger Bands | Analyst | |||
|---|---|---|---|---|---|
| RSI | 45.11 | Volume | 39.04M | Rating | strong_buy |
| Previous RSI | 57.10 | Avg Volume 20D | 36.22M | Target Mean | $331.46 |
| RSI Trend | Down | Relative Volume | 1.32 | Target High | $405.00 |
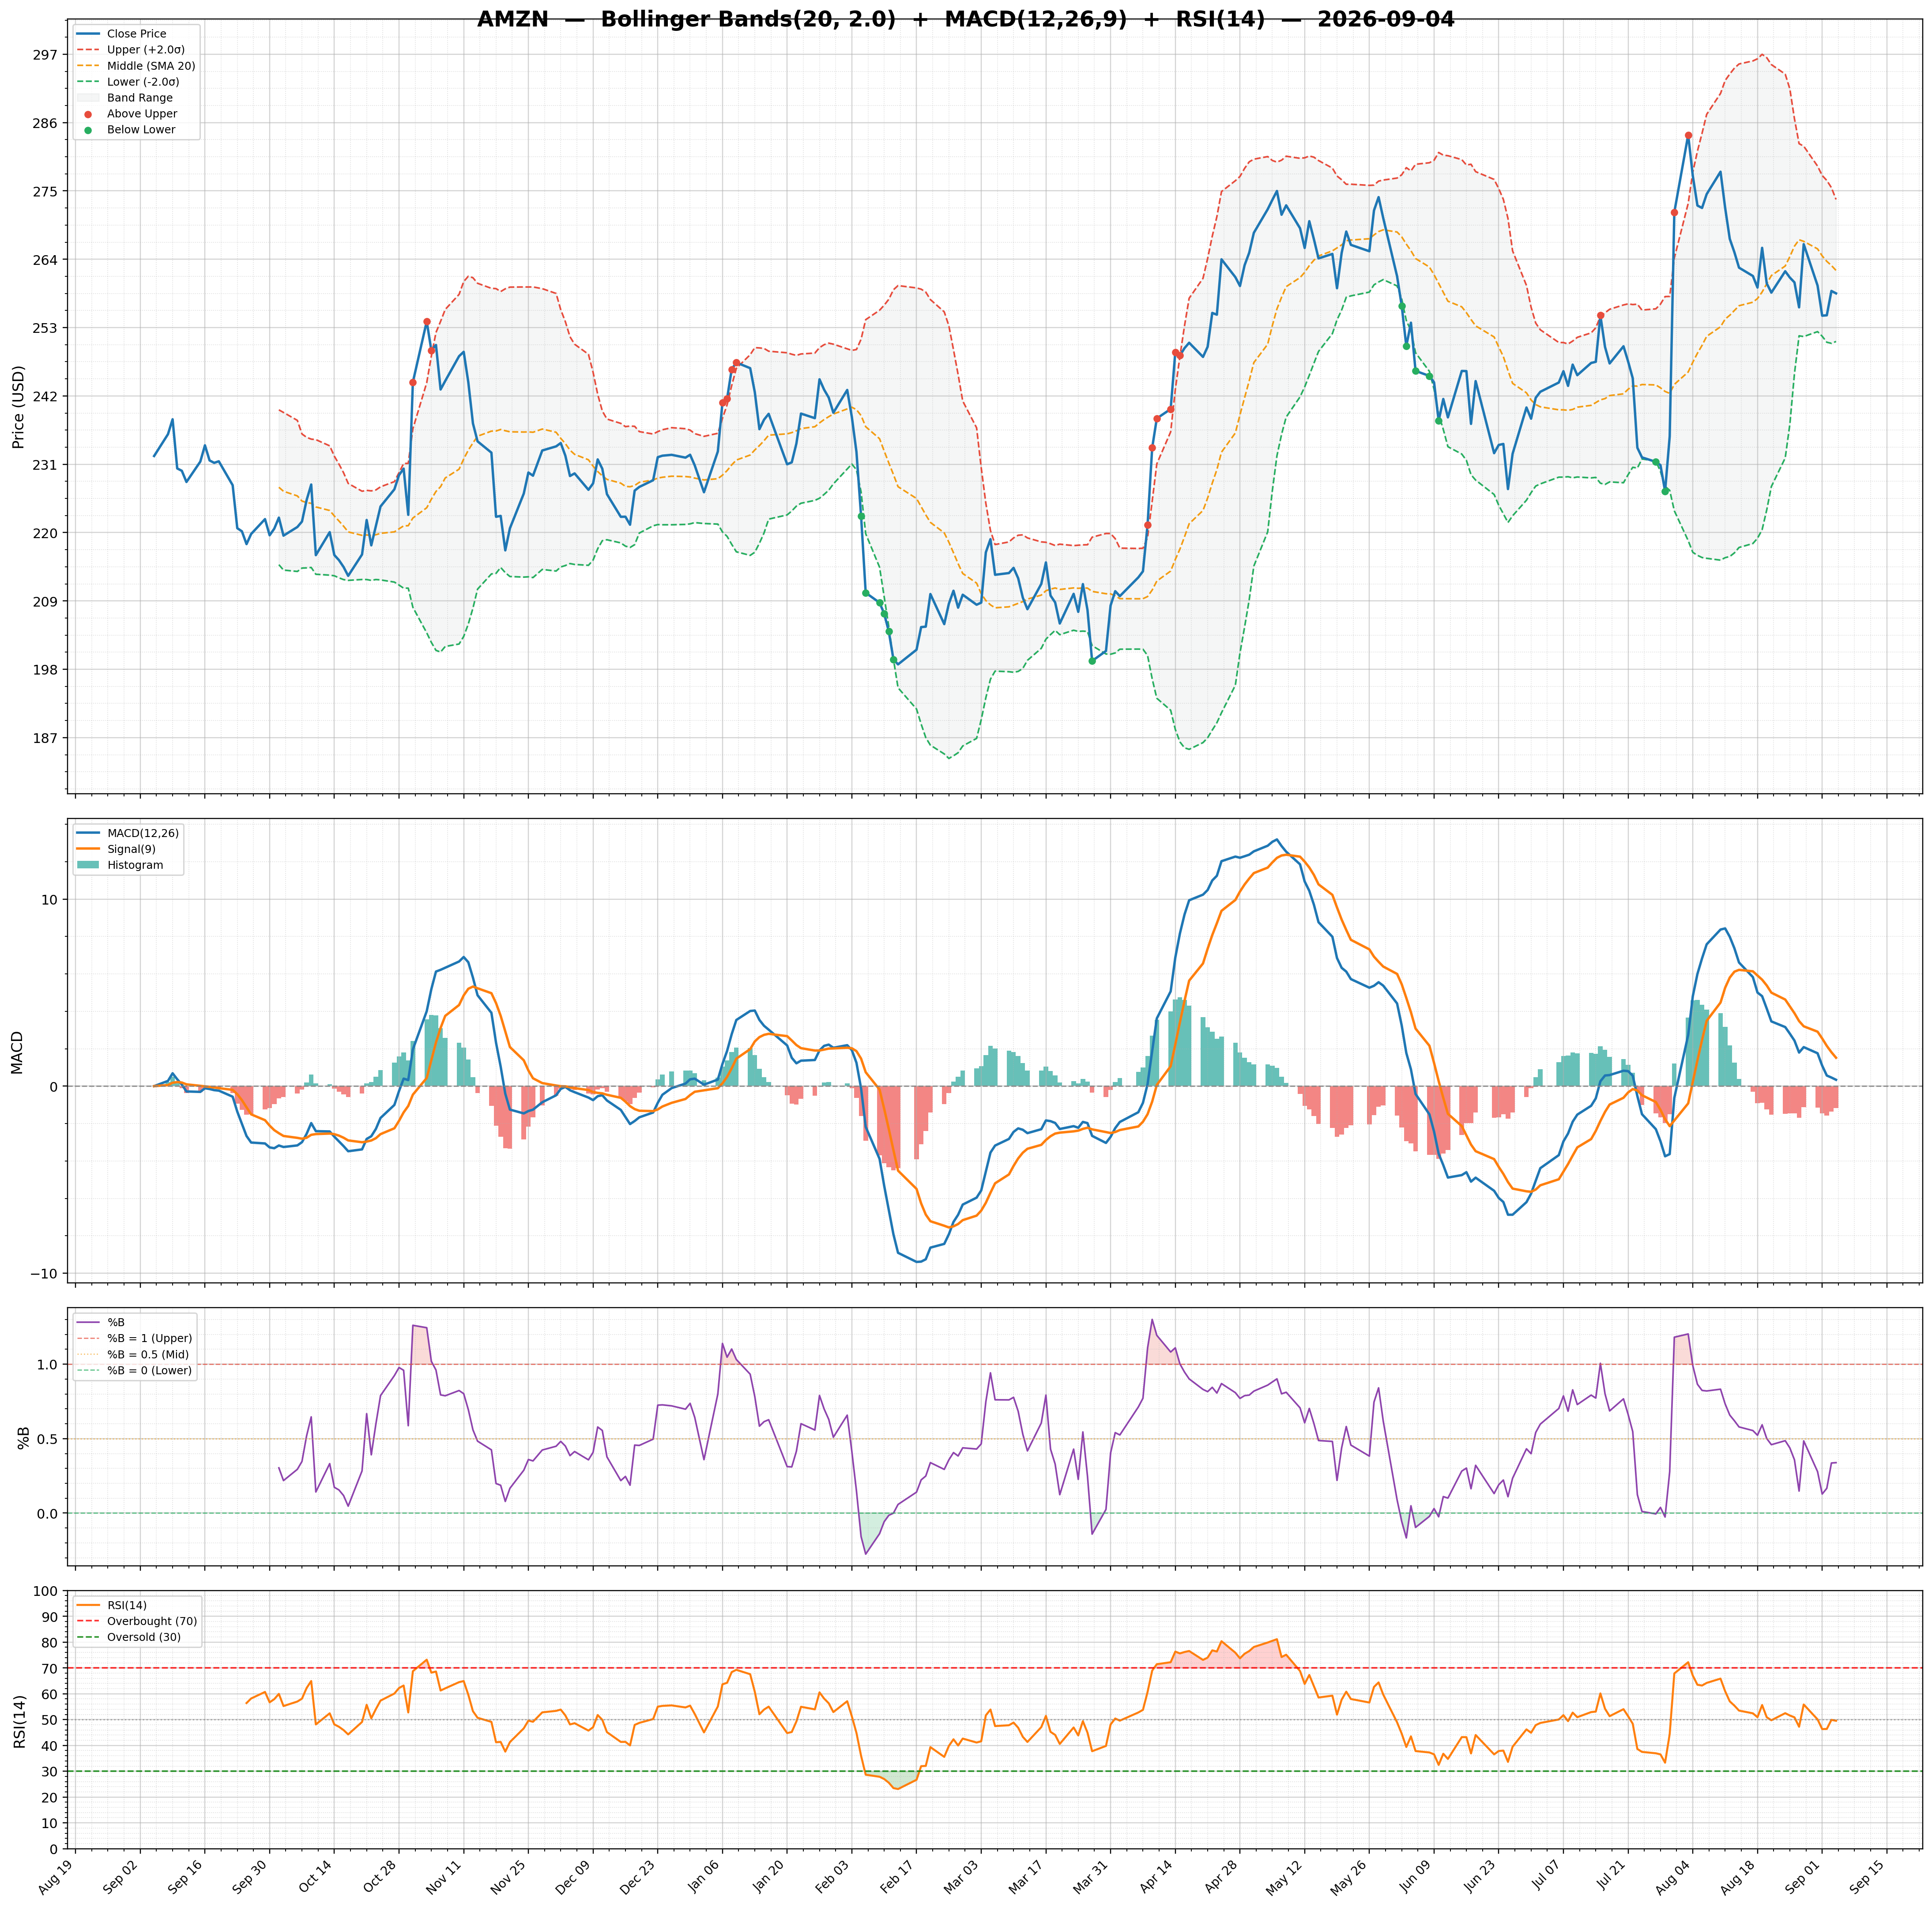
| MACD | 0.94 | Lower Band | 243.21 | Target Low | $230.00 |
| MACD Signal | 0.72 | Middle Band | 254.51 | Target Median | $329.50 |
| Histogram | 0.22 | Upper Band | 265.82 | Analysts | 58 |
| Previous Histogram | 0.98 | Bandwidth | 8.880 | Upside | 32.58% |
| Histogram Trend | Decreasing | %B | 0.32 | ||