Alpha and Omega Semiconductor L (AOSL)
Technology • Semiconductors • $22.3 • MCap: 659,135,296
https://www.aosmd.com • Alpha and Omega Semiconductor Limited designs, develops, and supplies power semiconductor products for computing, consumer electronics, communication, and industrial applications in Hong Kong, China, South Korea, the United States, and internationally. The company offers power discrete products, including industry standard trench metal-oxide-semiconductor field-effect transistors (MOSFETs), Shielded-Gate low- and mid-voltage MOSFETs, SuperJunction high-voltage MOSFETs, and trench-stop insulated gate bipolar transistors, as well as application-specific MOSFETs for smartphone battery management, dual MOSFETs for CPU power conversion, and high-power density MOSFETs for IBC power modules in AI data centers. It also provides power IC products, total power solutions for Intel panther lake and wildcat lake platforms, and the SmartClamp family of protected DrMOS for AI servers, data centers, and high-end graphics cards, as well as silicon carbide, IPM, HV gate drivers, and digital power products. Alpha and Omega Semiconductor Limited was incorporated in 2000 and is headquartered in Sunnyvale, California.
Ex-AAII
| Score | Price | 52 Week & Averages | Relative Strength | Risk | |||||
|---|---|---|---|---|---|---|---|---|---|
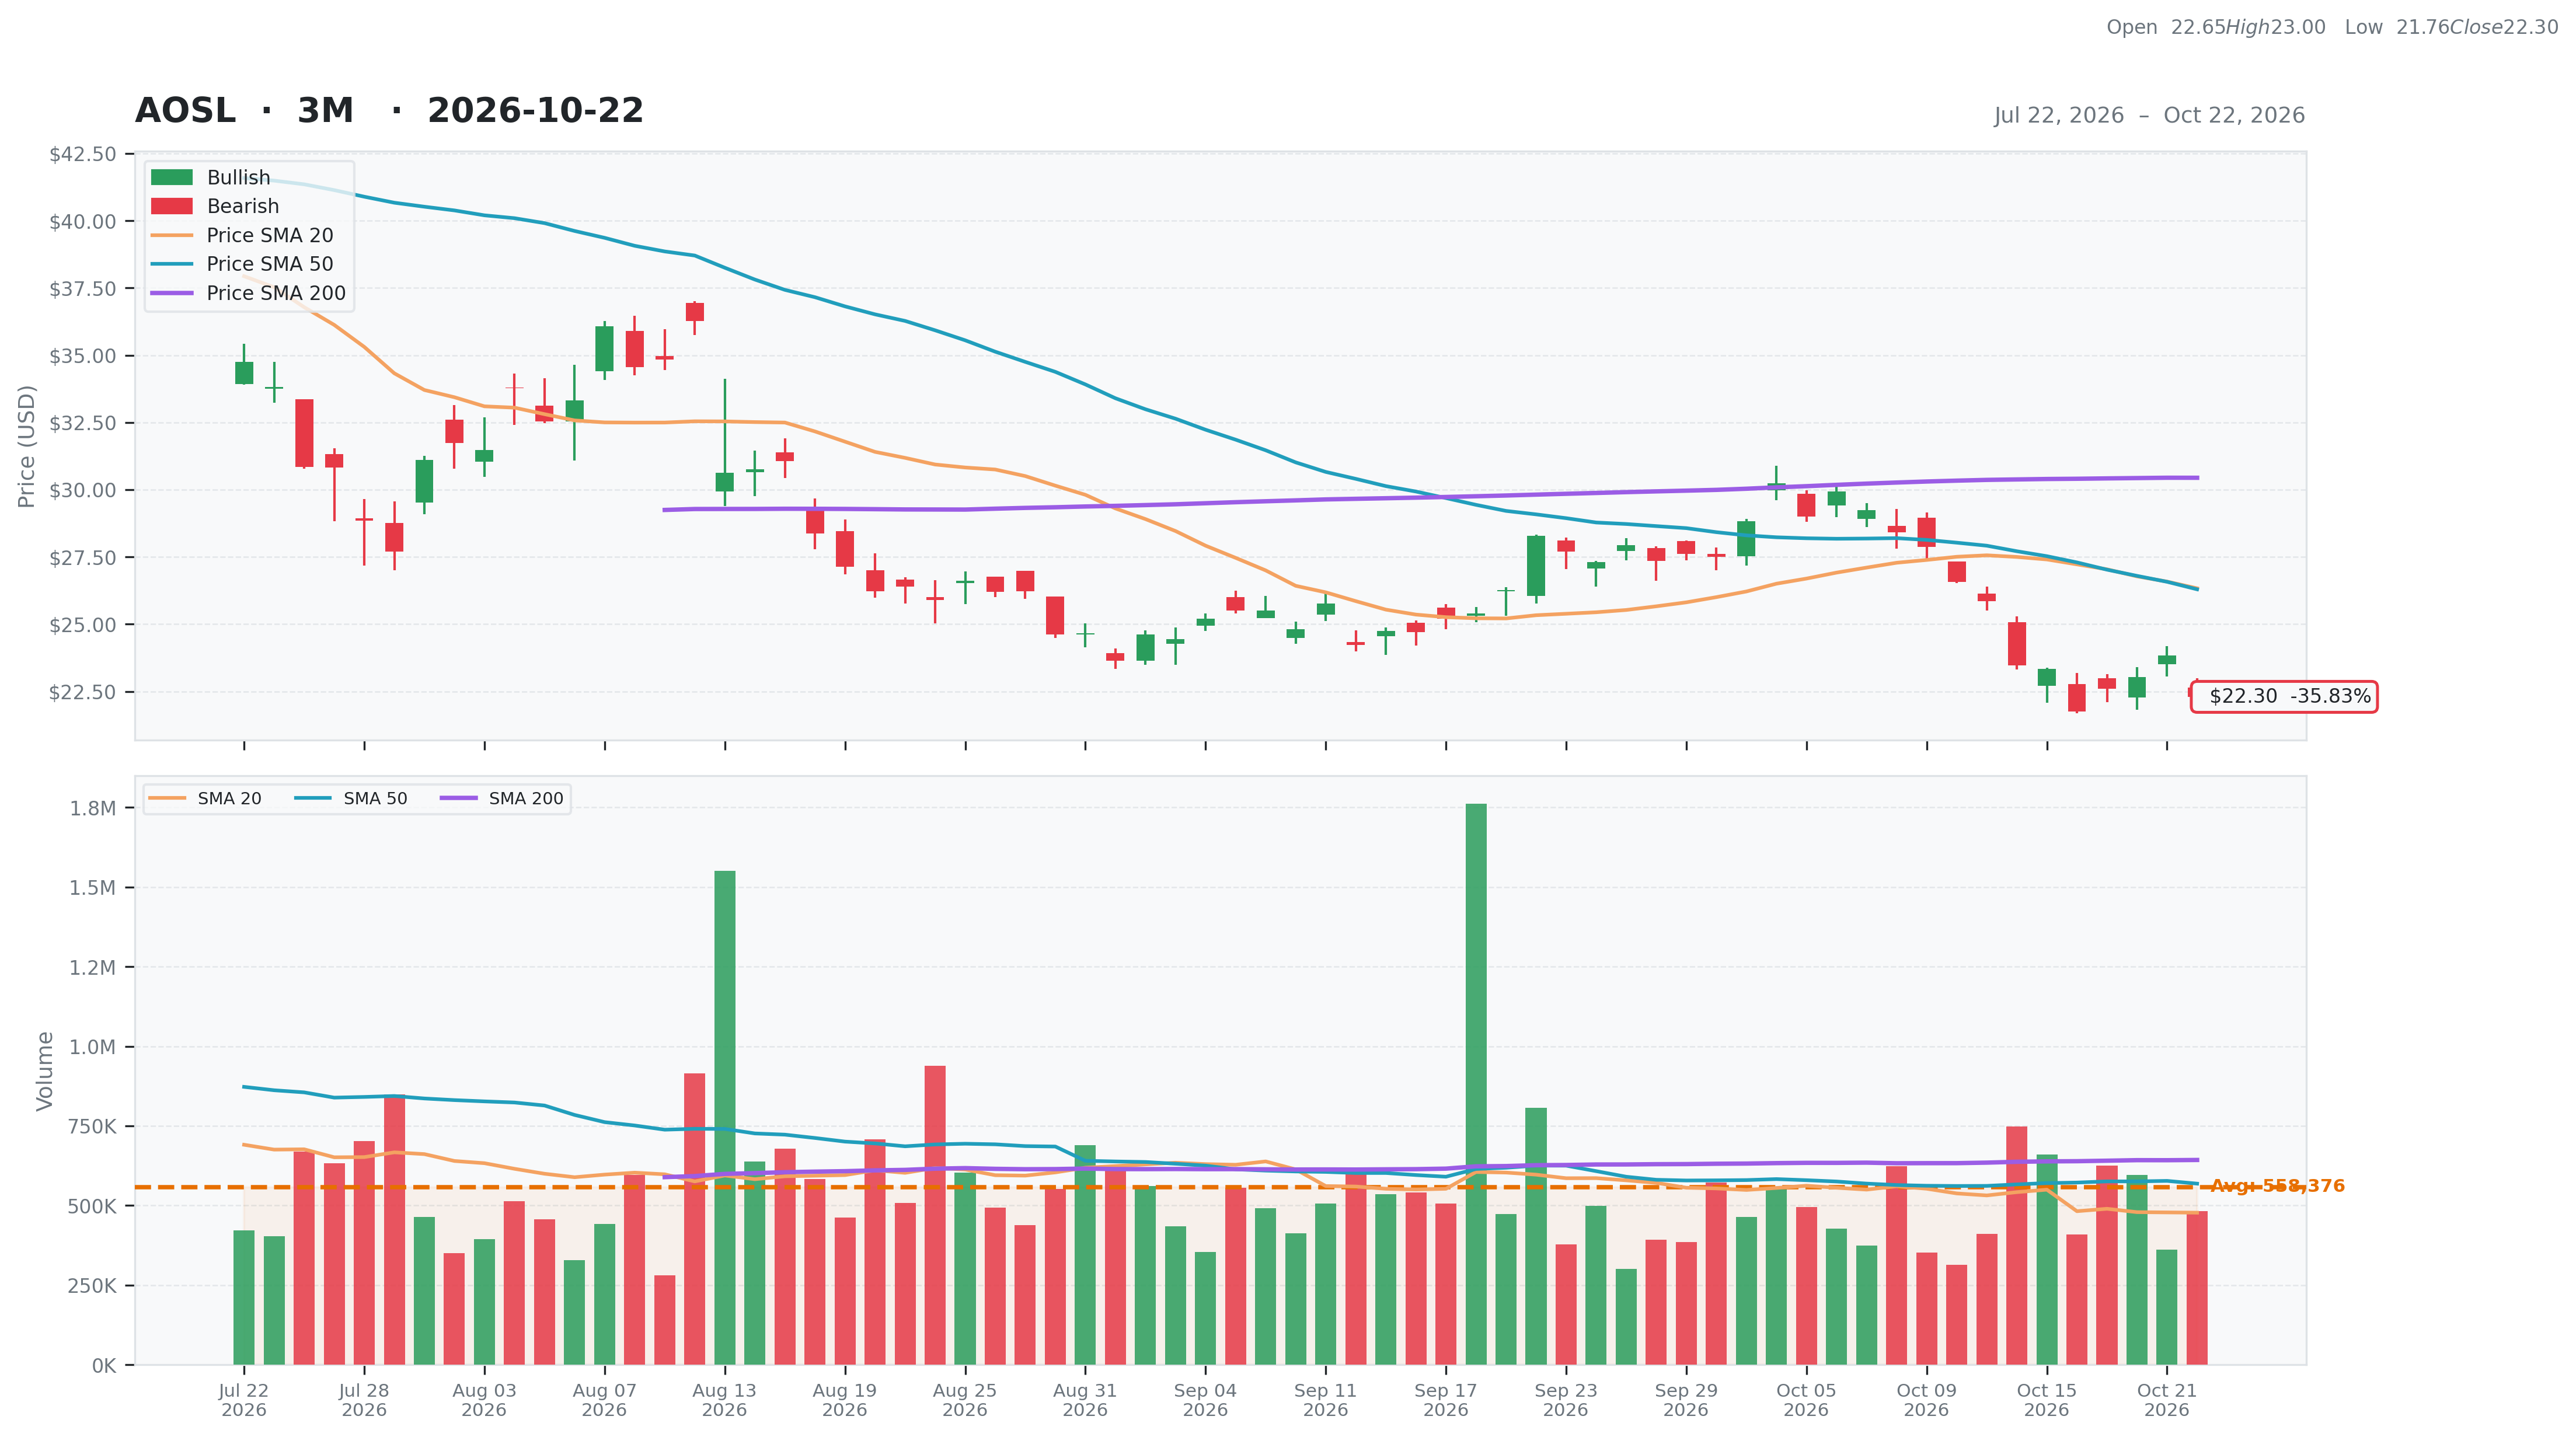
| Total | 31 | Current | $22.30 | 52W High | $53.32 -58.18% | Relative Strength | -0.26 | Beta | 2.64 |
| Business Quality | 4 | Weekly | $23.34 -4.46% | 52W Low | $17.47 27.65% | 3M | -0.28 | Short % | 0.12 |
| Financial Strength | 9 | Monthly | $28.28 -21.15% | Above 50DMA | $26.30 -15.20% | 6M | -0.44 | Risk Score | 5 |
| Growth Outlook | 1 | Quarterly | $30.85 -27.71% | Above 200DMA | $30.44 -26.75% | 9M | -0.04 | ||
| Momentum | 2 | Yearly | $30.55 -27.00% | 12M | -0.26 | ||||
| Valuation | Financial Strength | Growth/Profitability | |||
|---|---|---|---|---|---|
| Trailing P/E | N/A | Cash | 181M | Revenue Growth | -0.04% |
| Forward P/E | 69.05 | Debt | 28M | Earnings Growth | N/A |
| PEG Ratio | N/A | Debt/Equity | 3.51 | Qtr Earnings Growth | N/A |
| Price/Sales | 0.97 | Current Ratio | 3.44 | Gross Margin | 0.22% |
| Price/Book | 0.82 | Quick Ratio | 1.78 | Operating Margin | -0.06% |
| EV/Revenue | 0.74 | Operating CF | -16M | Profit Margin | -0.06% |
| EV/EBITDA | 35.84 | Free CF | -30M | EBITDA Margin | 0.02% |
| Ent Value | 505M | Return on Assets | -0.03% | ||
| Return on Equity | -0.05% | ||||
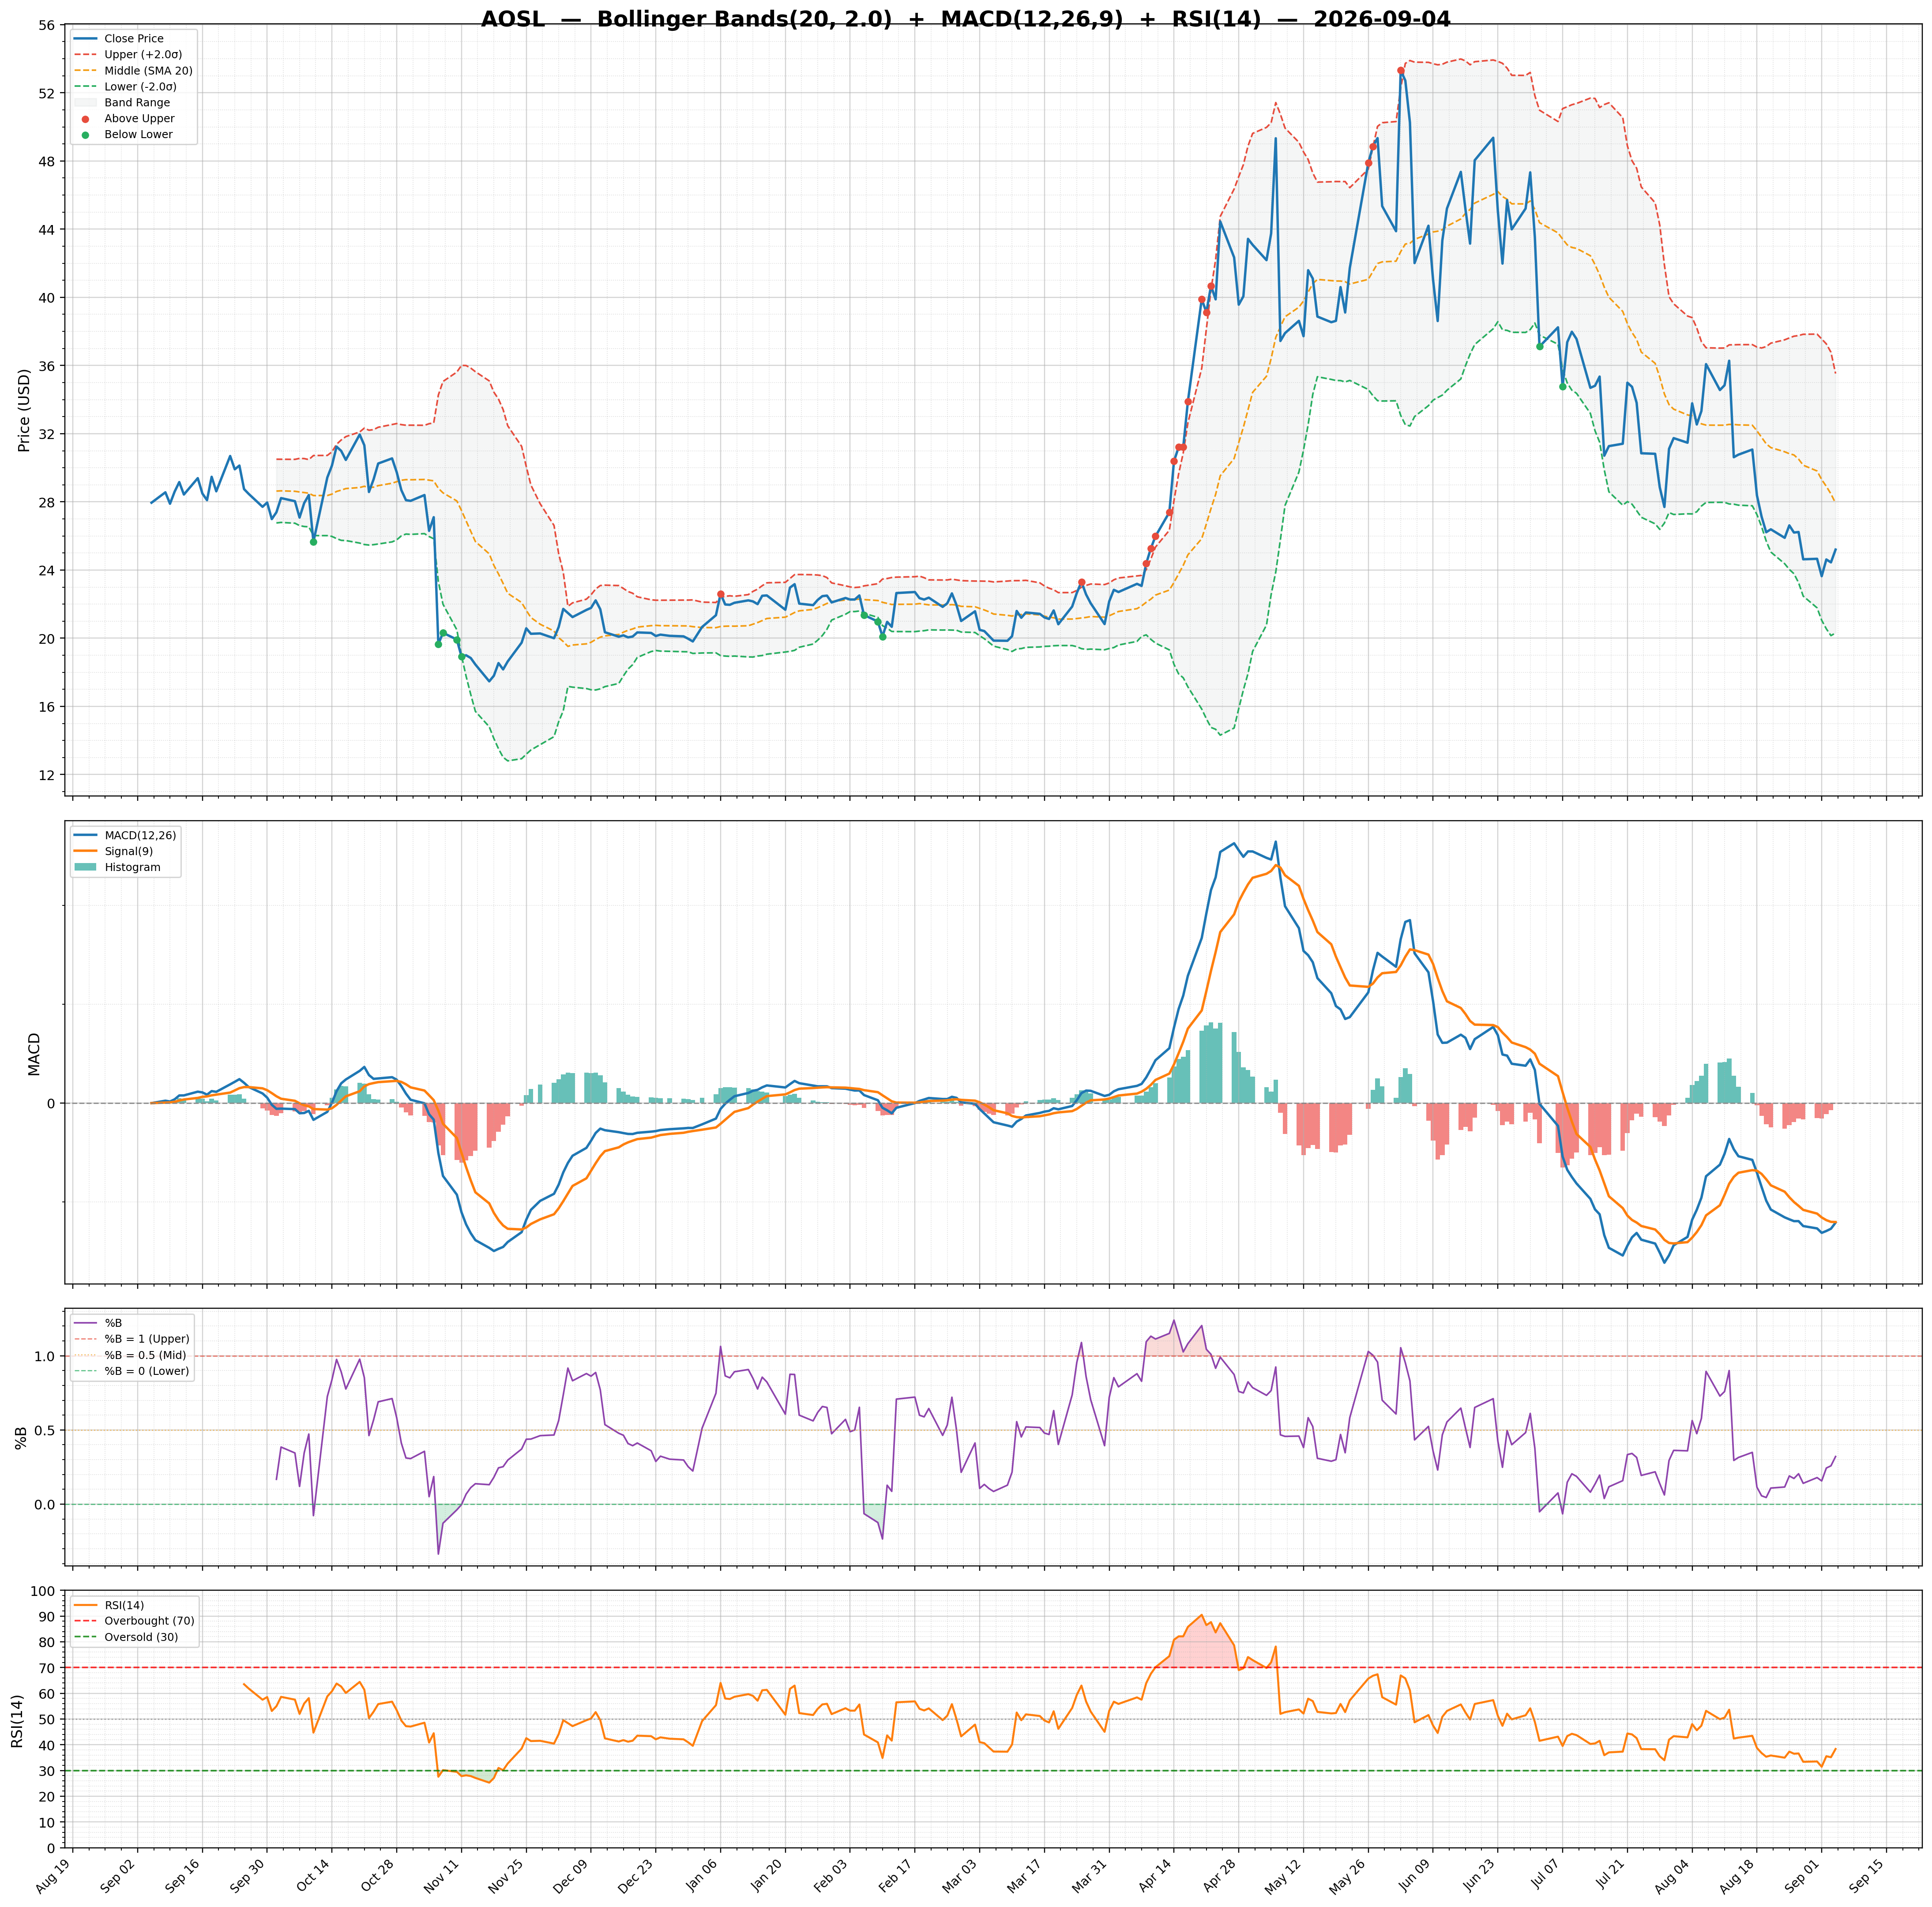
| Technical | Volume & Bollinger Bands | Analyst | |||
|---|---|---|---|---|---|
| RSI | 35.95 | Volume | 0.41M | Rating | buy |
| Previous RSI | 40.69 | Avg Volume 20D | 0.48M | Target Mean | $42.75 |
| RSI Trend | Down | Relative Volume | 0.90 | Target High | $58.00 |
| MACD | -1.28 | Lower Band | 20.73 | Target Low | $34.00 |
| MACD Signal | -0.79 | Middle Band | 26.34 | Target Median | $39.50 |
| Histogram | -0.49 | Upper Band | 31.94 | Analysts | 4 |
| Previous Histogram | -0.51 | Bandwidth | 42.570 | Upside | 96.55% |
| Histogram Trend | Increasing | %B | 0.14 | ||