Ampco-Pittsburgh Corporation (AP)
Industrials • Metal Fabrication • $7.81 • MCap: 170,640,208
https://ampcopgh.com • Ampco-Pittsburgh Corporation, together with its subsidiaries, engages in manufacture and sale of specialty metal products and customized equipment to commercial and industrial users worldwide. The company operates through two segments: Forged and Cast Engineered Products (FCEP); and Air and Liquid Processing (ALP). The FCEP segment produces forged hardened steel rolls, cast rolls, and forged engineered products that are used in hot and cold rolling mills by producers of steel, aluminum, and other metals; cast rolls for hot strip mills, medium/heavy section mills, roughing mills, and plate mills; and forged engineered products for narrow and wide strip and aluminum mills, back-up rolls for narrow strip mills, and leveling rolls and shafts for steel distribution market, oil and gas industry, and the aluminum and plastic extrusion industries. The ALP Aerofin segment produces custom-engineered finned tube heat exchange coils and related heat transfer products for various industries, including original equipment manufacturers and commercial, nuclear power generation, and industrial manufacturing; custom-designed air handling systems for institutional, pharmaceutical, and general industrial building markets; and manufactures centrifugal pumps for the fossil fueled power generation, marine defense, and industrial refrigeration industries. Ampco-Pittsburgh Corporation was incorporated in 1929 and is headquartered in Carnegie, Pennsylvania.
Ex-AAII
| Score | Price | 52 Week & Averages | Relative Strength | Risk | |||||
|---|---|---|---|---|---|---|---|---|---|
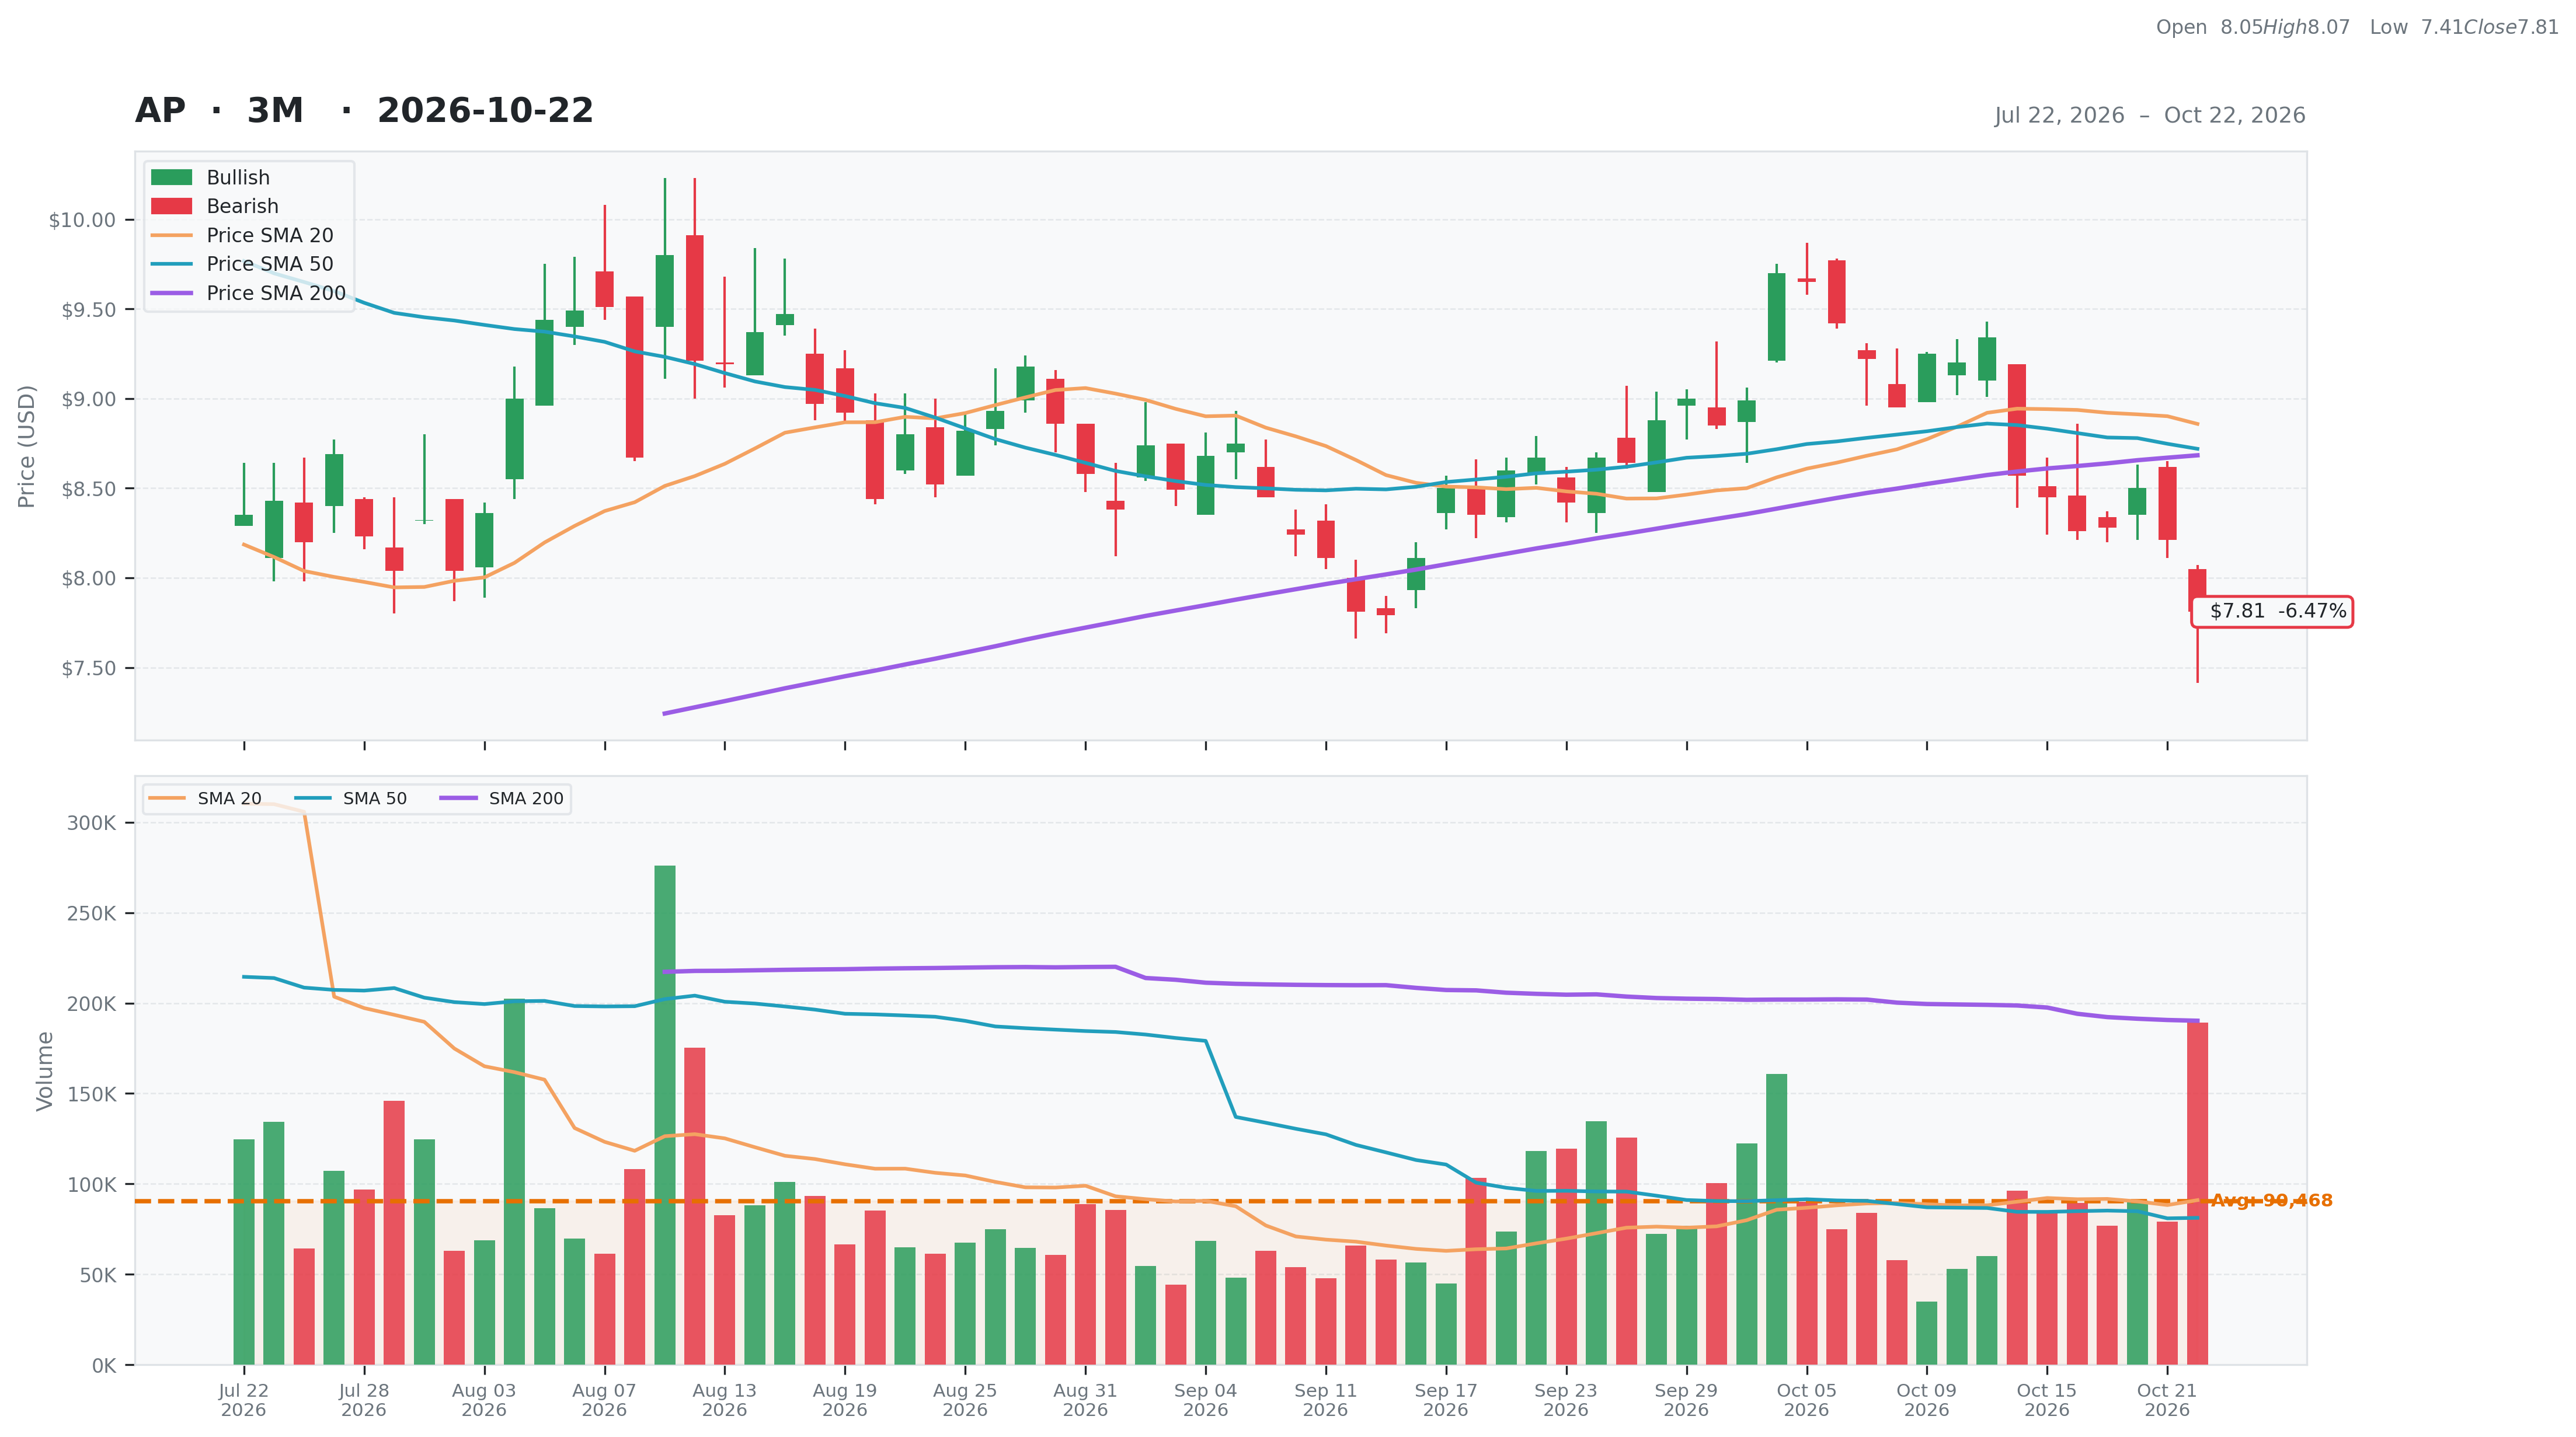
| Total | 29 | Current | $7.81 | 52W High | $12.20 -35.98% | Relative Strength | 0.48 | Beta | 1.37 |
| Business Quality | 3 | Weekly | $8.45 -7.57% | 52W Low | $1.85 322.16% | 3M | -0.05 | Short % | 0.07 |
| Financial Strength | 6 | Monthly | $8.67 -9.92% | Above 50DMA | $8.72 -10.43% | 6M | -0.24 | Risk Score | 4 |
| Growth Outlook | 1 | Quarterly | $8.20 -4.76% | Above 200DMA | $8.68 -10.06% | 9M | 0.30 | ||
| Momentum | 1 | Yearly | $2.28 242.54% | 12M | 2.44 | ||||
| Valuation | Financial Strength | Growth/Profitability | |||
|---|---|---|---|---|---|
| Trailing P/E | N/A | Cash | 7M | Revenue Growth | -0.09% |
| Forward P/E | N/A | Debt | 142M | Earnings Growth | N/A |
| PEG Ratio | N/A | Debt/Equity | 294.17 | Qtr Earnings Growth | N/A |
| Price/Sales | 0.40 | Current Ratio | 1.78 | Gross Margin | 0.19% |
| Price/Book | 5.47 | Quick Ratio | 0.86 | Operating Margin | 0.06% |
| EV/Revenue | 0.75 | Operating CF | 11M | Profit Margin | -0.14% |
| EV/EBITDA | 10.11 | Free CF | 7M | EBITDA Margin | 0.07% |
| Ent Value | 323M | Return on Assets | 0.02% | ||
| Return on Equity | -0.91% | ||||
| Technical | Volume & Bollinger Bands | Analyst | |||
|---|---|---|---|---|---|
| RSI | 36.43 | Volume | 0.09M | Rating | none |
| Previous RSI | 41.26 | Avg Volume 20D | 0.09M | Target Mean | N/A |
| RSI Trend | Down | Relative Volume | 2.15 | Target High | N/A |
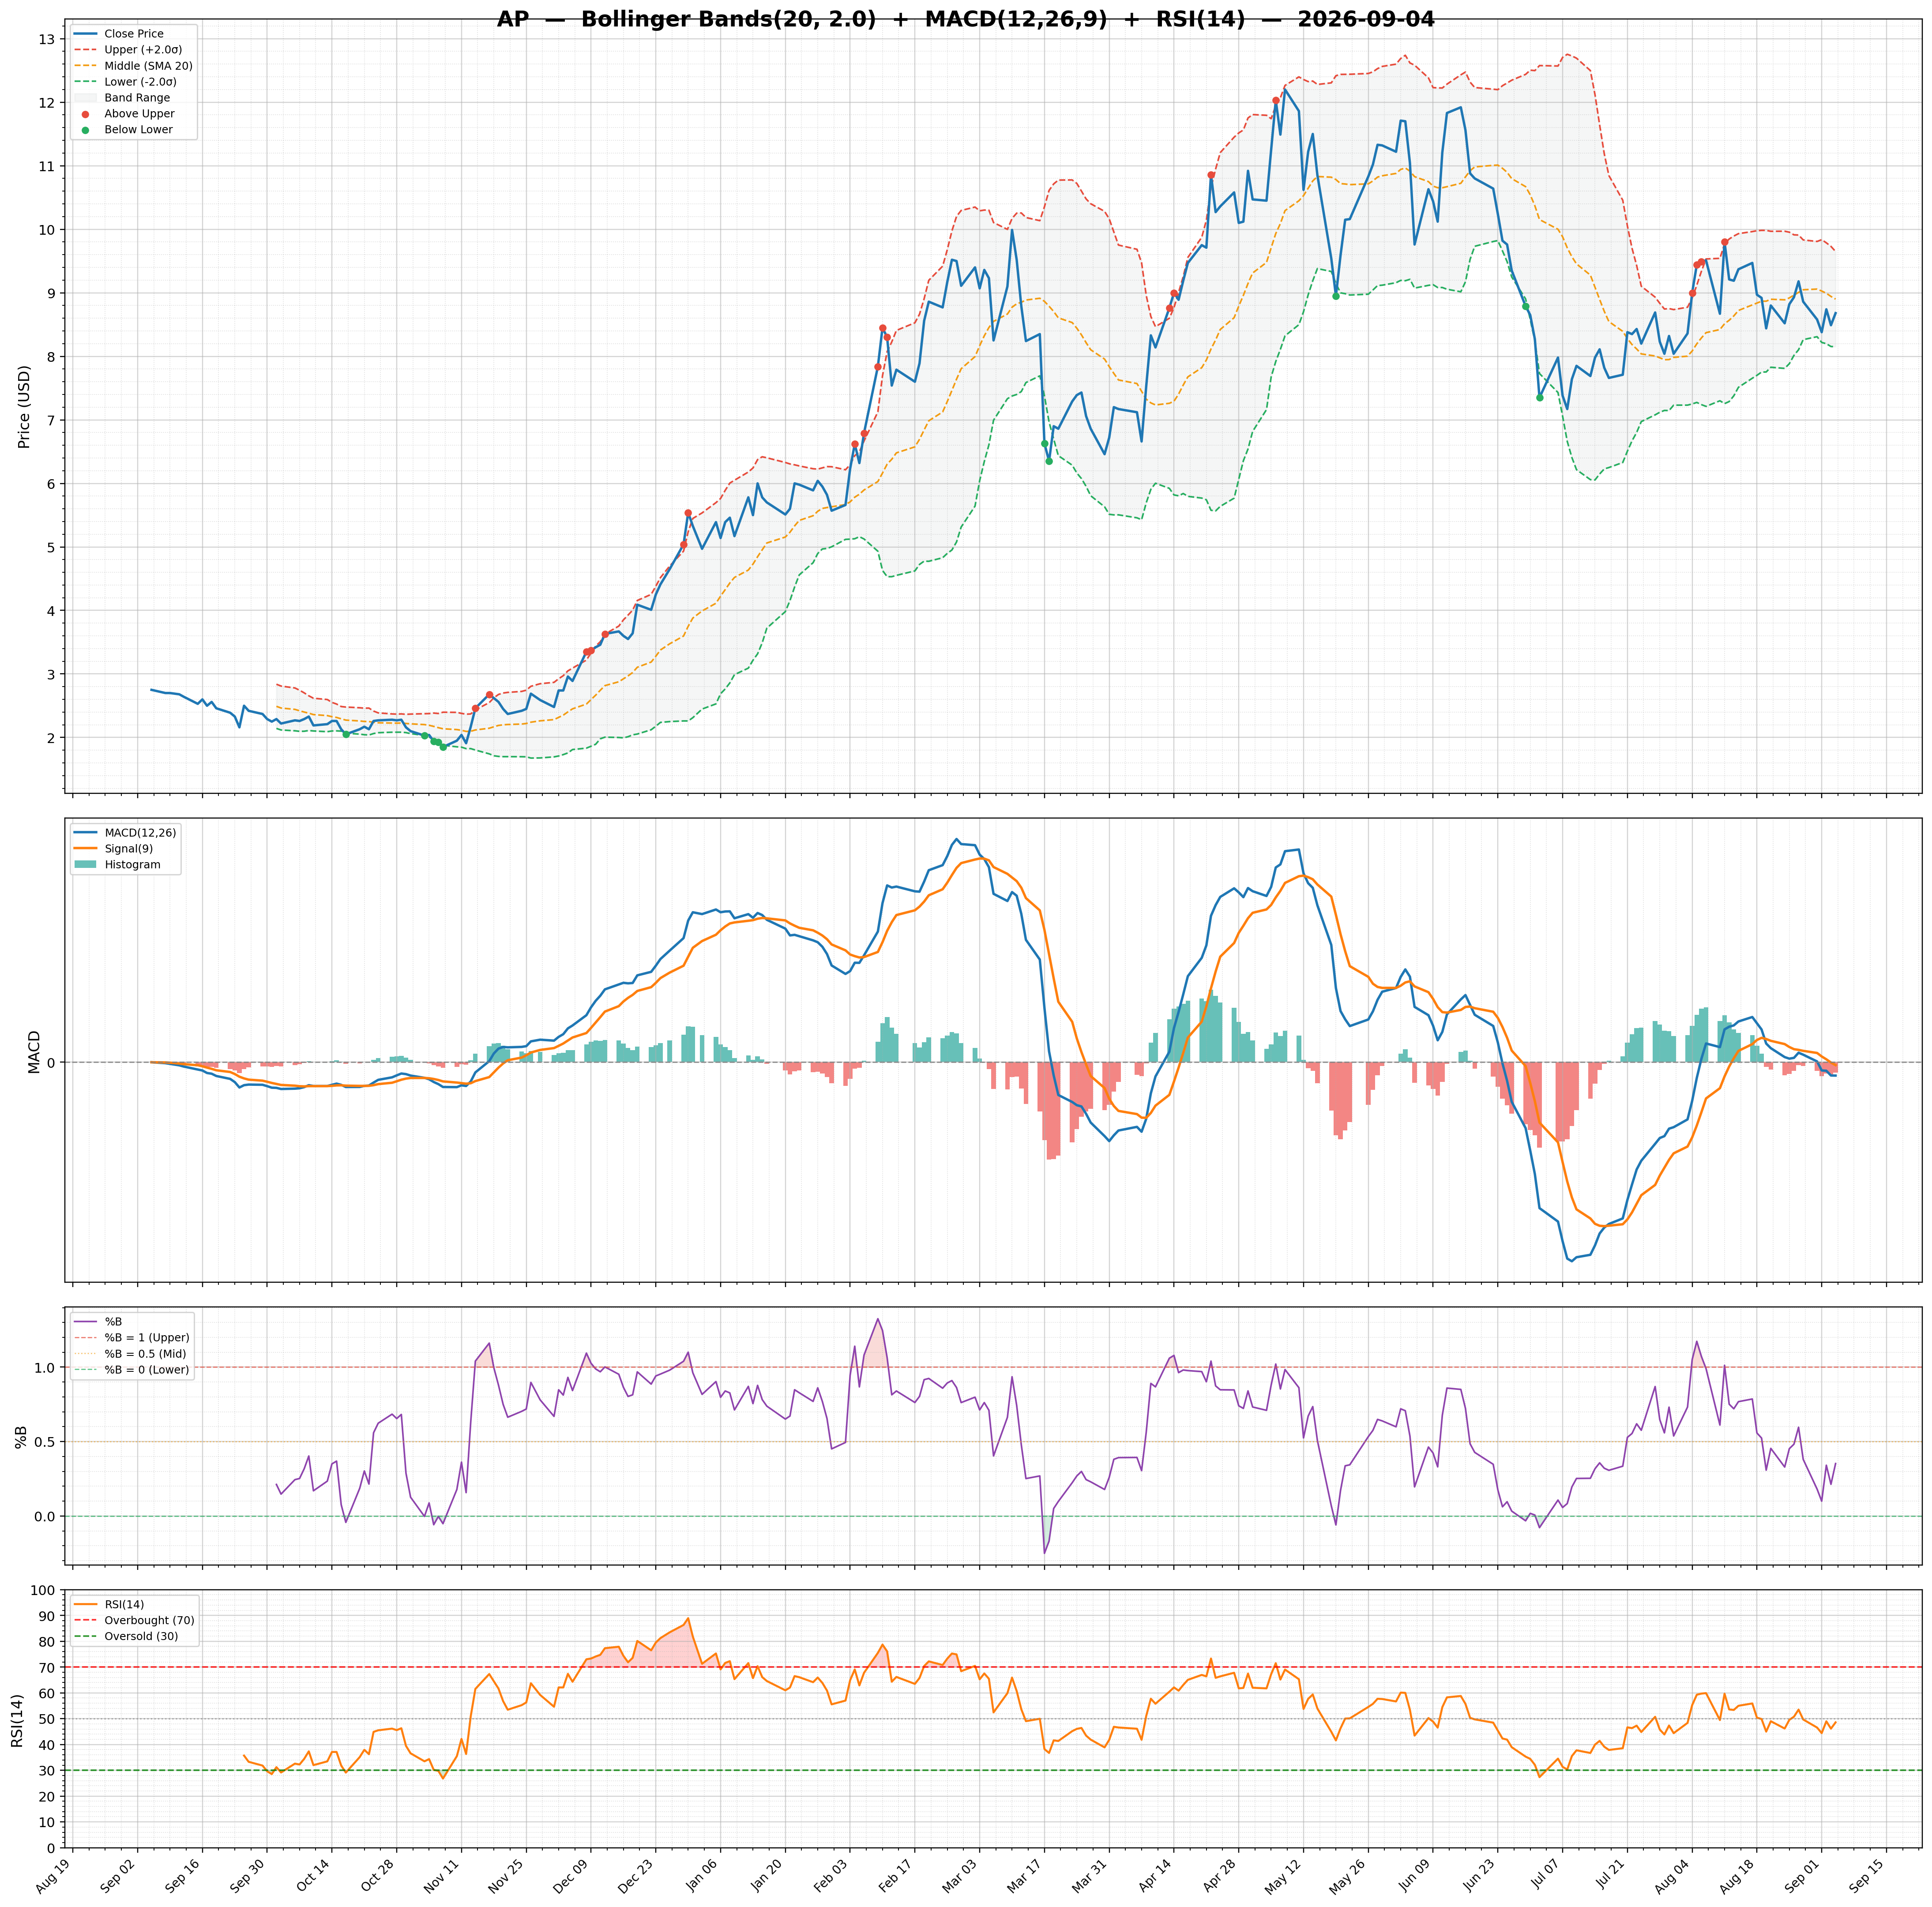
| MACD | -0.15 | Lower Band | 7.84 | Target Low | N/A |
| MACD Signal | -0.01 | Middle Band | 8.86 | Target Median | N/A |
| Histogram | -0.14 | Upper Band | 9.88 | Analysts | N/A |
| Previous Histogram | -0.12 | Bandwidth | 23.090 | Upside | N/A |
| Histogram Trend | Decreasing | %B | -0.01 | ||