Alpha Pro Tech, Ltd. (APT)
Industrials • Building Products & Equipment • $5.53 • MCap: 56,644,512
https://www.alphaprotech.com • Alpha Pro Tech, Ltd., together with its subsidiaries, develops, manufactures, and markets a range of disposable protective apparel and infection control products in the United States and internationally. The company operates through two business segments, Building Supply and Disposable Protective Apparel. The Building Supply segment offers construction supply weatherization products, such as housewraps; housewrap accessories, including window and door flashing, and seam tapes; synthetic roof underlayment products; synthetic roof underlayment accessories comprising self-adhered roof underlayments; and other woven materials. The Disposable Protective Apparel segment provides shoe covers, bouffant caps, coveralls, frocks, lab coats, and gowns and hoods, as well as face masks and face shields. It sells its products under the Alpha Pro Tech brand name, as well as under private labels. The company's products are used primarily in cleanrooms; industrial safety manufacturing environments; and health care facilities, such as hospitals, laboratories, and dental offices, as well as residential and multi-family building and re-roofing sites. It distributes its products through a network of purchasing groups, distributors, independent sales representatives, and its sales and marketing force. Alpha Pro Tech, Ltd. was founded in 1983 and is headquartered in Aurora, Canada.
AAII
NEW AAII Inv on Indicators
| Score | Price | 52 Week & Averages | Relative Strength | Risk | |||||
|---|---|---|---|---|---|---|---|---|---|
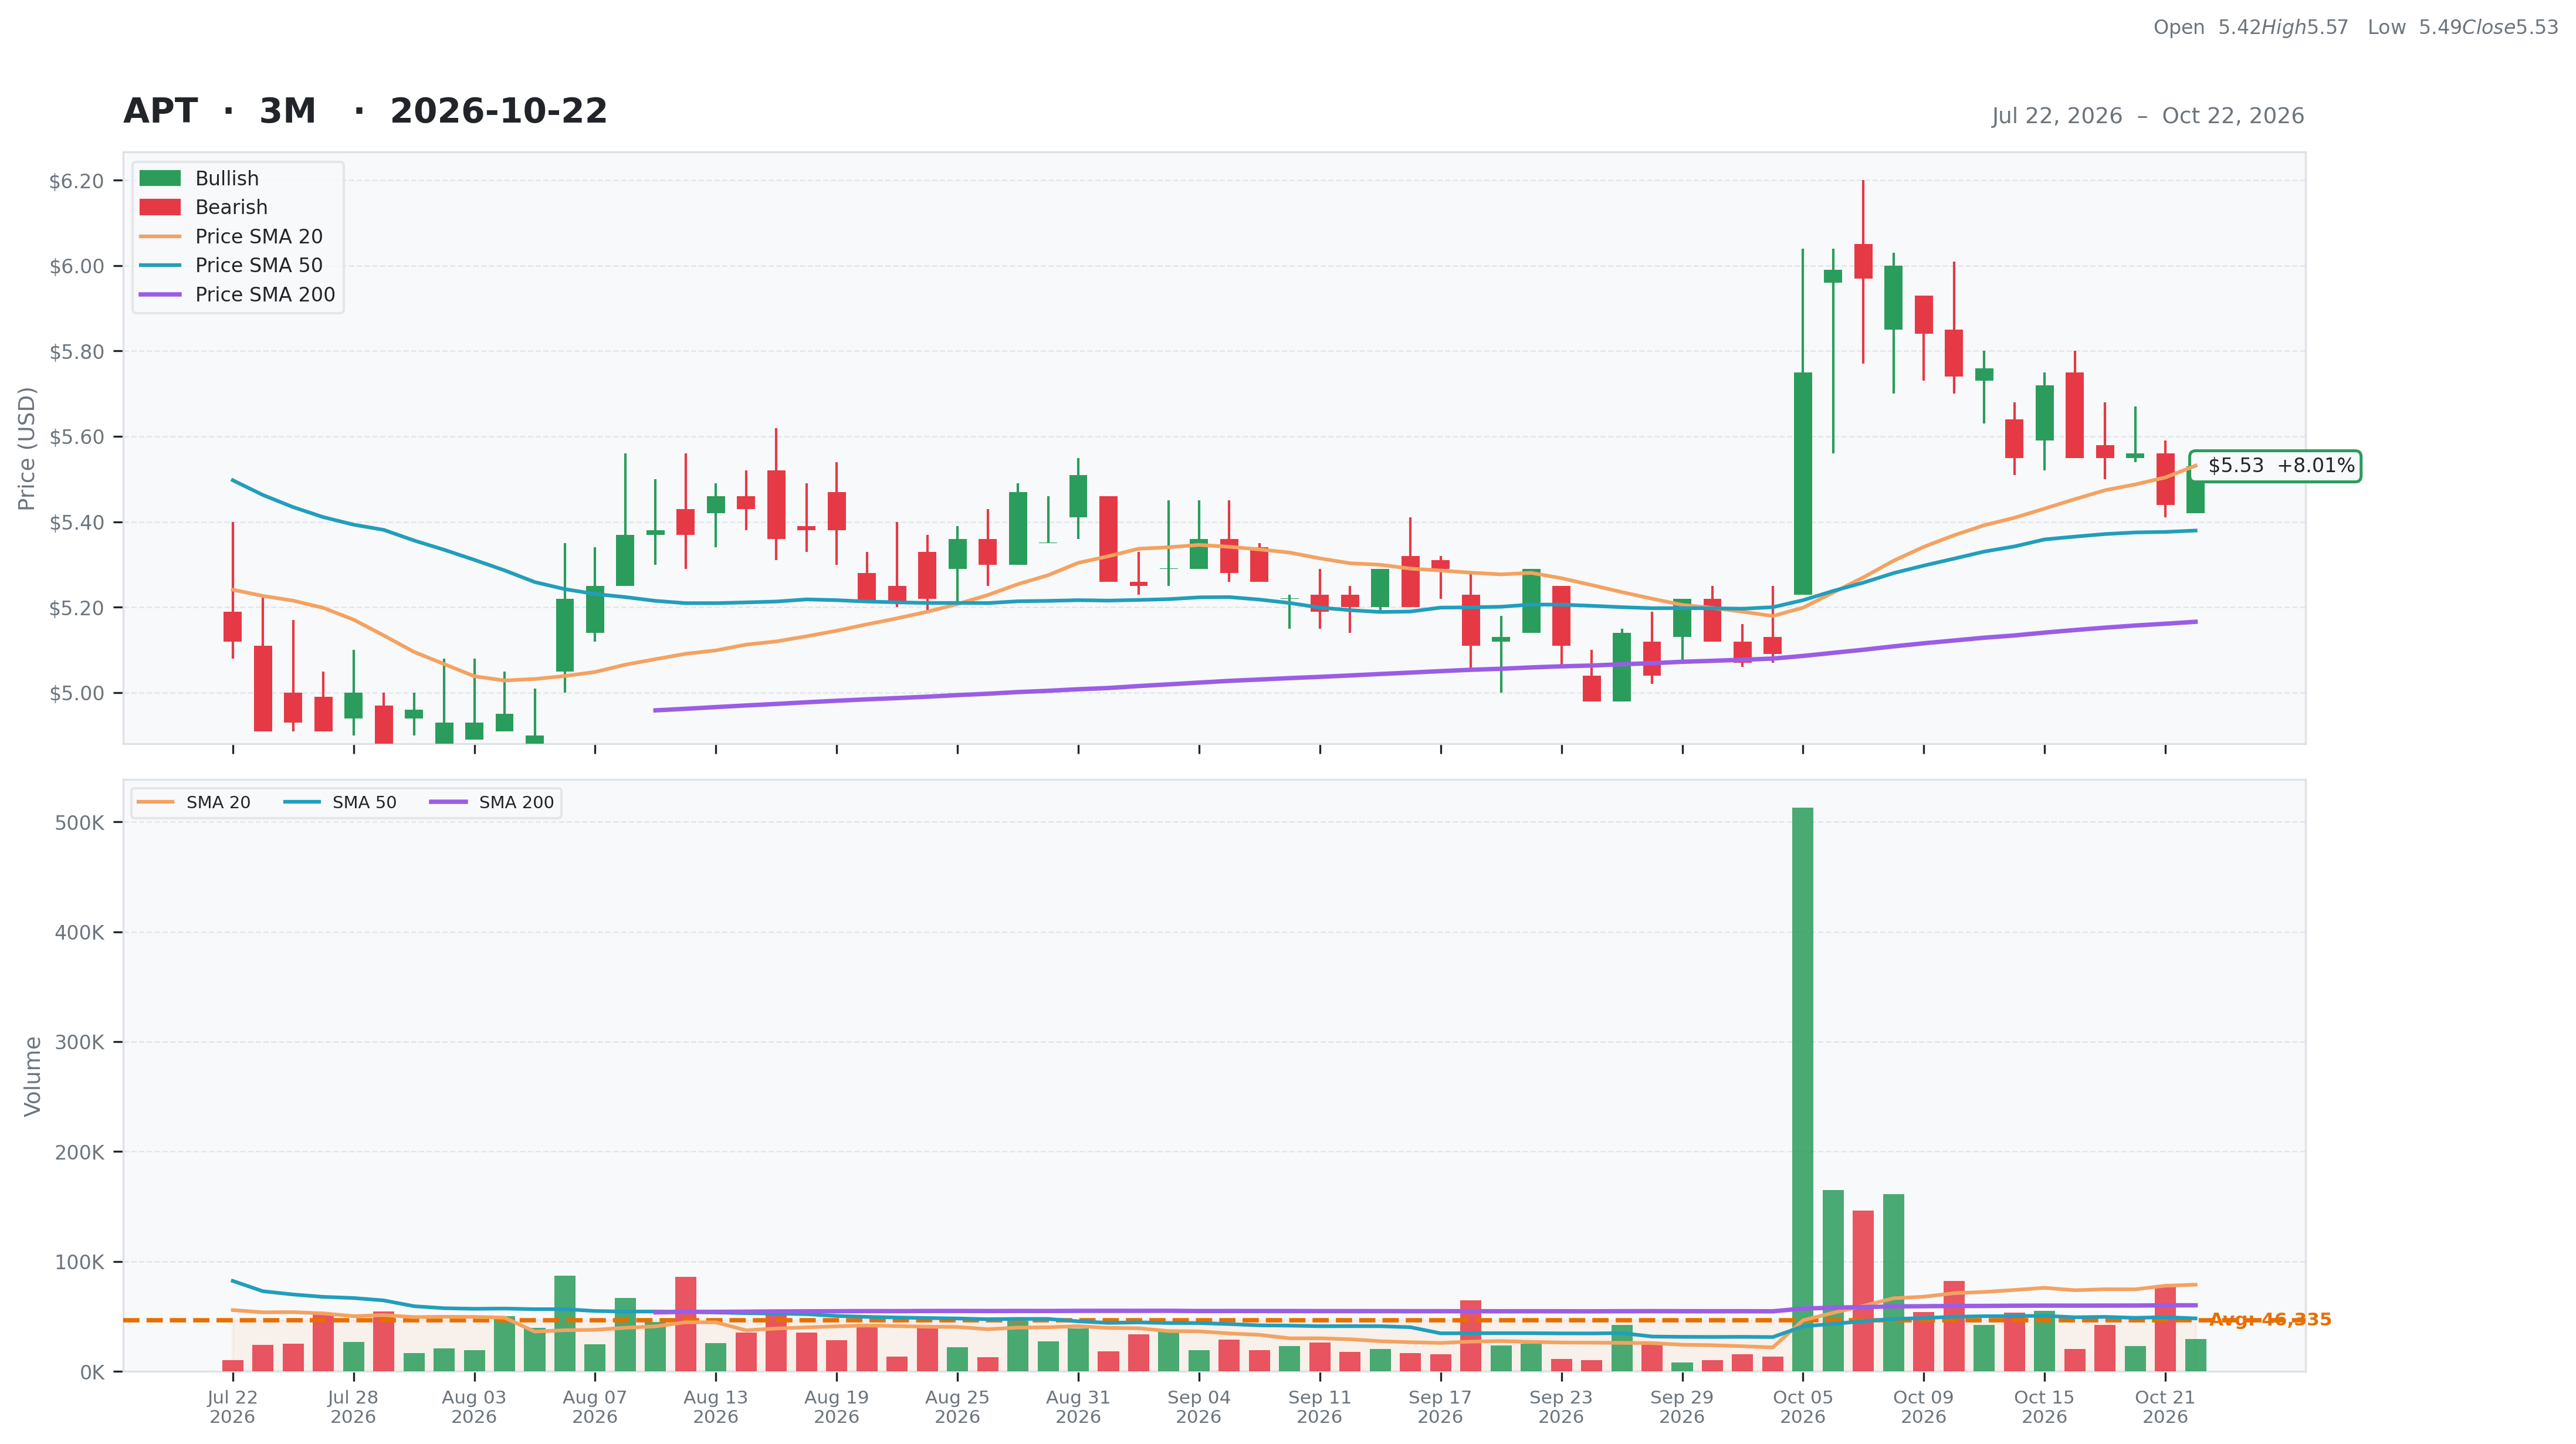
| Total | 72 | Current | $5.53 | 52W High | $6.64 -16.72% | Relative Strength | 0.17 | Beta | 0.86 |
| Business Quality | 11 | Weekly | $5.72 -3.32% | 52W Low | $4.34 27.42% | 3M | 0.12 | Short % | 0.01 |
| Financial Strength | 17 | Monthly | $5.29 4.54% | Above 50DMA | $5.38 2.80% | 6M | 0.22 | Risk Score | 9 |
| Growth Outlook | 15 | Quarterly | $4.93 12.17% | Above 200DMA | $5.17 7.05% | 9M | 0.17 | ||
| Momentum | 3 | Yearly | $4.67 18.42% | 12M | 0.18 | ||||
| Valuation | Financial Strength | Growth/Profitability | |||
|---|---|---|---|---|---|
| Trailing P/E | 14.23 | Cash | 19M | Revenue Growth | 0.12% |
| Forward P/E | 4.78 | Debt | 8M | Earnings Growth | 0.52% |
| PEG Ratio | N/A | Debt/Equity | 11.74 | Qtr Earnings Growth | 0.47% |
| Price/Sales | 0.91 | Current Ratio | 17.04 | Gross Margin | 0.37% |
| Price/Book | 0.87 | Quick Ratio | 9.44 | Operating Margin | 0.09% |
| EV/Revenue | 0.73 | Operating CF | 6M | Profit Margin | 0.07% |
| EV/EBITDA | 8.52 | Free CF | 4M | EBITDA Margin | 0.09% |
| Ent Value | 45M | Return on Assets | 0.04% | ||
| Return on Equity | 0.07% | ||||
| Technical | Volume & Bollinger Bands | Analyst | |||
|---|---|---|---|---|---|
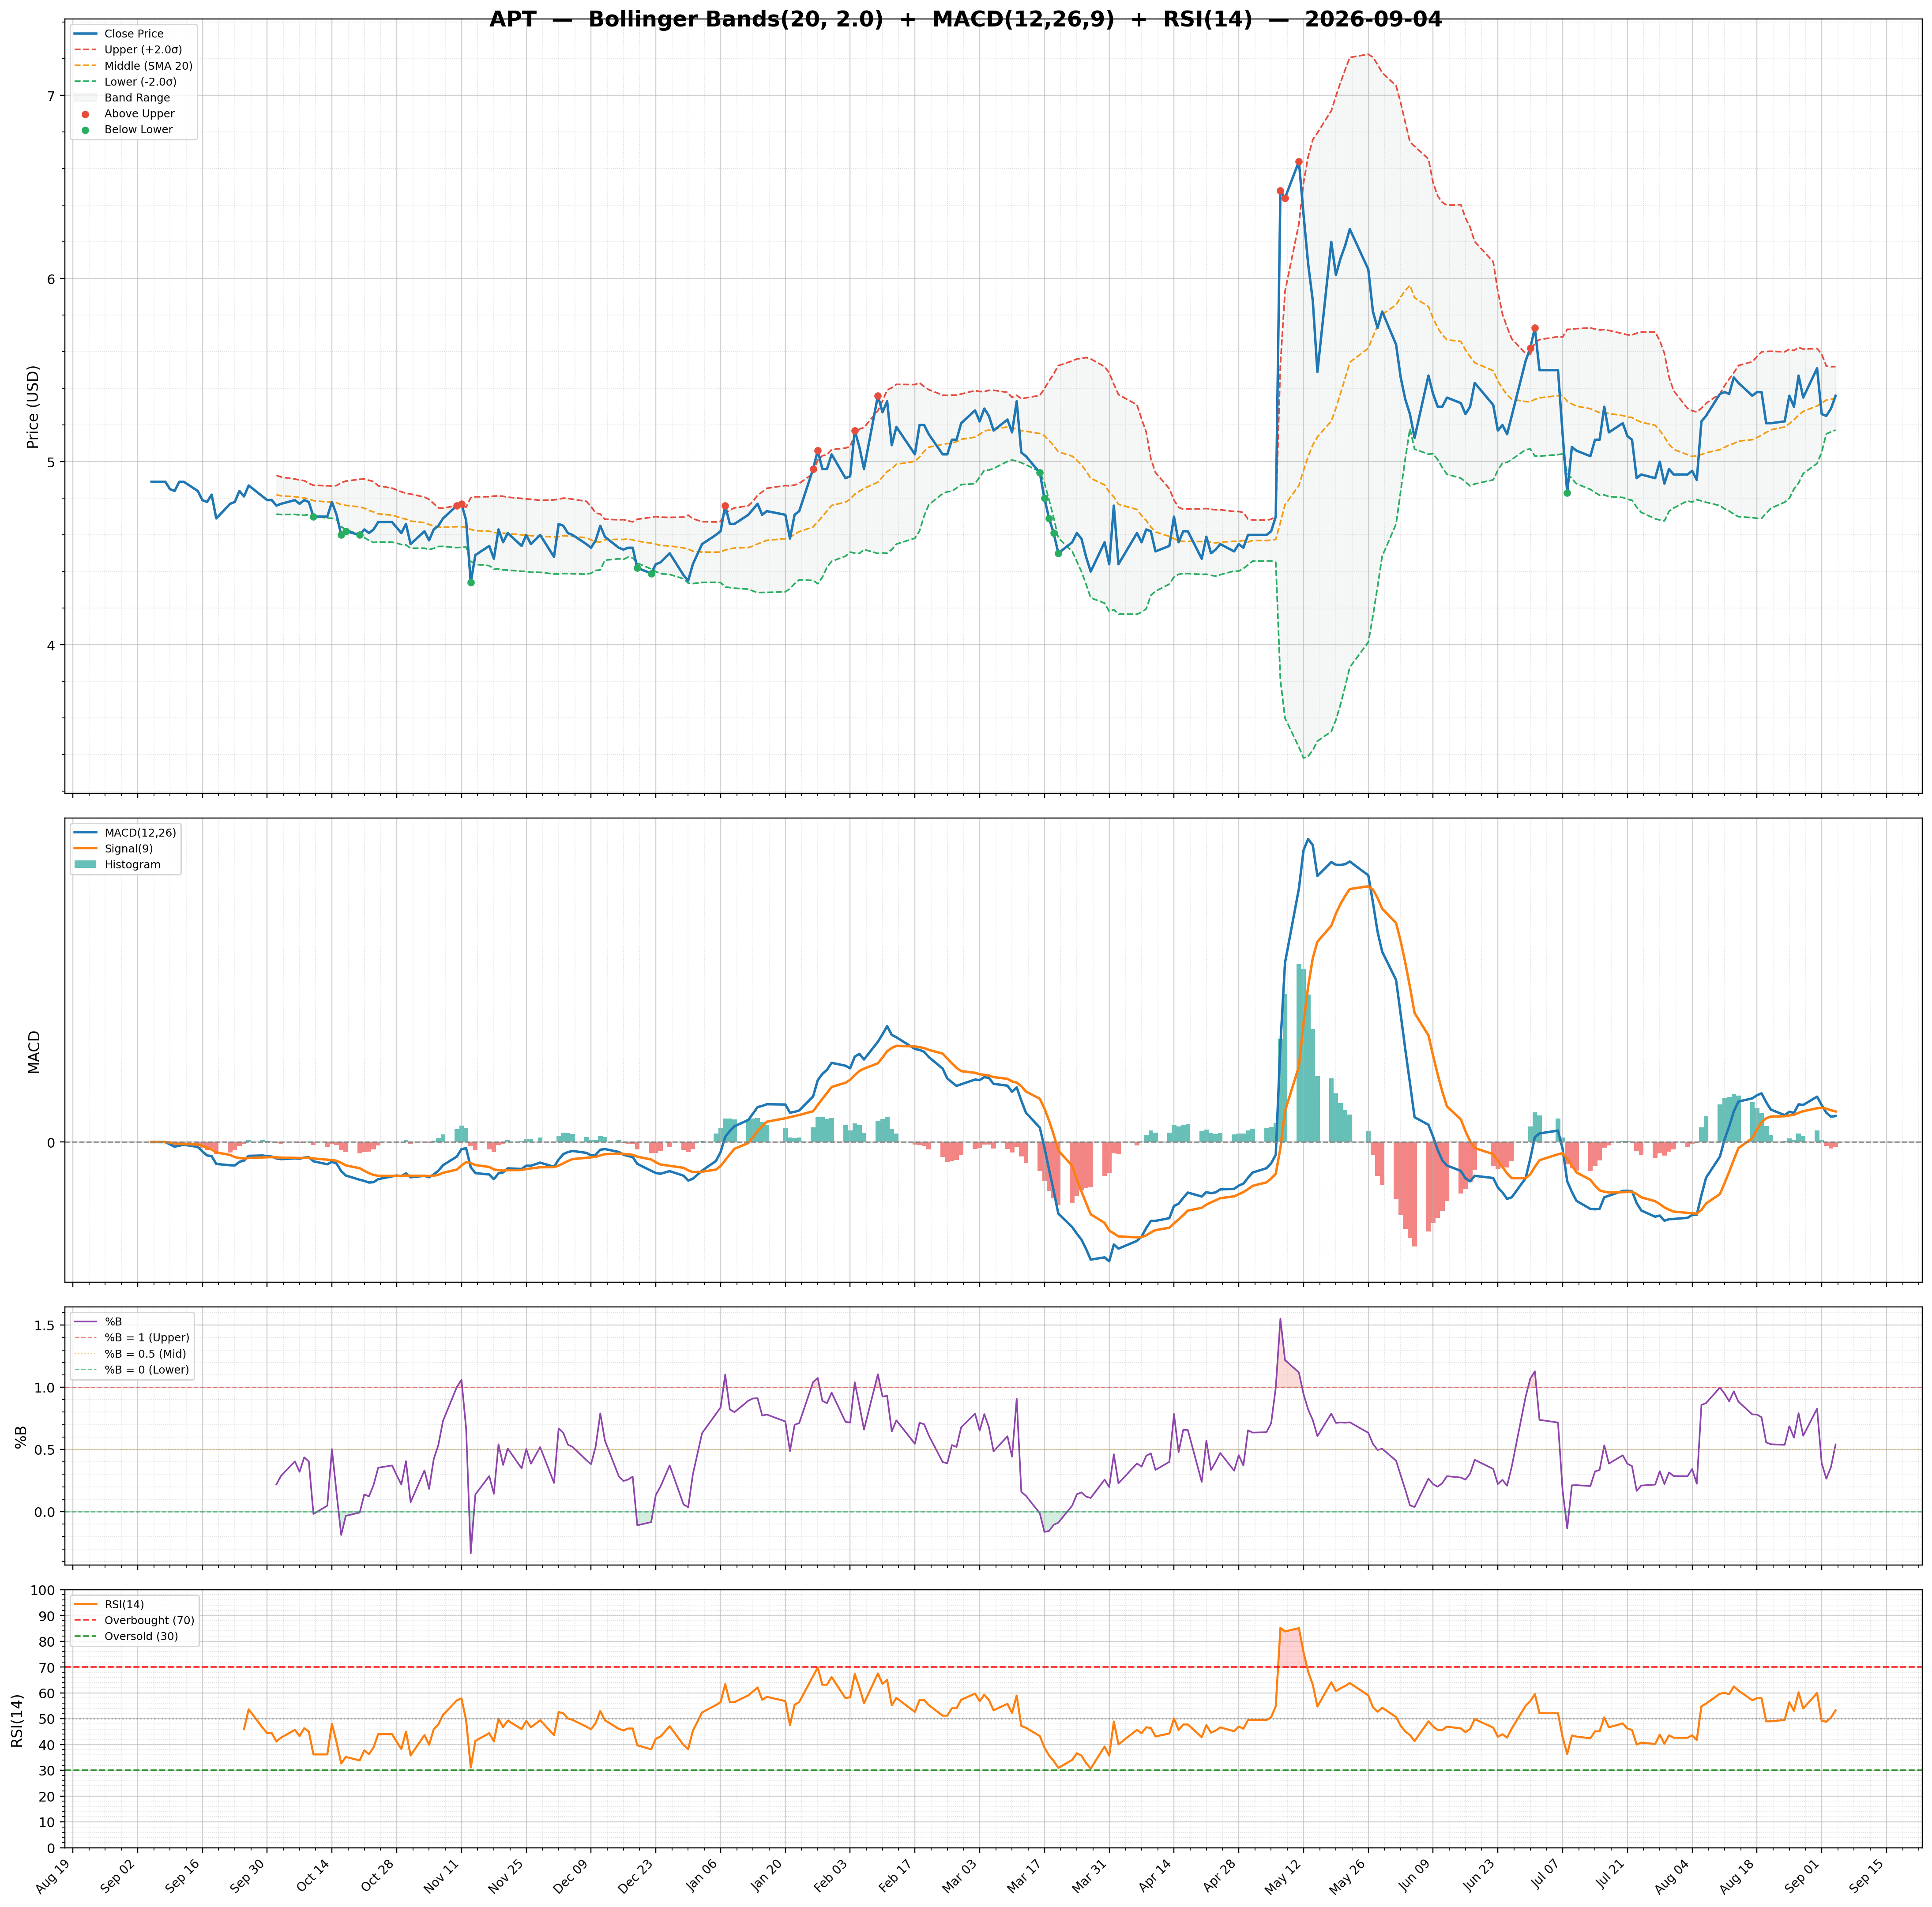
| RSI | 51.24 | Volume | 0.02M | Rating | none |
| Previous RSI | 48.29 | Avg Volume 20D | 0.08M | Target Mean | N/A |
| RSI Trend | Up | Relative Volume | 0.49 | Target High | N/A |
| MACD | 0.07 | Lower Band | 4.89 | Target Low | N/A |
| MACD Signal | 0.10 | Middle Band | 5.53 | Target Median | N/A |
| Histogram | -0.03 | Upper Band | 6.18 | Analysts | N/A |
| Previous Histogram | -0.03 | Bandwidth | 23.320 | Upside | N/A |
| Histogram Trend | Decreasing | %B | 0.50 | ||