Aptiv PLC (APTV)
Consumer Cyclical • Auto Parts • $43.81 • MCap: 9,314,430,976
https://www.aptiv.com • Aptiv PLC, an industrial technology company, provides hardware and software solutions to support automotive and other industries in North America, Europe, the Middle East, Africa, the Asia Pacific, and South America. It operates through three segments: Advanced Safety and User Experience, Engineered Components, and Electrical Distribution Systems. The company offers active safety, user experience and smart vehicle compute, and software products for vehicle safety and security, including intelligent sensors, compute platforms, and software tools and services. It also provides connection systems, interconnects, and cable management and protection solutions for the distribution of power, signal, and data. Aptiv PLC was incorporated in 2011 and is based in Schaffhausen, Switzerland.
Watch List
| Score | Price | 52 Week & Averages | Relative Strength | Risk | |||||
|---|---|---|---|---|---|---|---|---|---|
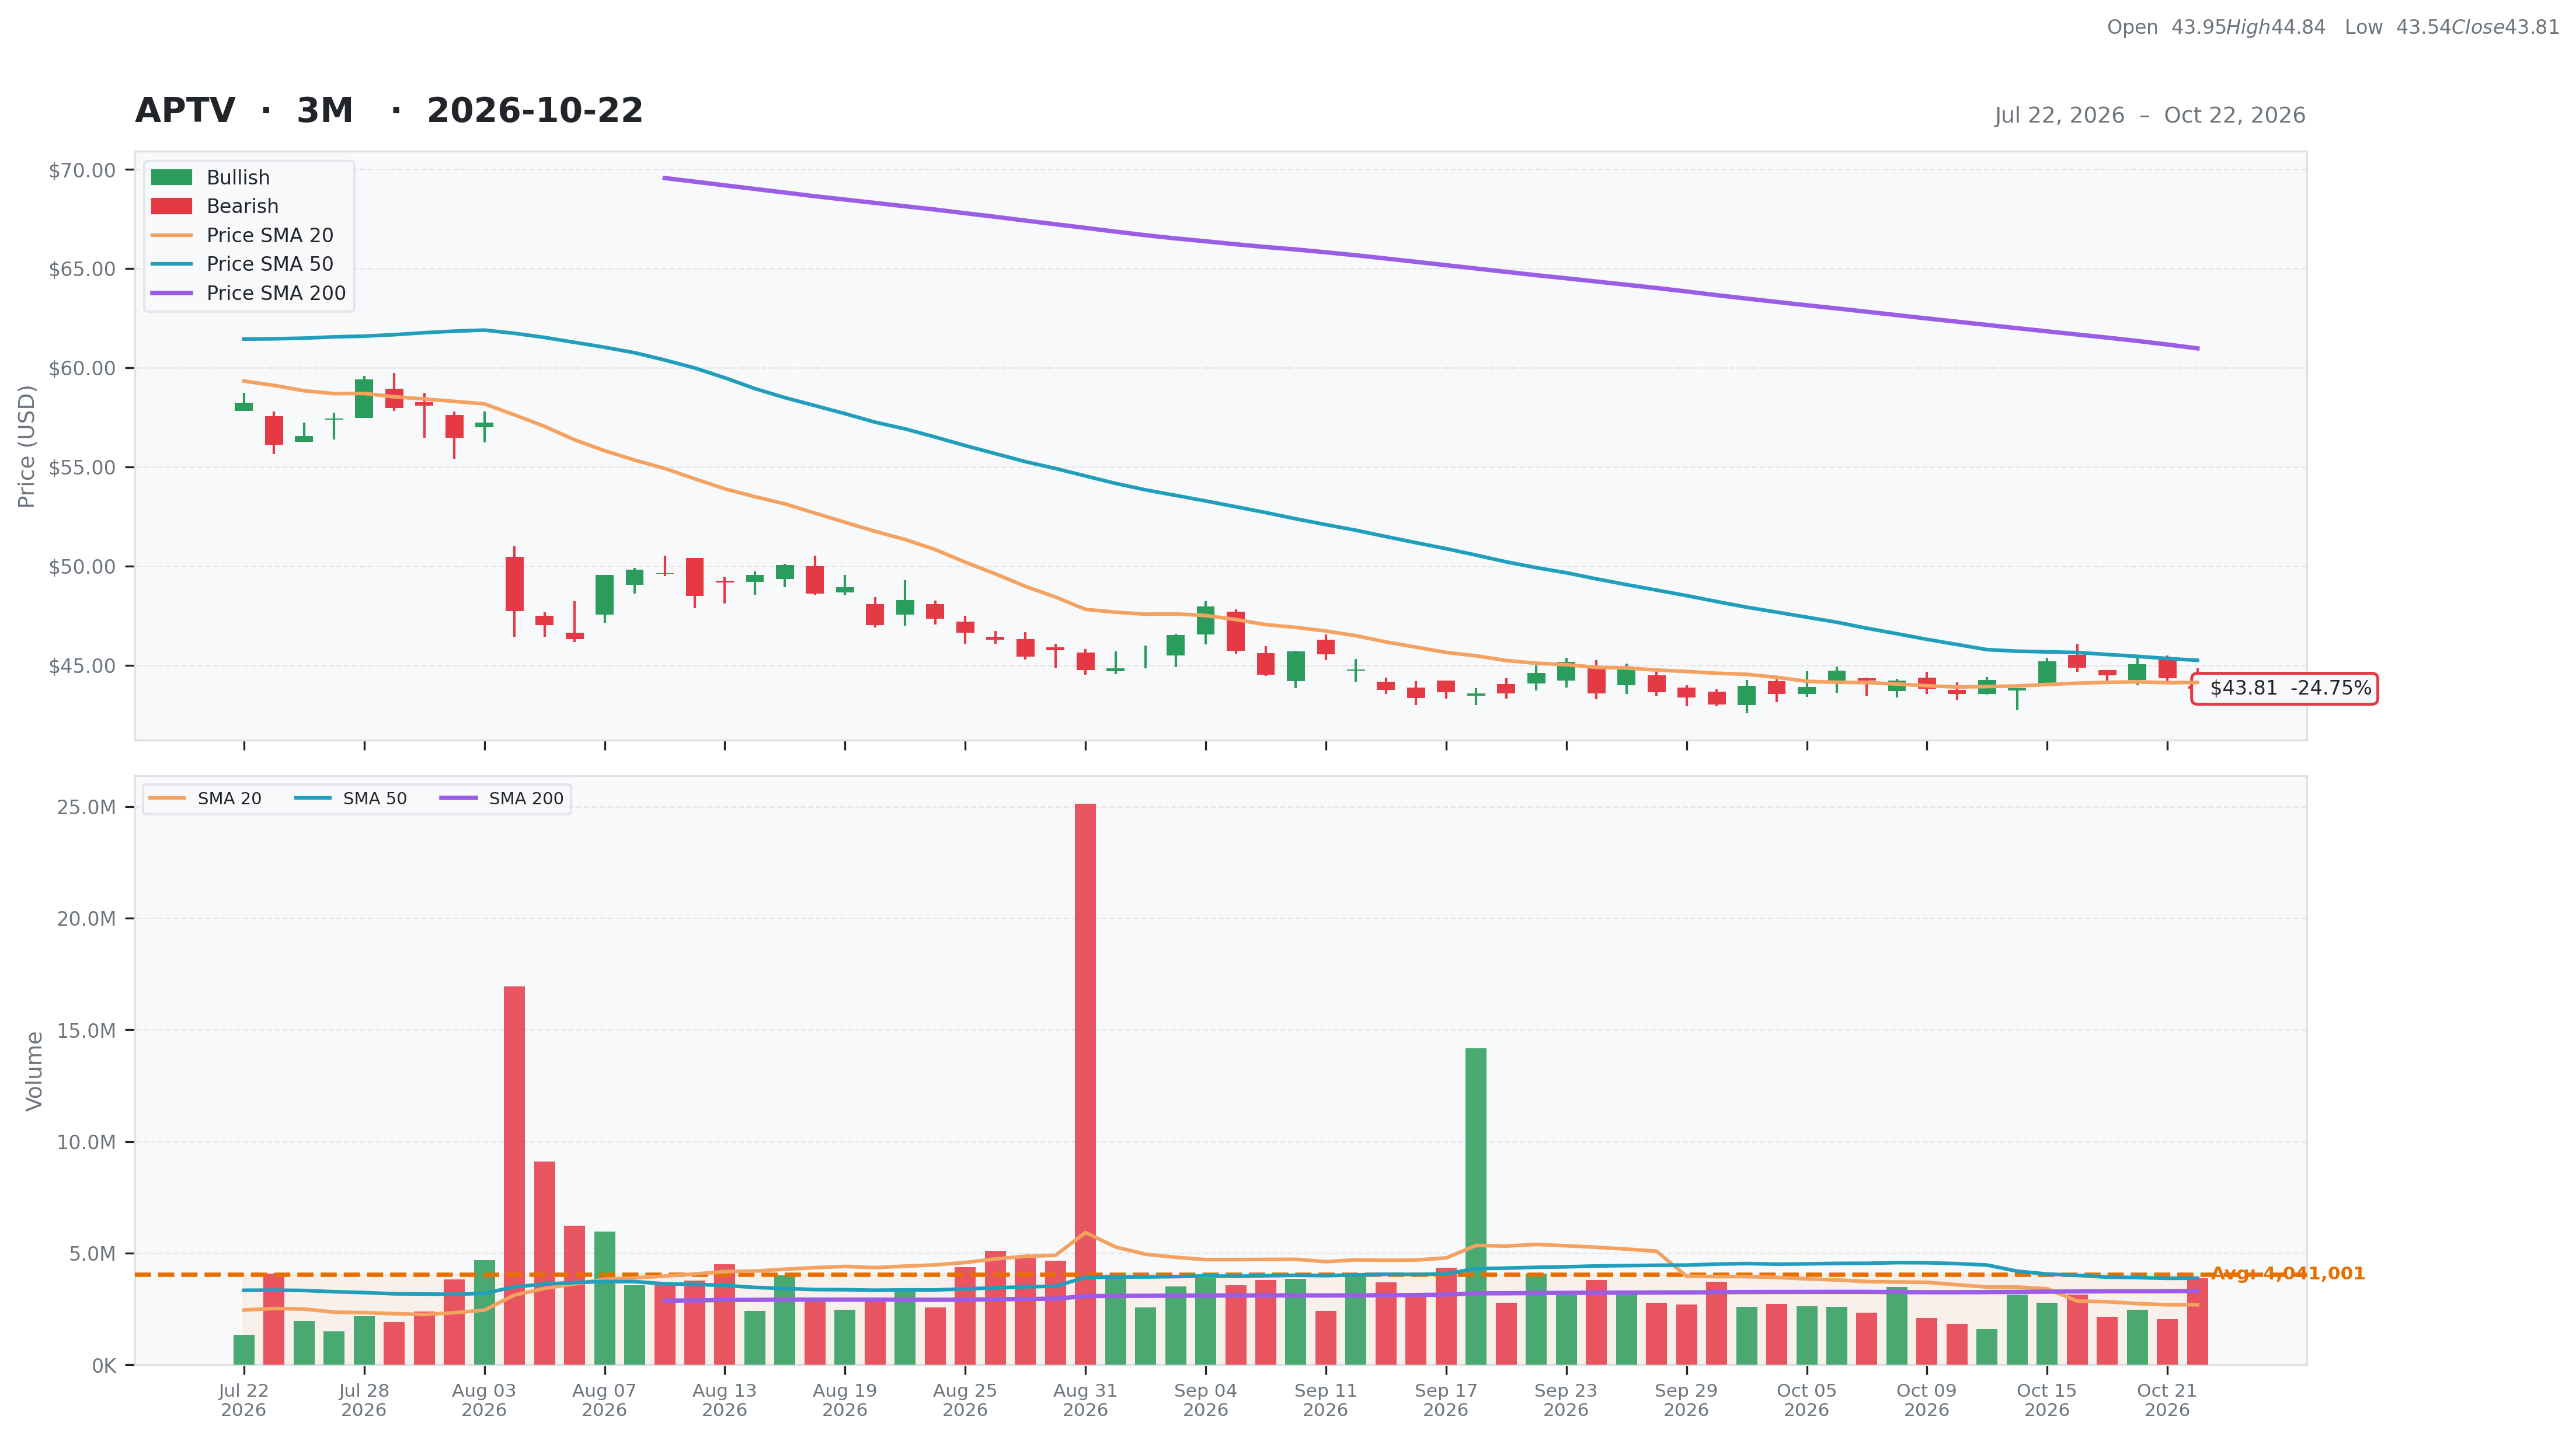
| Total | 47 | Current | $43.81 | 52W High | $88.67 -50.59% | Relative Strength | -0.33 | Beta | 1.36 |
| Business Quality | 6 | Weekly | $45.19 -3.05% | 52W Low | $43.02 1.84% | 3M | -0.23 | Short % | 0.06 |
| Financial Strength | 12 | Monthly | $44.61 -1.79% | Above 50DMA | $45.24 -3.17% | 6M | -0.27 | Risk Score | 8 |
| Growth Outlook | 4 | Quarterly | $56.55 -22.53% | Above 200DMA | $60.97 -28.15% | 9M | -0.43 | ||
| Momentum | 3 | Yearly | $86.11 -49.12% | 12M | -0.49 | ||||
| Valuation | Financial Strength | Growth/Profitability | |||
|---|---|---|---|---|---|
| Trailing P/E | 44.42 | Cash | 761M | Revenue Growth | 0.02% |
| Forward P/E | 6.92 | Debt | 5,684M | Earnings Growth | -0.35% |
| PEG Ratio | 0.95 | Debt/Equity | 64.94 | Qtr Earnings Growth | -0.37% |
| Price/Sales | 0.45 | Current Ratio | 2.02 | Gross Margin | 0.19% |
| Price/Book | 1.07 | Quick Ratio | 1.27 | Operating Margin | 0.13% |
| EV/Revenue | 0.69 | Operating CF | 1,351M | Profit Margin | 0.01% |
| EV/EBITDA | 4.40 | Free CF | 1,616M | EBITDA Margin | 0.16% |
| Ent Value | 14,237M | Return on Assets | 0.07% | ||
| Return on Equity | 0.05% | ||||
| Technical | Volume & Bollinger Bands | Analyst | |||
|---|---|---|---|---|---|
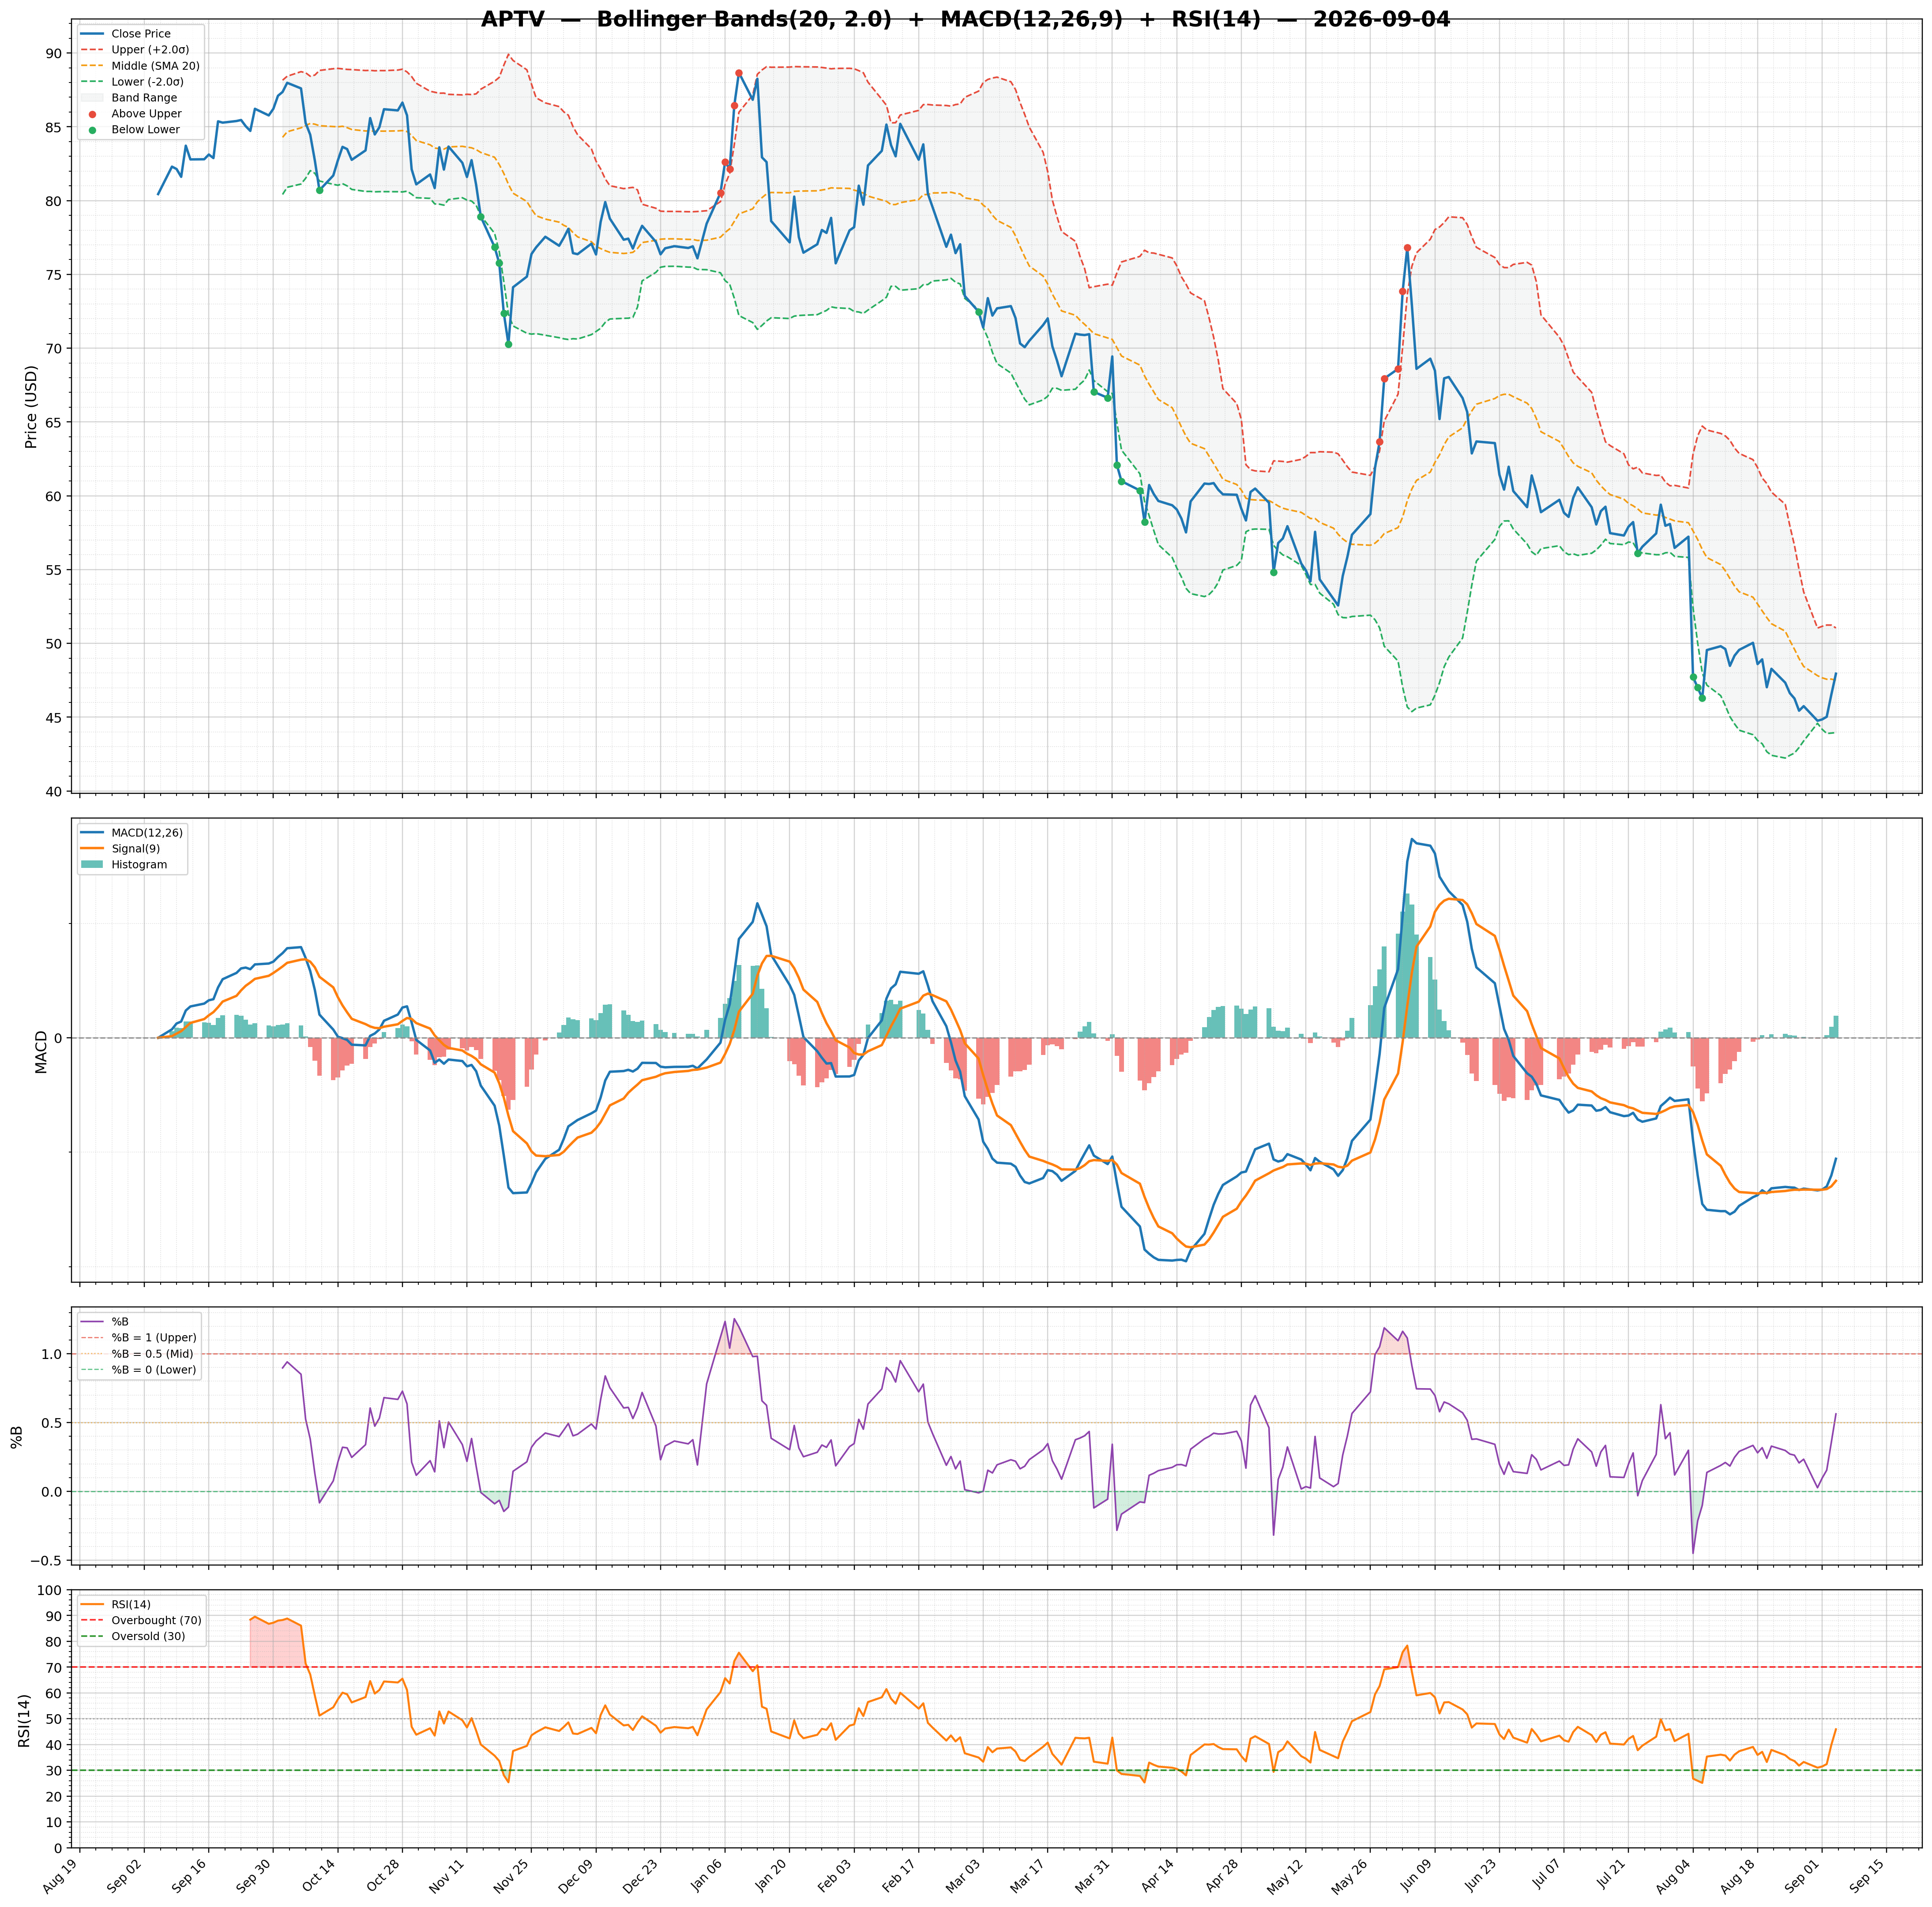
| RSI | 44.89 | Volume | 3.1M | Rating | buy |
| Previous RSI | 47.73 | Avg Volume 20D | 2.69M | Target Mean | $64.72 |
| RSI Trend | Down | Relative Volume | 1.17 | Target High | $77.00 |
| MACD | -0.28 | Lower Band | 42.95 | Target Low | $50.00 |
| MACD Signal | -0.46 | Middle Band | 44.13 | Target Median | $63.00 |
| Histogram | 0.17 | Upper Band | 45.31 | Analysts | 18 |
| Previous Histogram | 0.24 | Bandwidth | 5.350 | Upside | 44.28% |
| Histogram Trend | Decreasing | %B | 0.37 | ||