Arhaus, Inc. (ARHS)
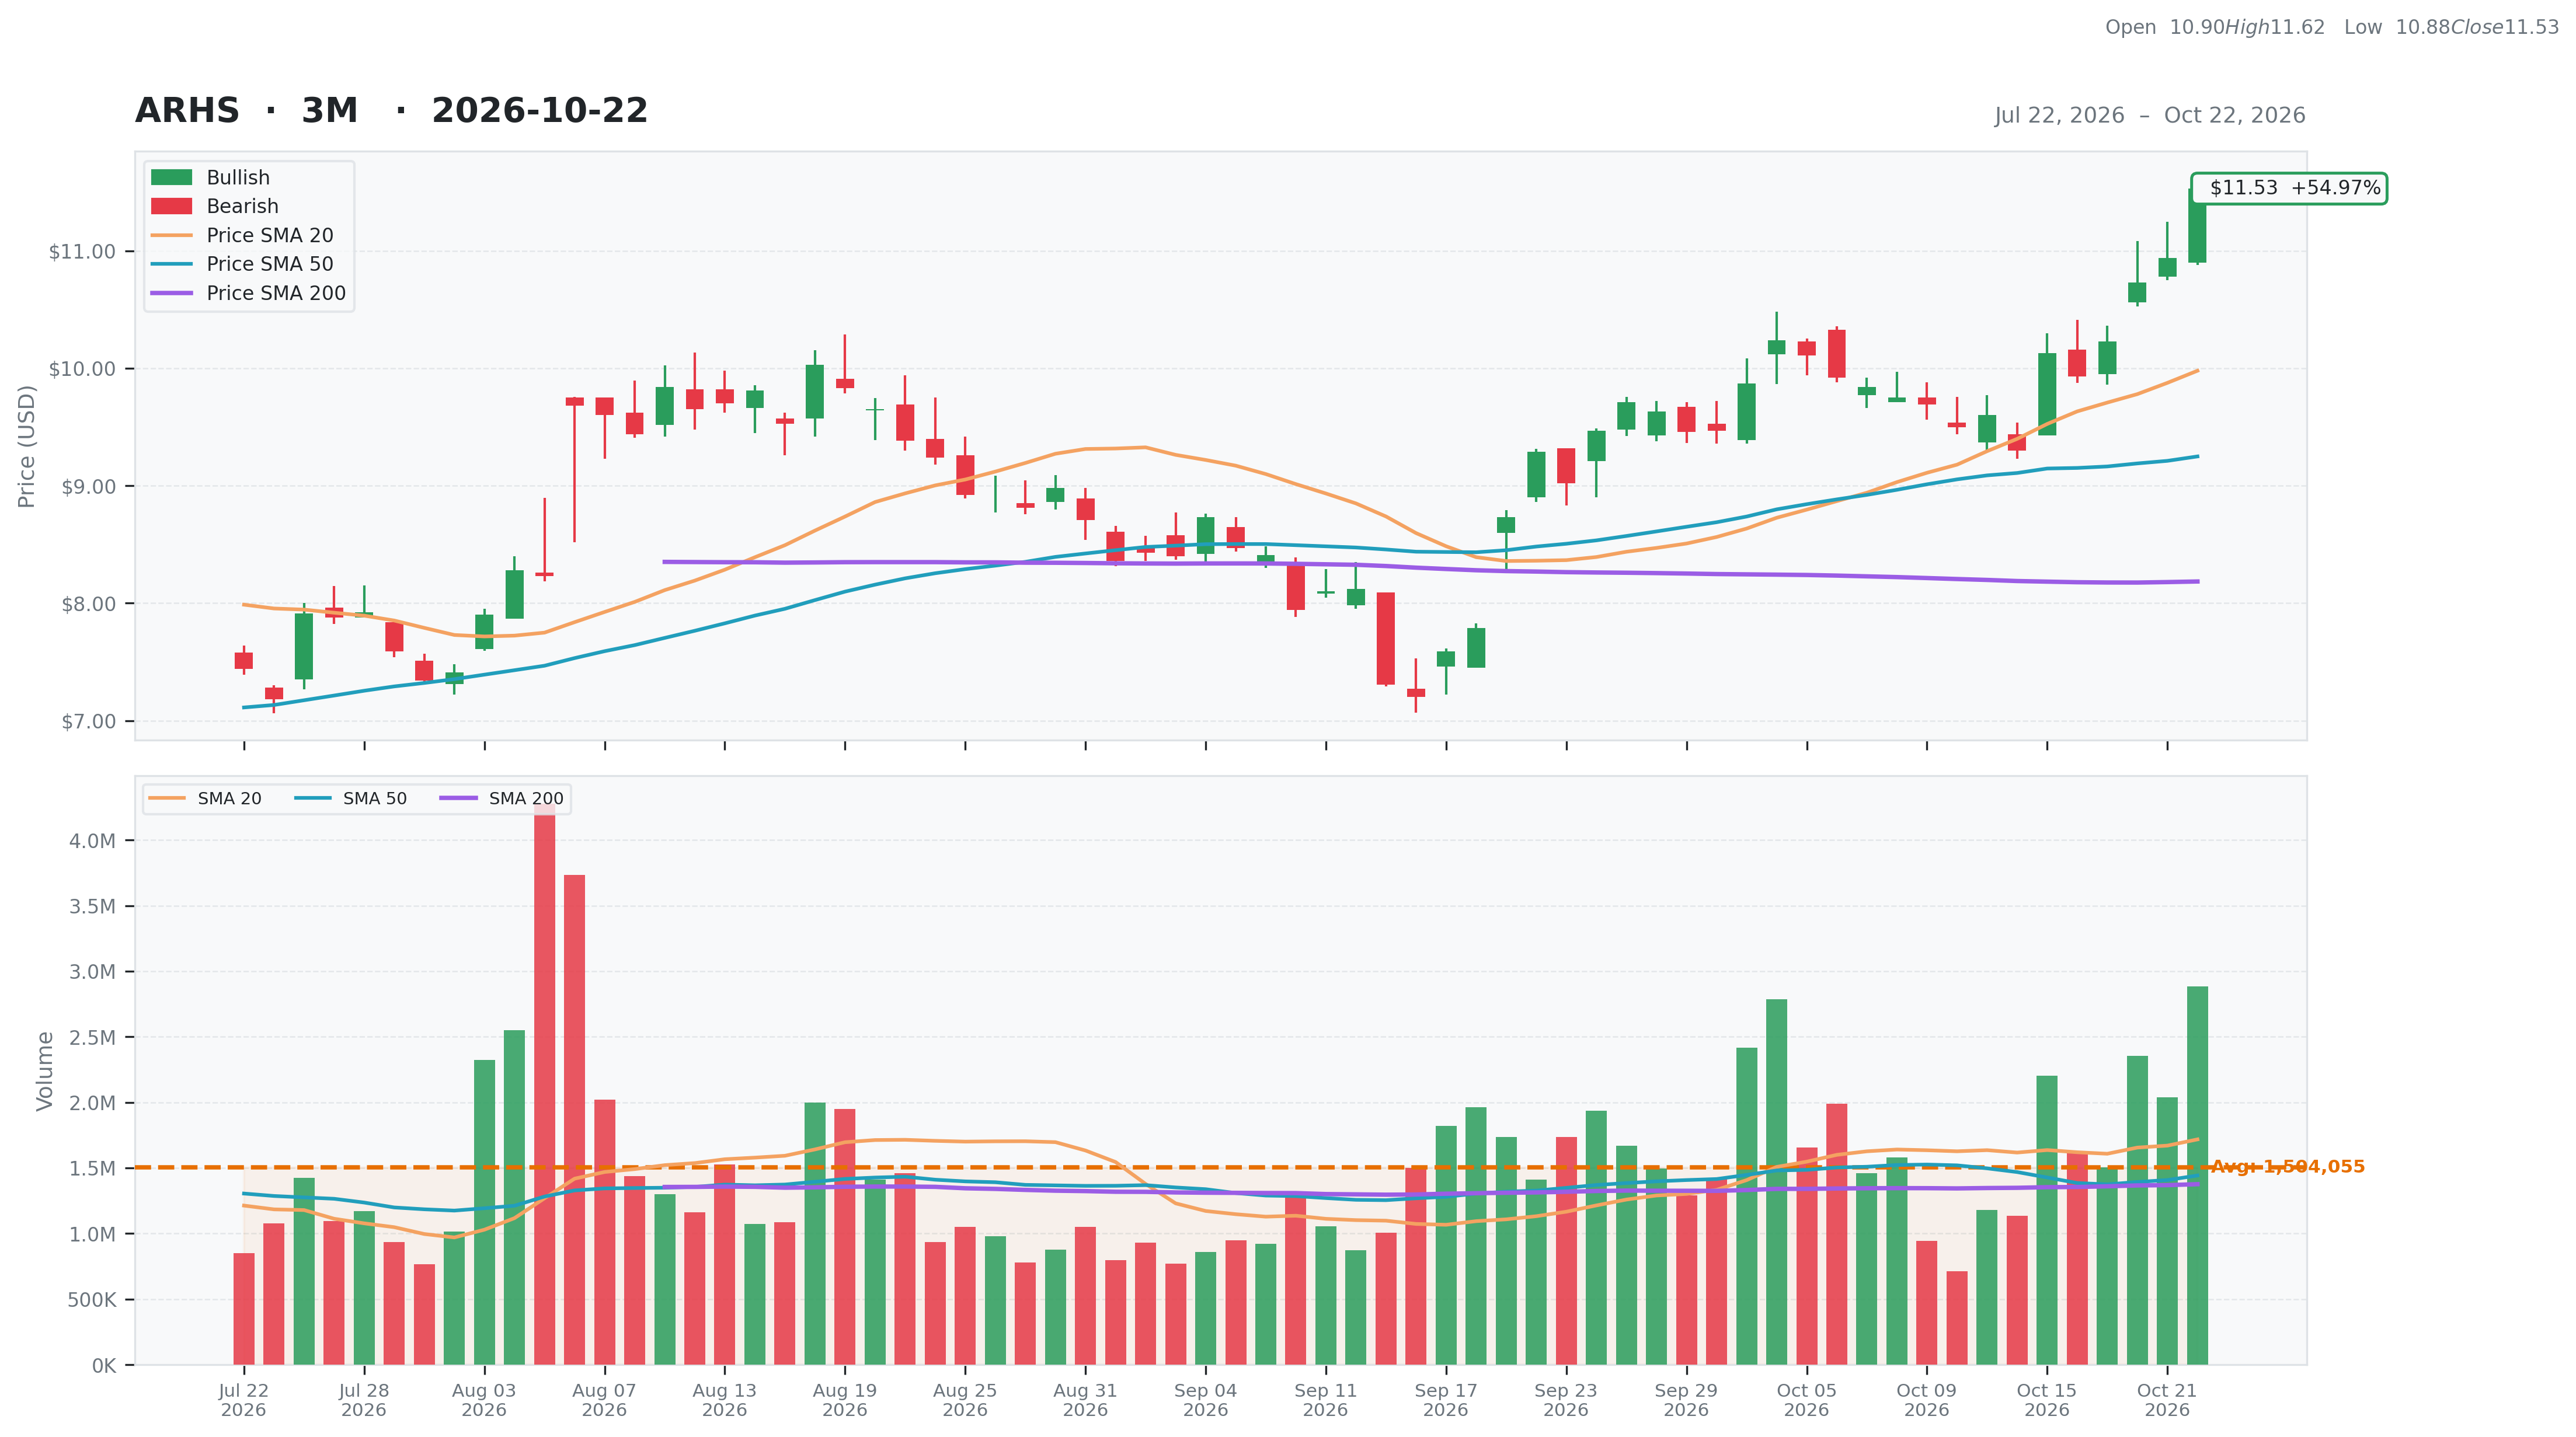
Consumer Cyclical • Specialty Retail • $11.53 • MCap: 1,405,492,864
https://www.arhaus.com • Arhaus, Inc. operates as a premium retailer in the home furnishings market in the United States. The company offers bedroom, dining room, and living room, as well as home office furnishings, including sofas, dining tables and chairs, accent chairs, console and coffee tables, beds, headboards, dressers, desks, bookcases, modular storage, and other items; and outdoor products, such as outdoor dining tables, chairs, chaises and other furniture, lighting, textiles, décor, umbrellas, and fire pits. It also provides bath product assortment comprising vanities and storage pieces, faucets and hardware, and Turkish bath towels; lighting fixtures, including chandeliers, pendants, table and floor lamps, and sconces; indoor and outdoor rugs, bed linens, and pillows and throws; and décor products, such as wall art, mirrors, vases, candles, and other decorative accessories. The company distributes its products through an omni-channel model comprising showrooms, ecommerce, catalogs and digital media, interior designer services, trade services, and client engagement. Arhaus, Inc. was founded in 1986 and is headquartered in Boston Heights, Ohio.
ET
| Score | Price | 52 Week & Averages | Relative Strength | Risk | |||||
|---|---|---|---|---|---|---|---|---|---|
| Total | 45 | Current | $11.53 | 52W High | $11.53 0.00% | Relative Strength | 0.35 | Beta | 2.31 |
| Business Quality | 9 | Weekly | $10.13 13.82% | 52W Low | $5.75 100.52% | 3M | 0.46 | Short % | 0.11 |
| Financial Strength | 9 | Monthly | $9.29 24.11% | Above 50DMA | $9.25 24.66% | 6M | 0.53 | Risk Score | 10 |
| Growth Outlook | 7 | Quarterly | $7.91 45.76% | Above 200DMA | $8.18 40.88% | 9M | 0.13 | ||
| Momentum | 4 | Yearly | $9.91 16.33% | 12M | 0.16 | ||||
| Valuation | Financial Strength | Growth/Profitability | |||
|---|---|---|---|---|---|
| Trailing P/E | 19.86 | Cash | 230M | Revenue Growth | 0.07% |
| Forward P/E | 17.27 | Debt | 609M | Earnings Growth | 0.12% |
| PEG Ratio | N/A | Debt/Equity | 146.82 | Qtr Earnings Growth | 0.13% |
| Price/Sales | 1.00 | Current Ratio | 1.33 | Gross Margin | 0.38% |
| Price/Book | 3.39 | Quick Ratio | 0.48 | Operating Margin | 0.08% |
| EV/Revenue | 1.27 | Operating CF | 115M | Profit Margin | 0.05% |
| EV/EBITDA | 15.10 | Free CF | 79M | EBITDA Margin | 0.08% |
| Ent Value | 1,786M | Return on Assets | 0.03% | ||
| Return on Equity | 0.17% | ||||
| Technical | Volume & Bollinger Bands | Analyst | |||
|---|---|---|---|---|---|
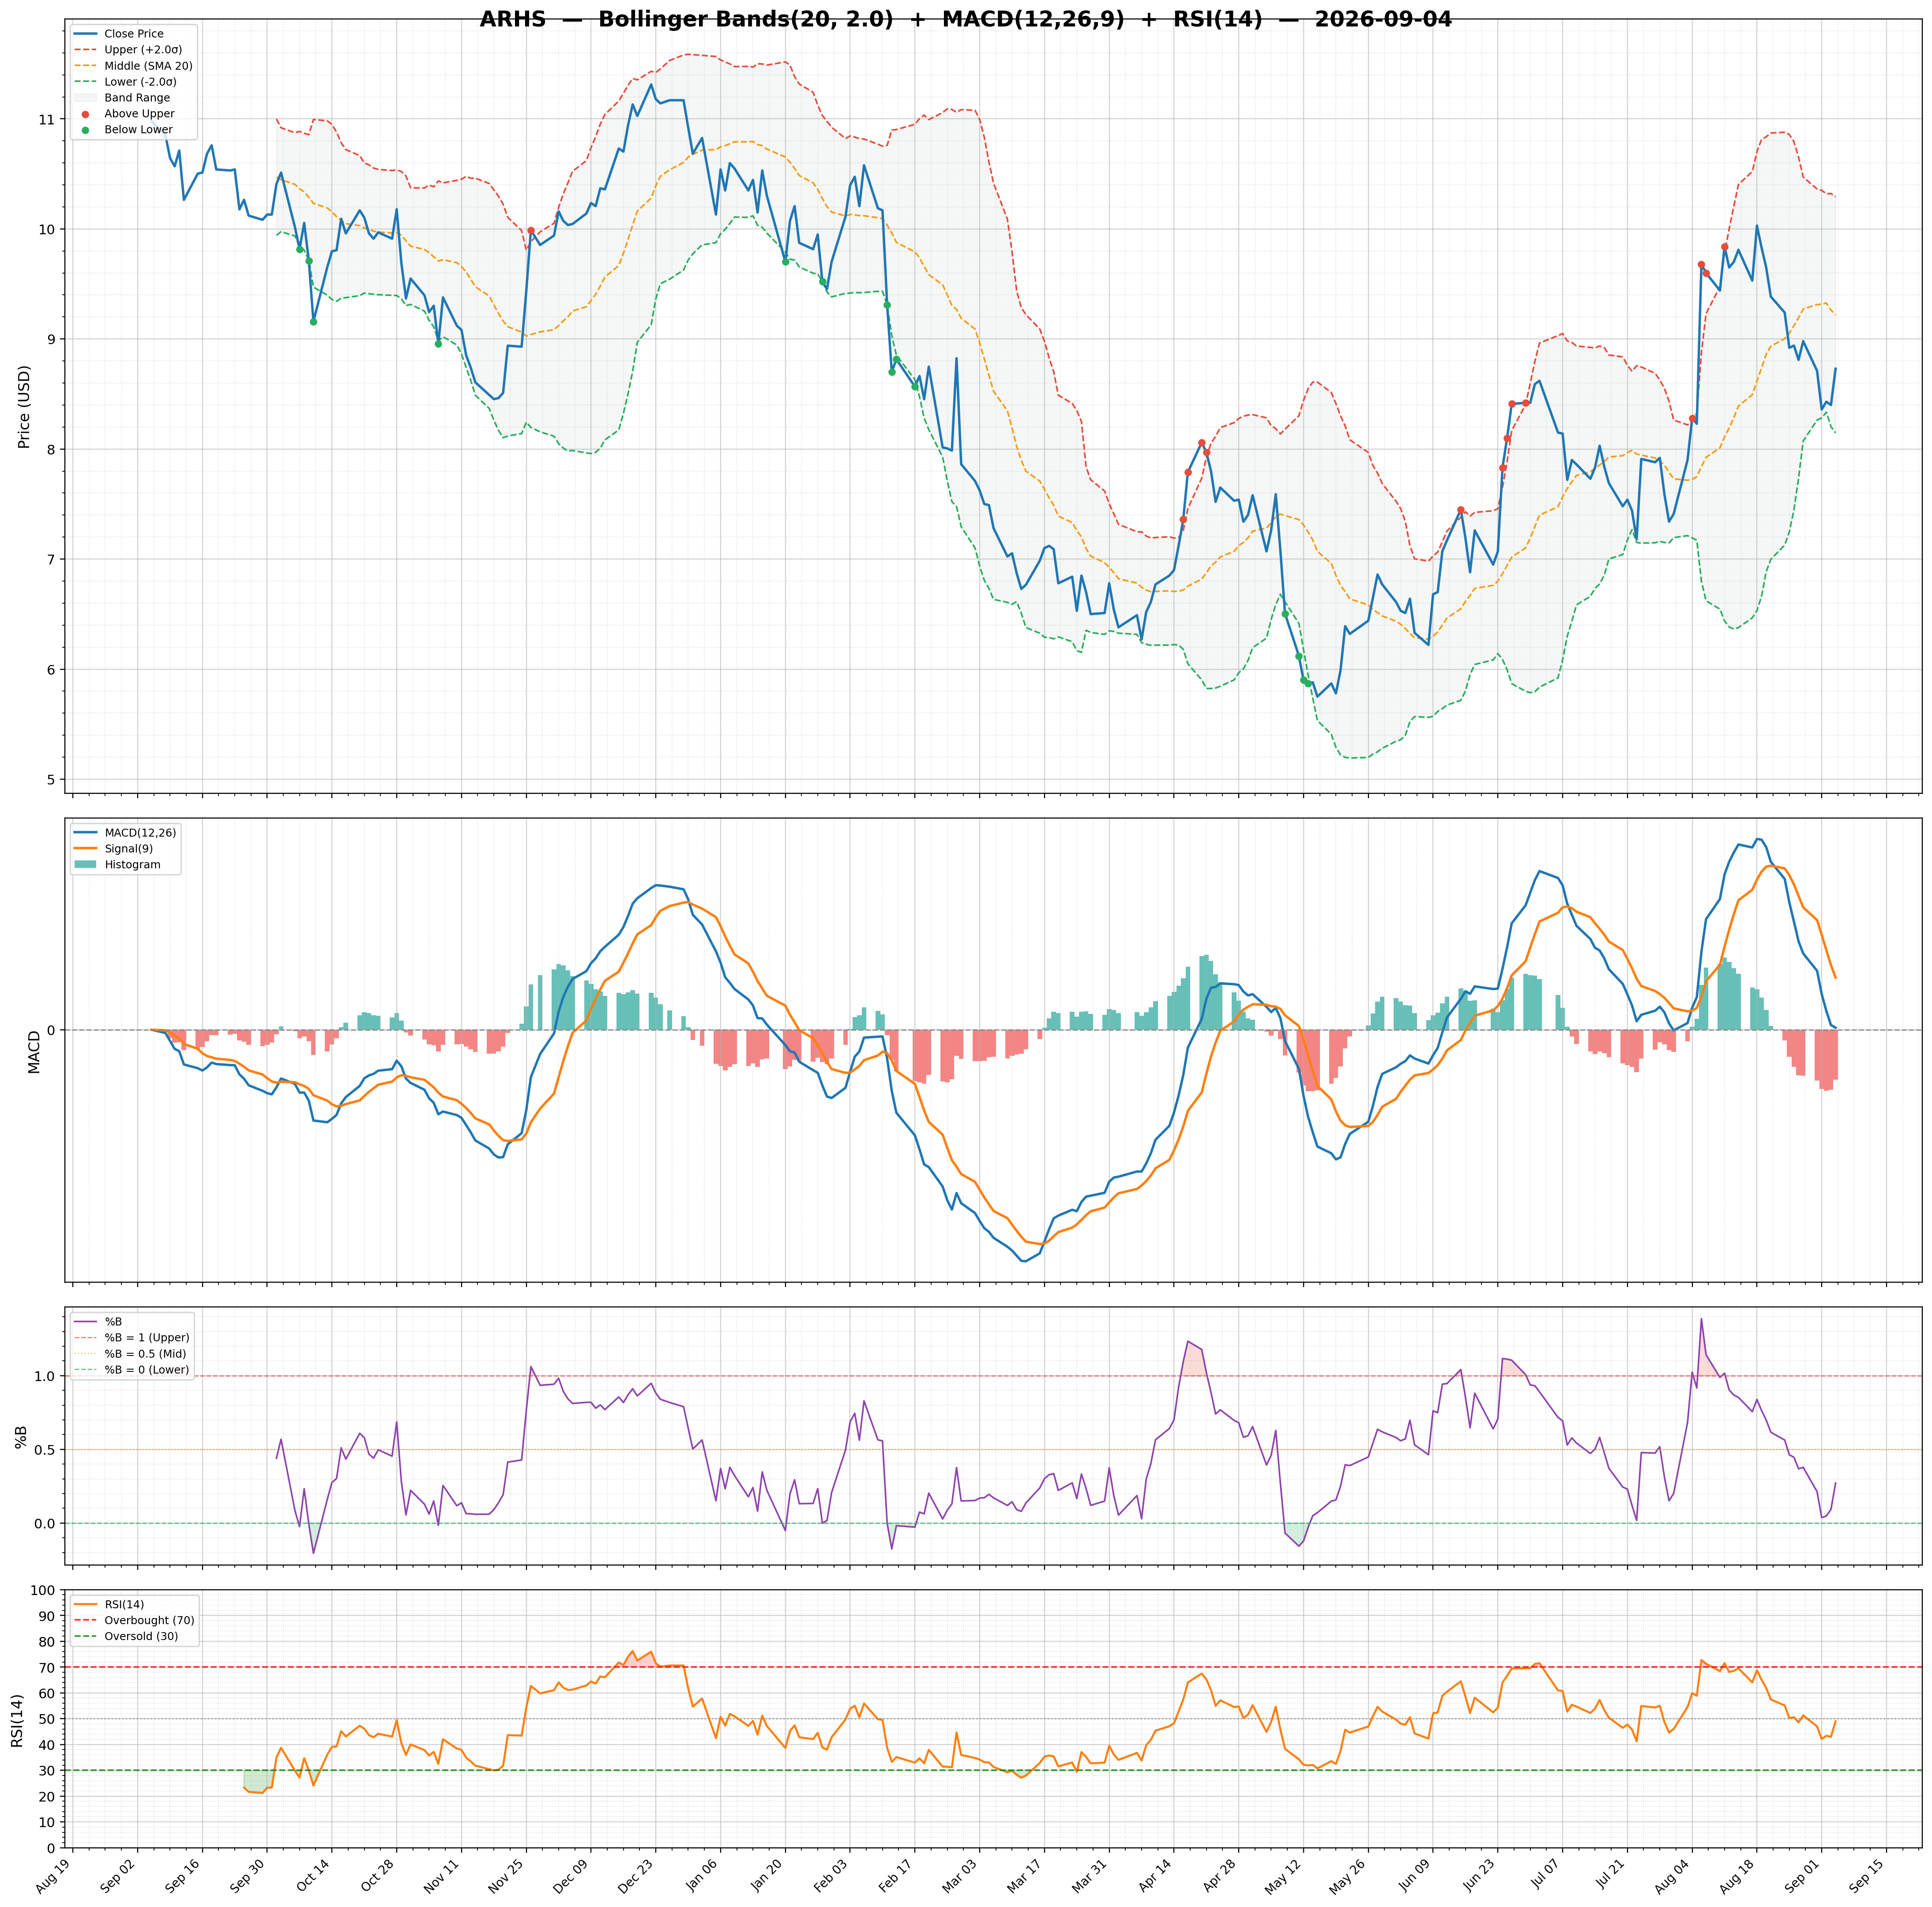
| RSI | 72.52 | Volume | 1.63M | Rating | buy |
| Previous RSI | 68.03 | Avg Volume 20D | 1.72M | Target Mean | $10.85 |
| RSI Trend | Up | Relative Volume | 1.75 | Target High | $13.00 |
| MACD | 0.50 | Lower Band | 8.88 | Target Low | $9.00 |
| MACD Signal | 0.36 | Middle Band | 9.98 | Target Median | $11.00 |
| Histogram | 0.14 | Upper Band | 11.08 | Analysts | 13 |
| Previous Histogram | 0.09 | Bandwidth | 22.140 | Upside | 9.23% |
| Histogram Trend | Increasing | %B | 1.20 | ||