Arq, Inc. (ARQ)
Industrials • Pollution & Treatment Controls • $1.77 • MCap: 78,166,584
https://www.arq.com • Arq, Inc., an environmental technology company, engages in the sale of consumable air, water, and soil treatment solutions based on activated carbon in the United States and Canada. Its products include granular activated carbon, powdered activated carbon, and colloidal carbon products; and additives for air emissions control. The company's products are used in various applications, including water treatment, ground water remediation, soil sediments, air emissions, and asphalt additives. The company was formerly known as Advanced Emissions Solutions, Inc. and changed its name to Arq, Inc. in February 2024. Arq, Inc. was founded in 1997 and is headquartered in Greenwood Village, Colorado.
Ani
| Score | Price | 52 Week & Averages | Relative Strength | Risk | |||||
|---|---|---|---|---|---|---|---|---|---|
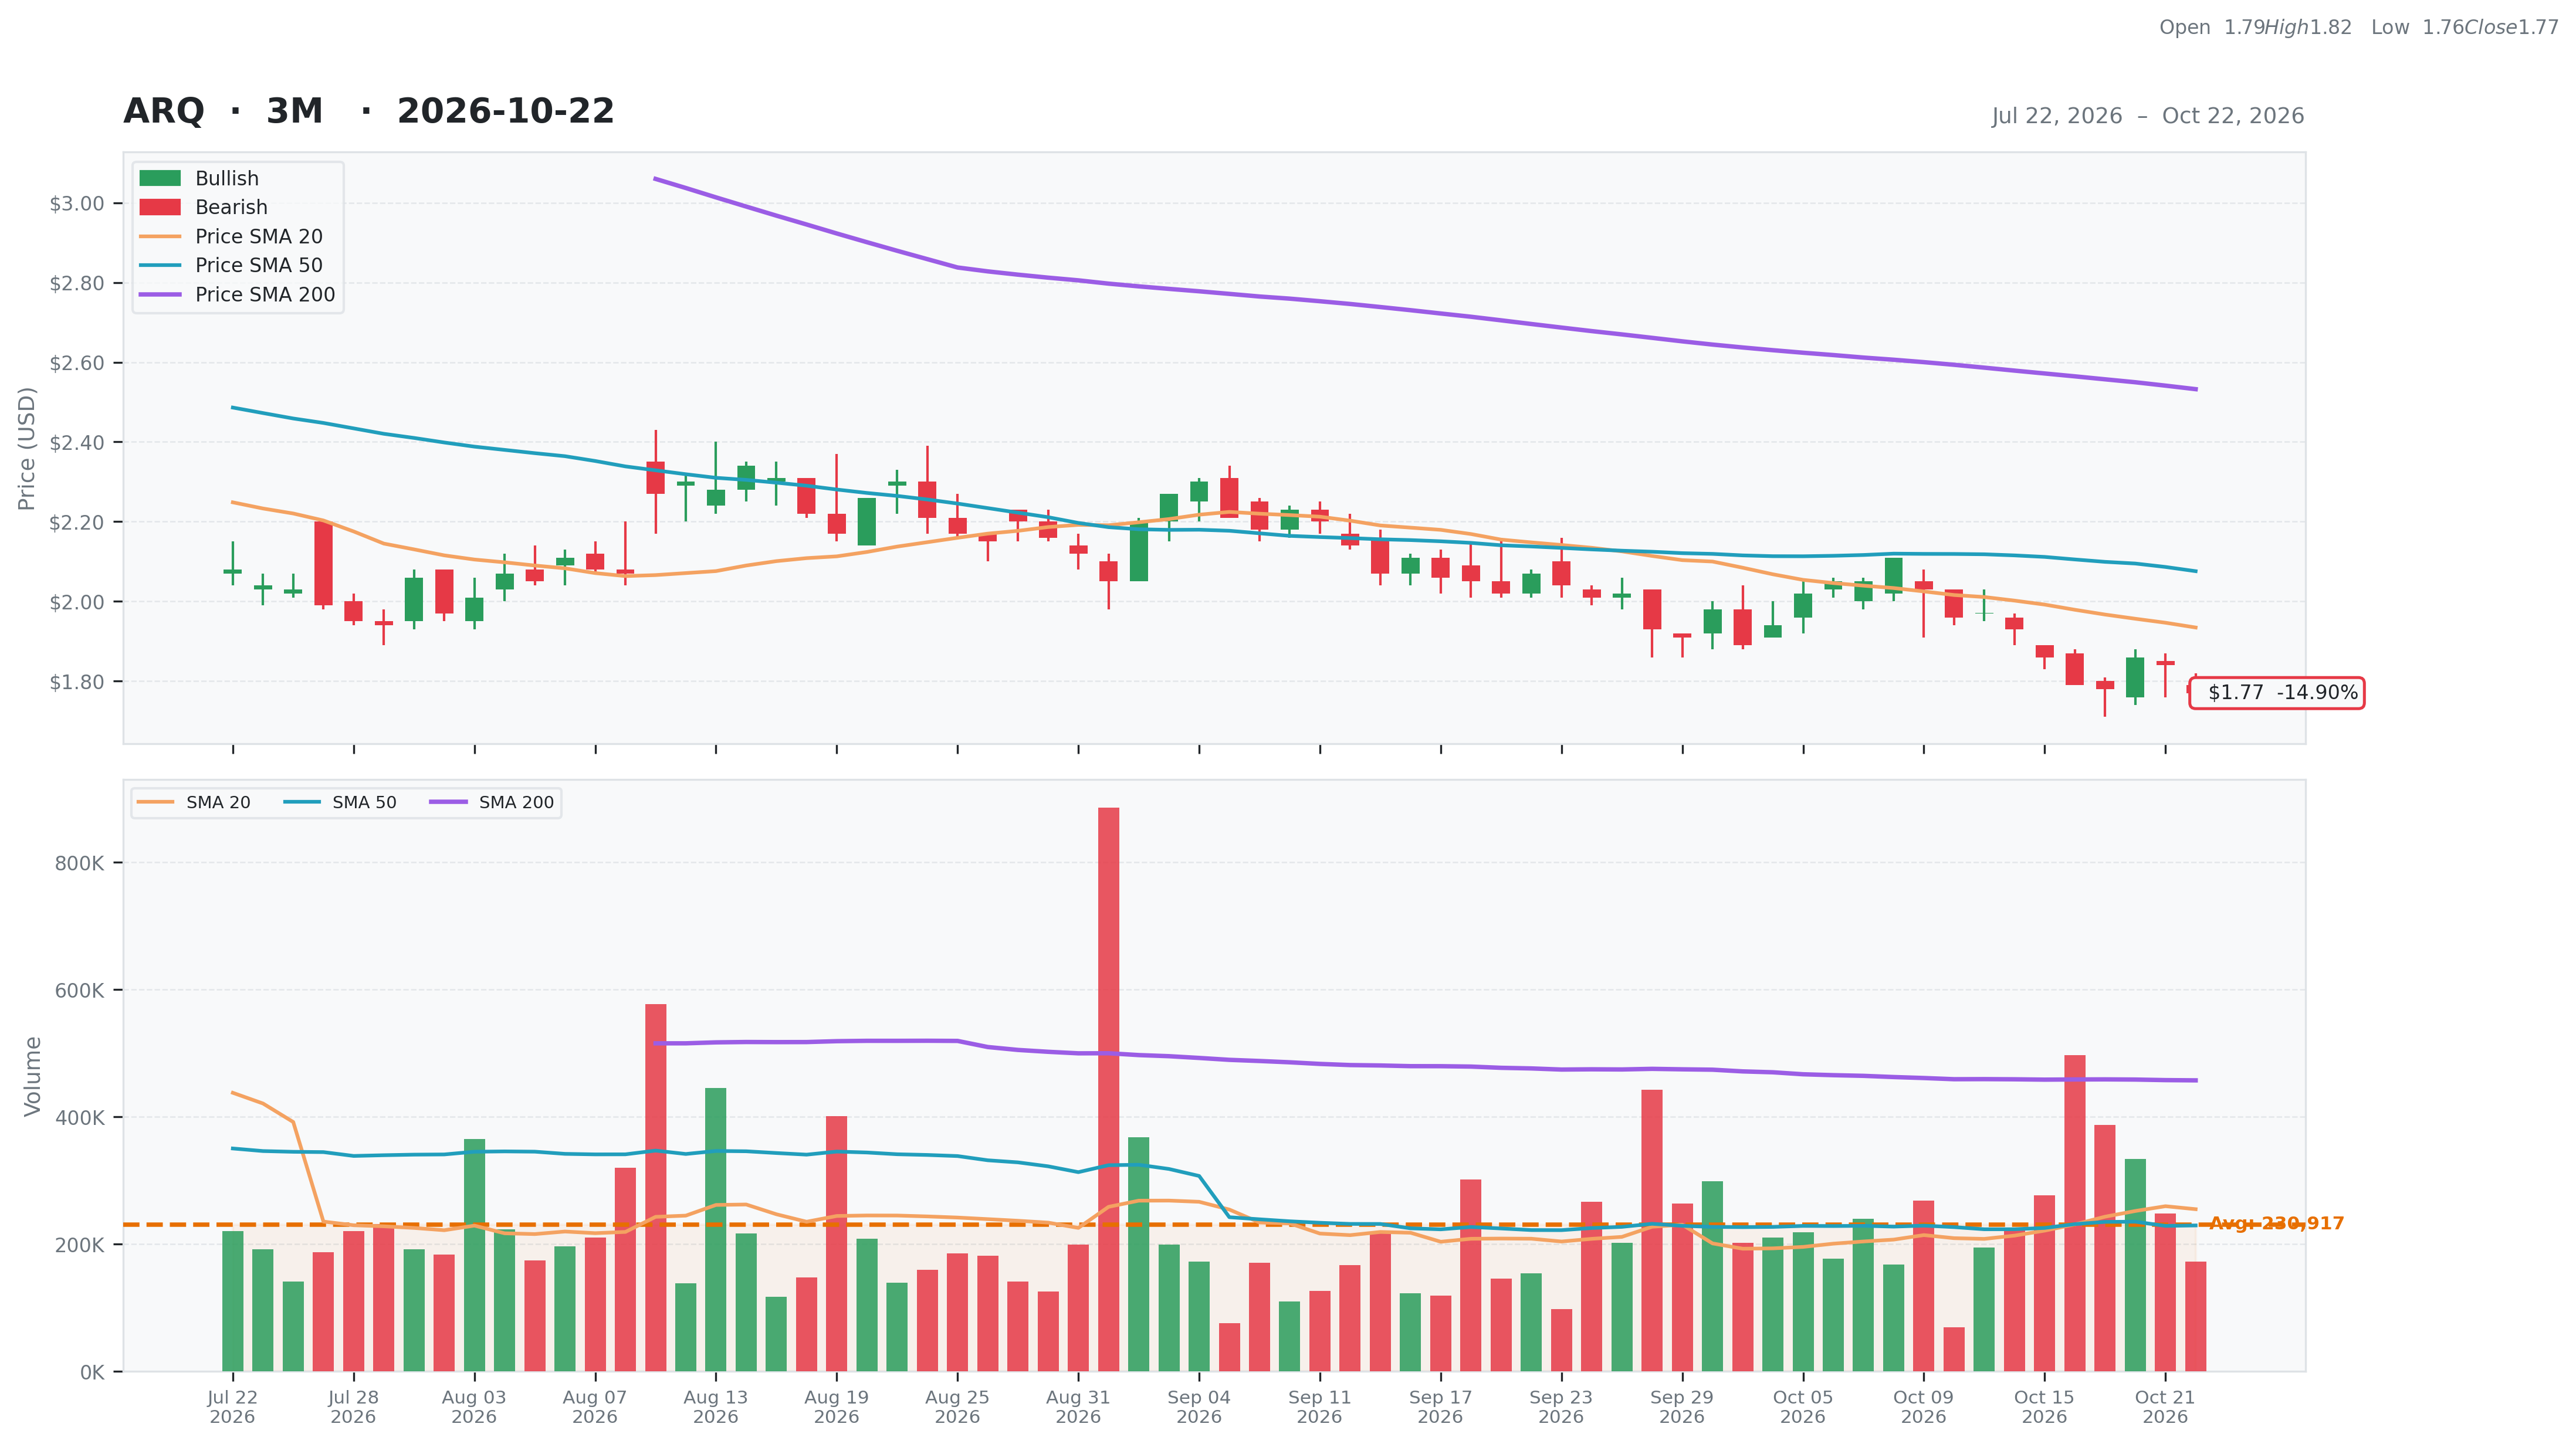
| Total | 26 | Current | $1.77 | 52W High | $6.99 -74.68% | Relative Strength | -0.35 | Beta | 2.87 |
| Business Quality | 4 | Weekly | $1.86 -4.84% | 52W Low | $1.64 7.93% | 3M | -0.13 | Short % | 0.01 |
| Financial Strength | 7 | Monthly | $2.07 -14.49% | Above 50DMA | $2.08 -14.73% | 6M | -0.23 | Risk Score | 3 |
| Growth Outlook | 1 | Quarterly | $2.03 -12.81% | Above 200DMA | $2.53 -30.10% | 9M | -0.53 | ||
| Momentum | 2 | Yearly | $6.94 -74.50% | 12M | -0.75 | ||||
| Valuation | Financial Strength | Growth/Profitability | |||
|---|---|---|---|---|---|
| Trailing P/E | N/A | Cash | 1M | Revenue Growth | 0.04% |
| Forward P/E | 44.75 | Debt | 38M | Earnings Growth | N/A |
| PEG Ratio | 11.75 | Debt/Equity | 22.63 | Qtr Earnings Growth | N/A |
| Price/Sales | 0.63 | Current Ratio | 1.03 | Gross Margin | 0.33% |
| Price/Book | 0.46 | Quick Ratio | 0.46 | Operating Margin | 0.01% |
| EV/Revenue | 0.93 | Operating CF | -0M | Profit Margin | -0.42% |
| EV/EBITDA | 22.60 | Free CF | -0M | EBITDA Margin | 0.04% |
| Ent Value | 115M | Return on Assets | -0.02% | ||
| Return on Equity | -0.27% | ||||
| Technical | Volume & Bollinger Bands | Analyst | |||
|---|---|---|---|---|---|
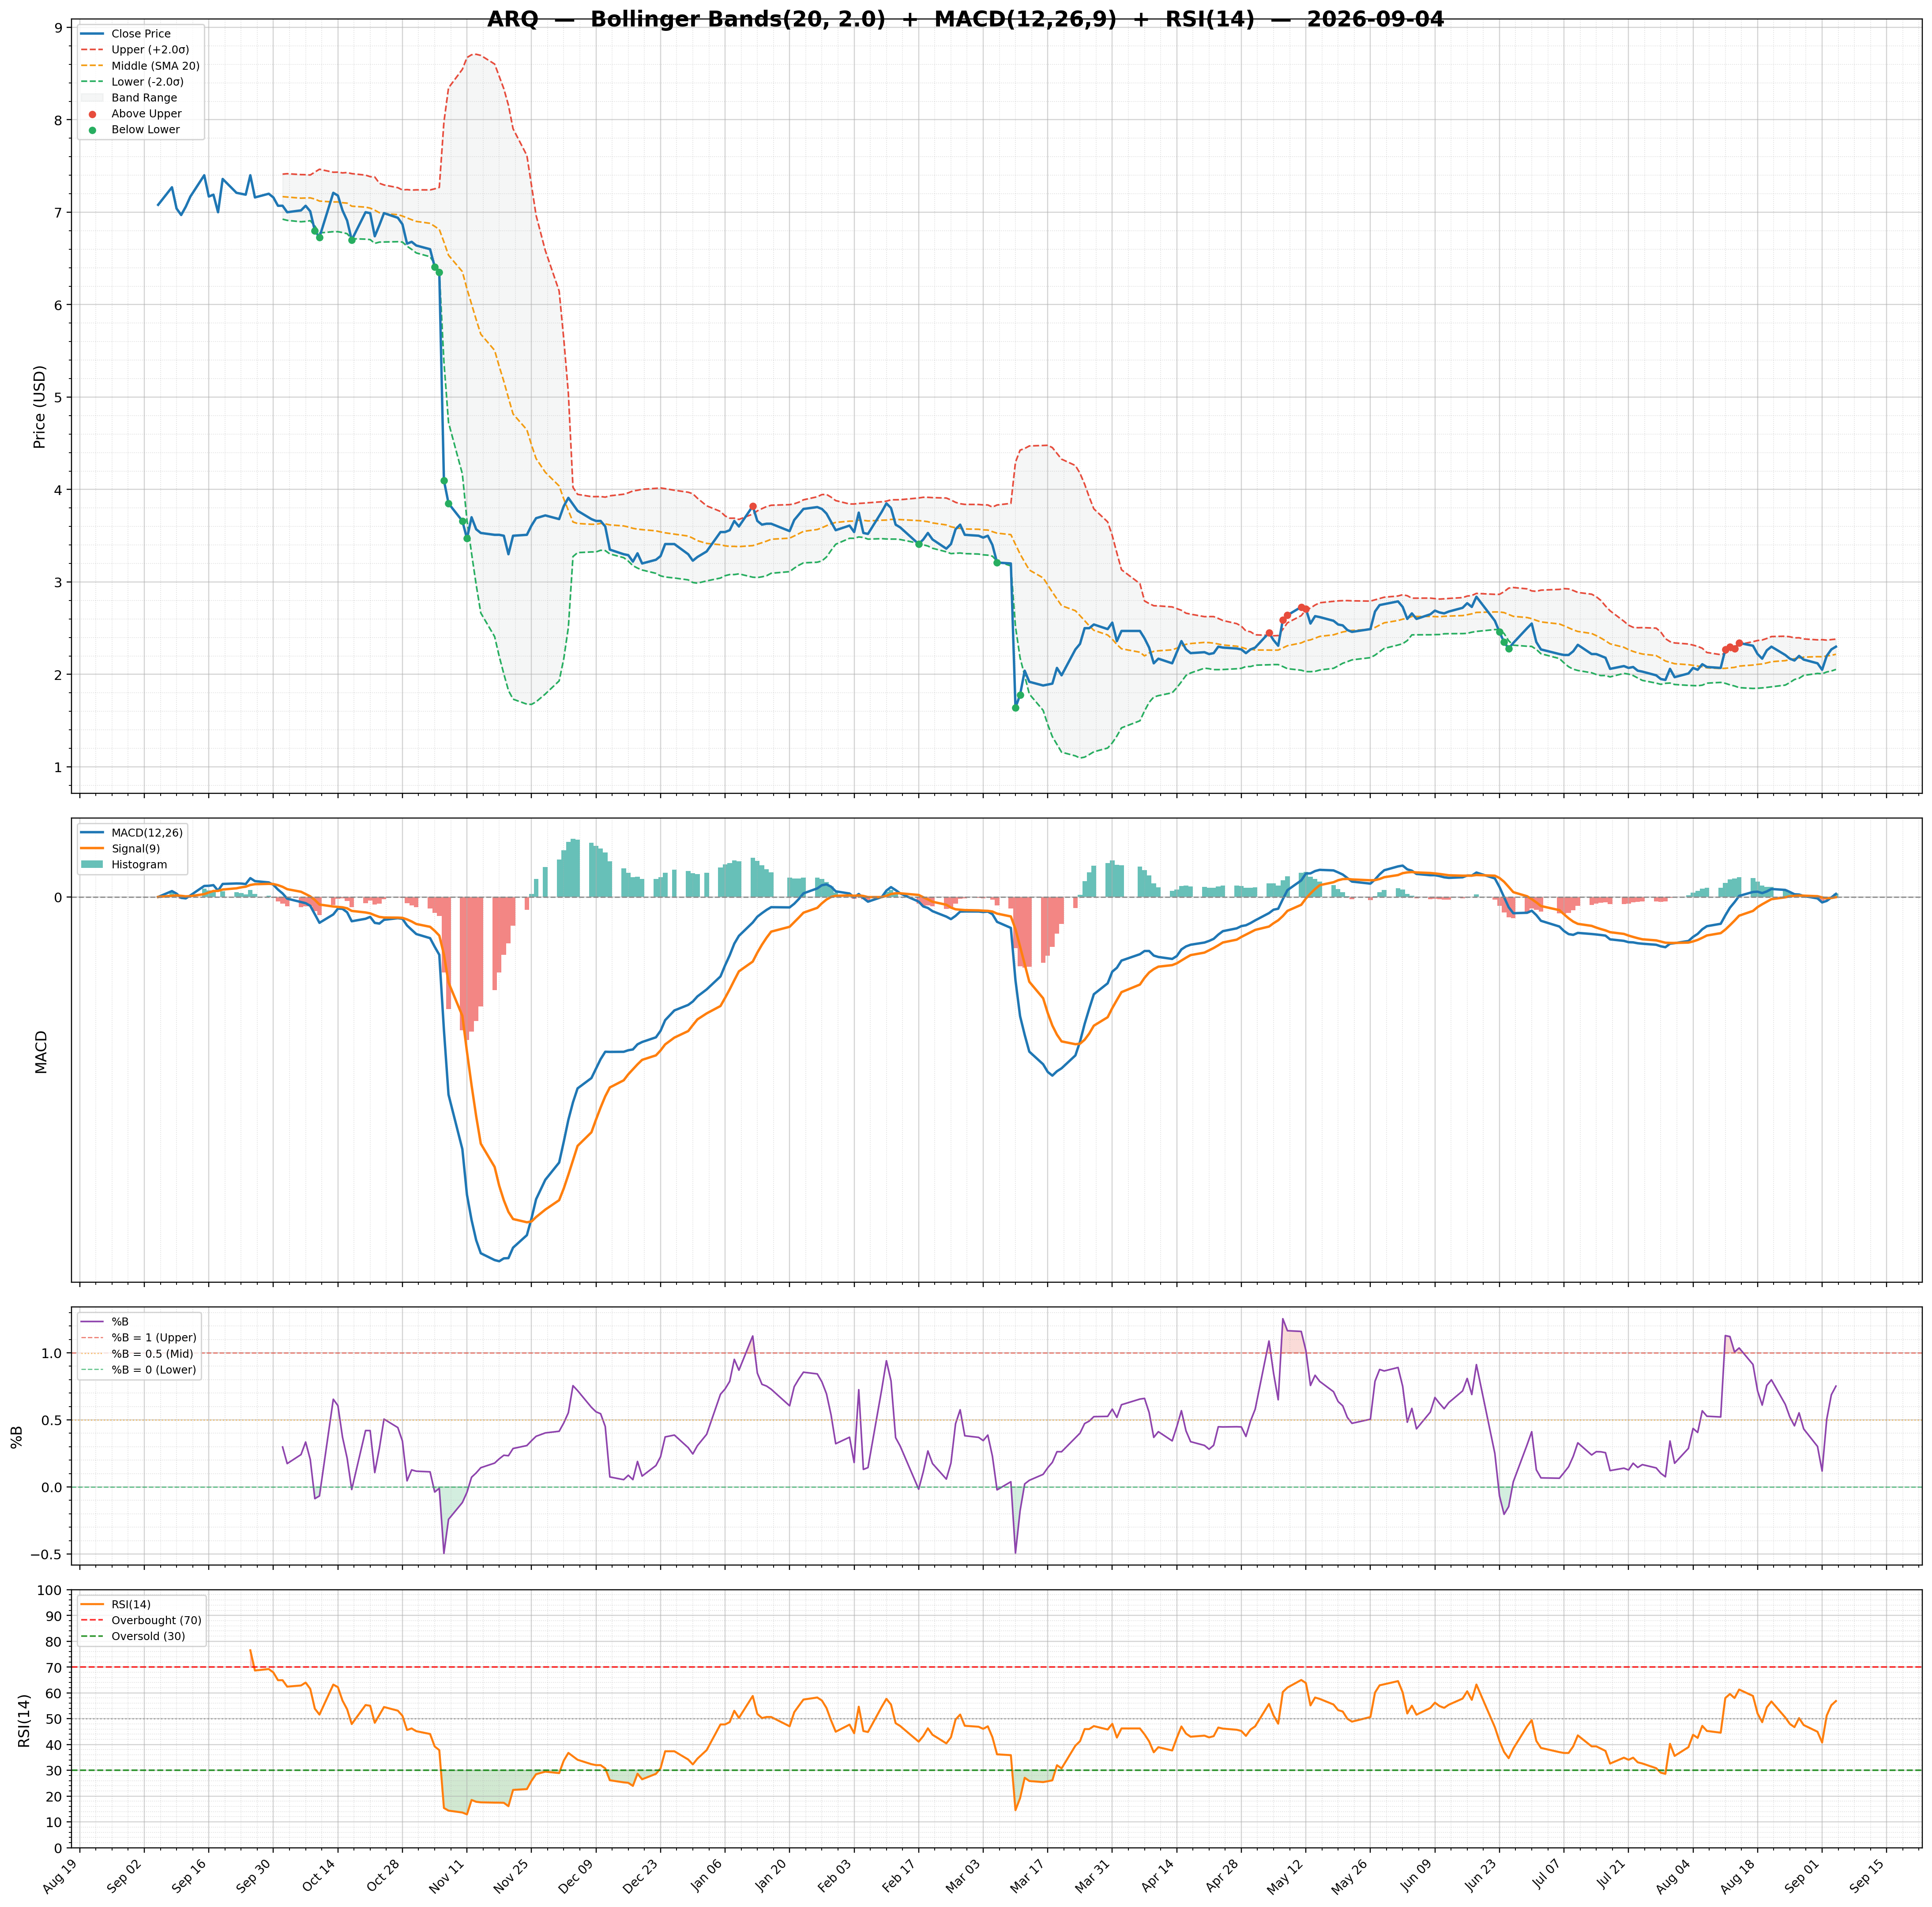
| RSI | 35.57 | Volume | 0.5M | Rating | none |
| Previous RSI | 39.51 | Avg Volume 20D | 0.25M | Target Mean | $4.03 |
| RSI Trend | Down | Relative Volume | 0.76 | Target High | $6.00 |
| MACD | -0.07 | Lower Band | 1.74 | Target Low | $3.10 |
| MACD Signal | -0.06 | Middle Band | 1.93 | Target Median | $3.50 |
| Histogram | -0.01 | Upper Band | 2.13 | Analysts | 4 |
| Previous Histogram | -0.01 | Bandwidth | 20.110 | Upside | 124.86% |
| Histogram Trend | Decreasing | %B | 0.08 | ||