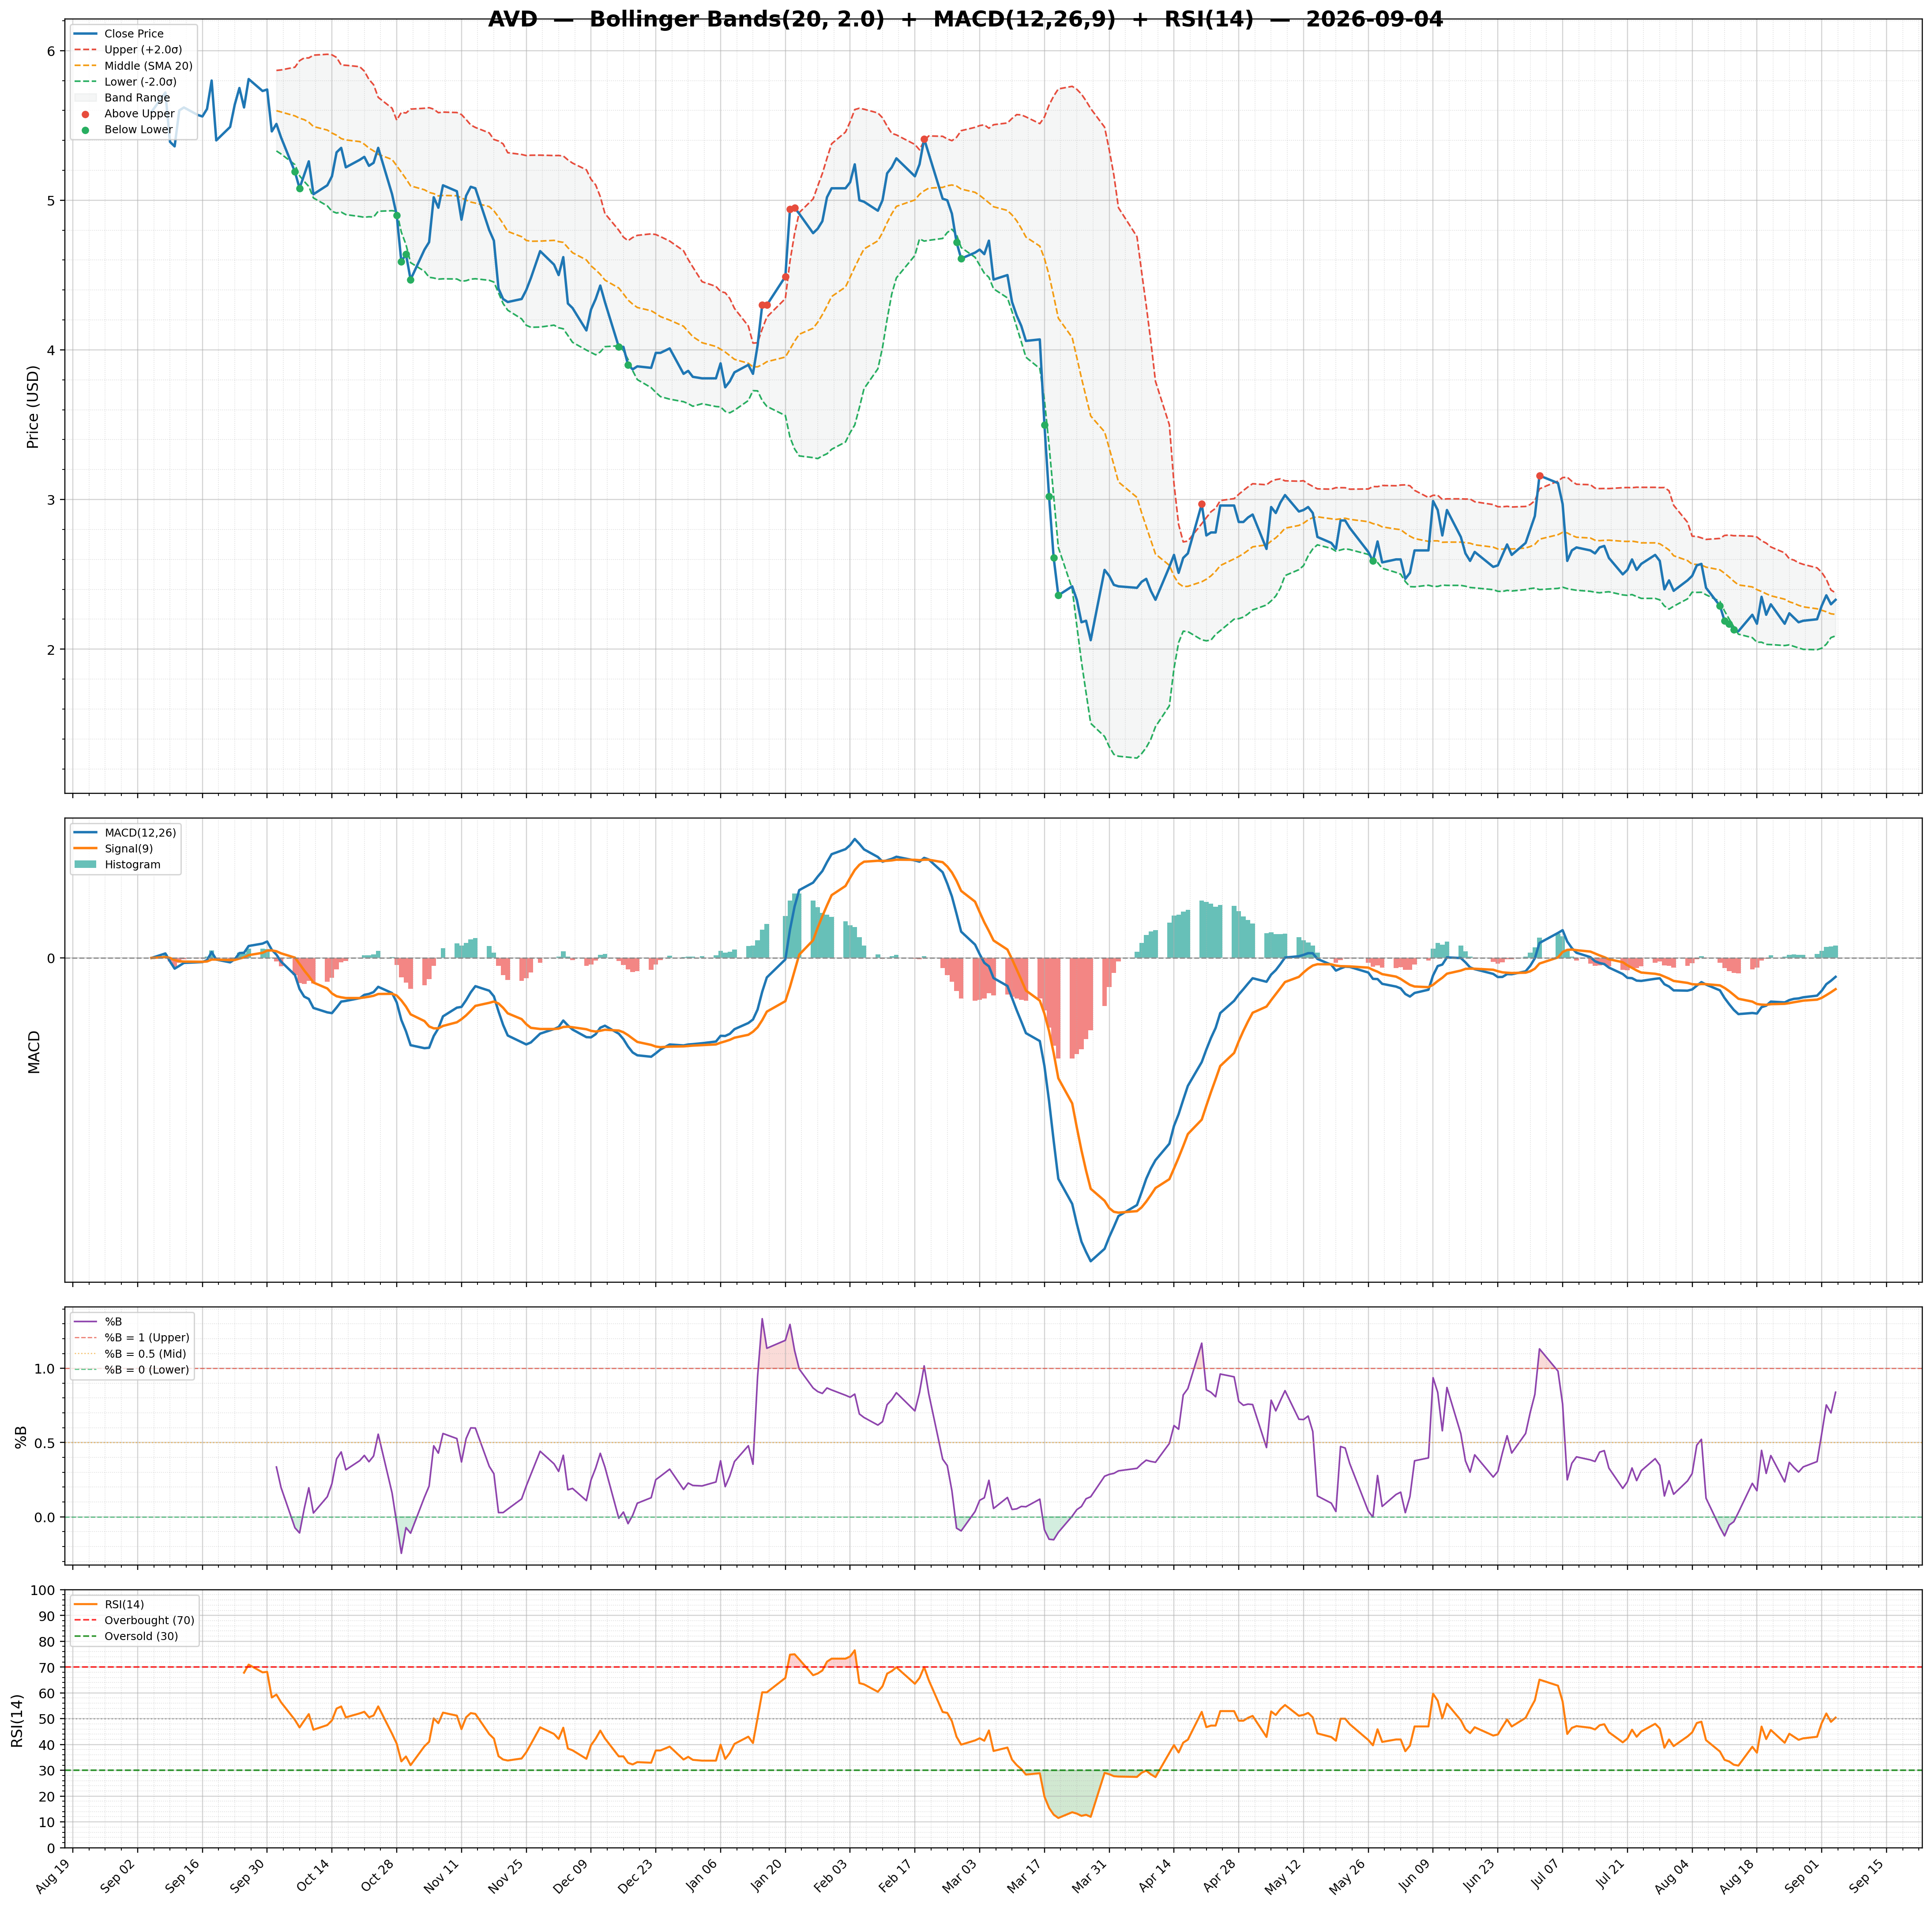
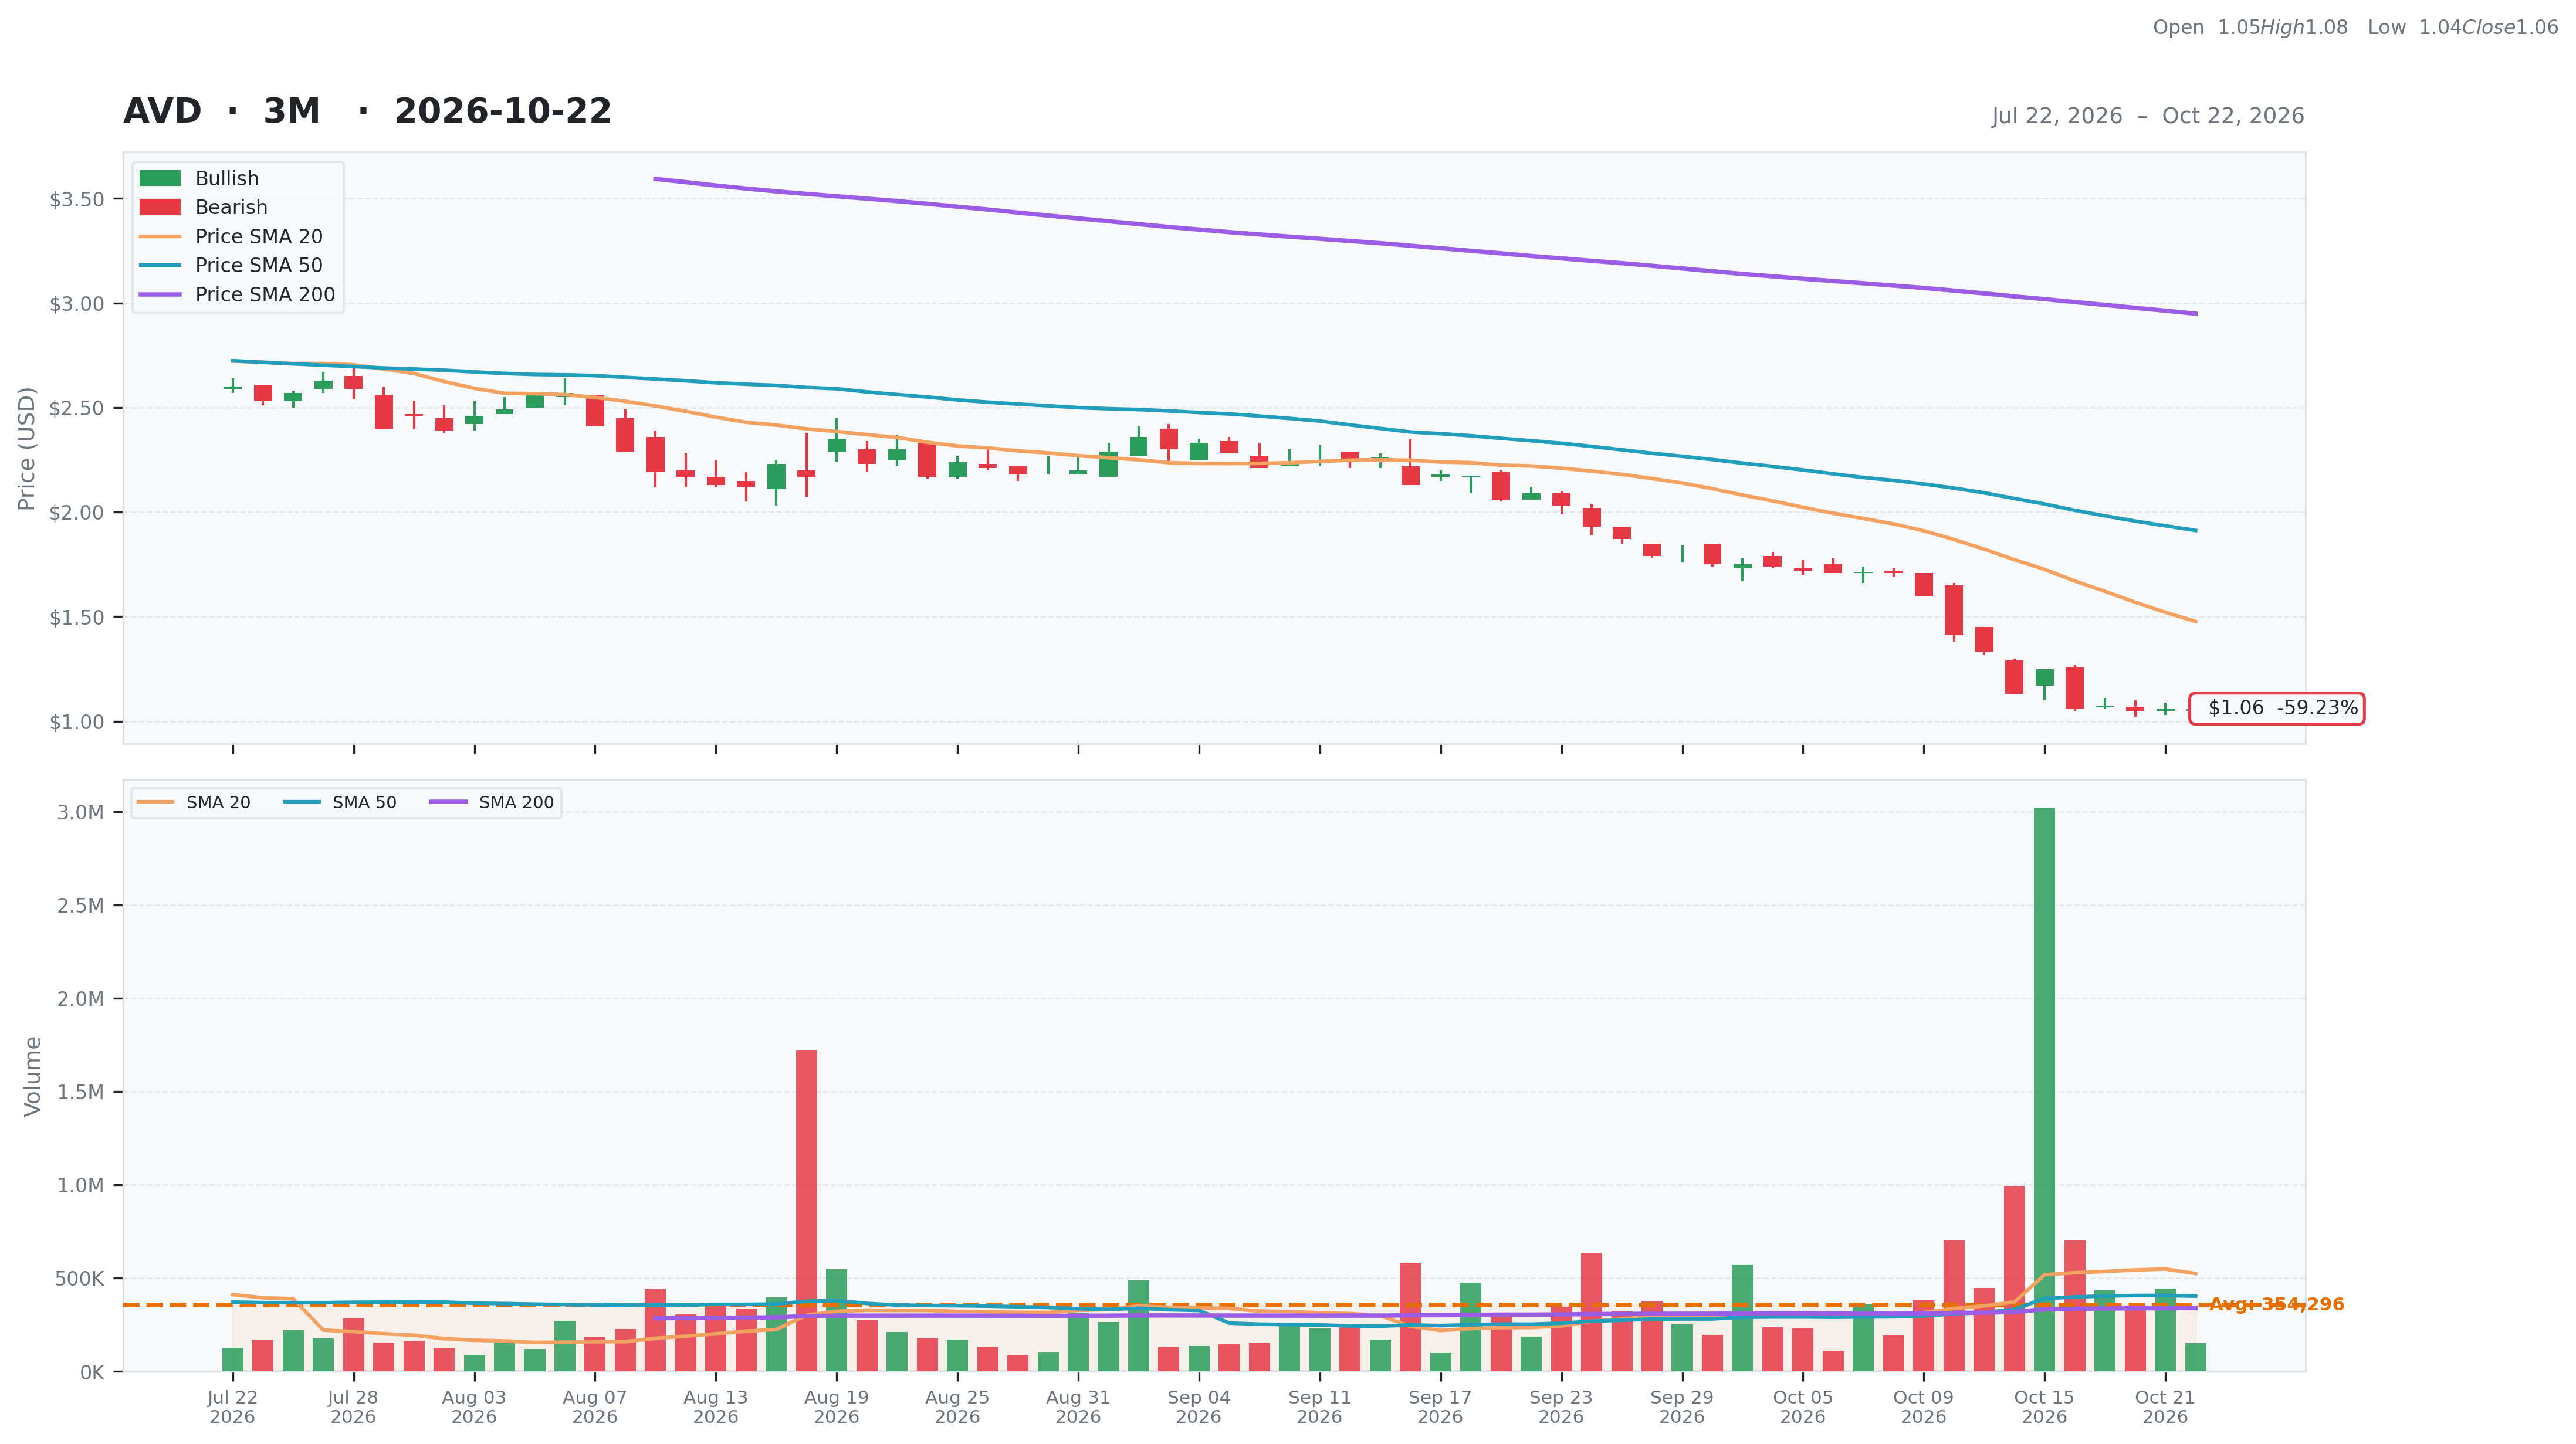
American Vanguard Corporation (AVD)
Basic Materials • Agricultural Inputs • $1.06 • MCap: 31,270,668
https://www.american-vanguard.com • American Vanguard Corporation, through its subsidiaries, develops, manufactures, and markets synthetic, biological, and biorational products for agricultural, commercial, and consumer uses in the United States and internationally. The company synthesizes and formulates chemicals and ferments and extracts microbial products for crops, turf, ornamental plants, and human and animal health protection, such as insecticides, fungicides, herbicides, soil health, plant nutrition, molluscicides, growth regulators, soil fumigants, and biorationals in liquid, powder, and granular forms. It distributes its products through national distribution companies, buying groups, or co-operatives, as well as through sales offices, wholly owned distributors, sales force executives, and sales agents. American Vanguard Corporation was incorporated in 1969 and is headquartered in Newport Beach, California.
Ex-AAII
Joie
ET
Ani
| Score | Price | 52 Week & Averages | Relative Strength | Risk | |||||
|---|---|---|---|---|---|---|---|---|---|
| Total | 31 | Current | $1.06 | 52W High | $5.41 -80.41% | Relative Strength | -0.68 | Beta | 1.50 |
| Business Quality | 4 | Weekly | $1.25 -15.20% | 52W Low | $1.05 0.95% | 3M | -0.59 | Short % | 0.01 |
| Financial Strength | 4 | Monthly | $2.09 -49.28% | Above 50DMA | $1.91 -44.57% | 6M | -0.62 | Risk Score | 3 |
| Growth Outlook | 1 | Quarterly | $2.57 -58.75% | Above 200DMA | $2.95 -64.06% | 9M | -0.79 | ||
| Momentum | 0 | Yearly | $5.04 -78.97% | 12M | -0.80 | ||||
| Valuation | Financial Strength | Growth/Profitability | |||
|---|---|---|---|---|---|
| Trailing P/E | N/A | Cash | 44M | Revenue Growth | -0.10% |
| Forward P/E | N/A | Debt | 284M | Earnings Growth | N/A |
| PEG Ratio | N/A | Debt/Equity | 156.64 | Qtr Earnings Growth | N/A |
| Price/Sales | 0.06 | Current Ratio | 2.48 | Gross Margin | 0.29% |
| Price/Book | 0.17 | Quick Ratio | 1.36 | Operating Margin | 0.01% |
| EV/Revenue | 0.53 | Operating CF | -42M | Profit Margin | -0.11% |
| EV/EBITDA | 10.77 | Free CF | -24M | EBITDA Margin | 0.05% |
| Ent Value | 271M | Return on Assets | 0.01% | ||
| Return on Equity | -0.26% | ||||
| Technical | Volume & Bollinger Bands | Analyst | |||
|---|---|---|---|---|---|
| RSI | 19.10 | Volume | 0.7M | Rating | none |
| Previous RSI | 19.10 | Avg Volume 20D | 0.52M | Target Mean | N/A |
| RSI Trend | Down | Relative Volume | 0.33 | Target High | N/A |
| MACD | -0.27 | Lower Band | 0.85 | Target Low | N/A |
| MACD Signal | -0.24 | Middle Band | 1.48 | Target Median | N/A |
| Histogram | -0.03 | Upper Band | 2.10 | Analysts | N/A |
| Previous Histogram | -0.04 | Bandwidth | 84.760 | Upside | N/A |
| Histogram Trend | Increasing | %B | 0.17 | ||