Alibaba Group Holding Limited (BABA)
Consumer Cyclical • Internet Retail • $101.82 • MCap: 271,437,856,768
https://www.alibabagroup.com • Alibaba Group Holding Limited, through its subsidiaries, provides technology infrastructure and marketing reach to help merchants, brands, retailers, and other businesses in the People's Republic of China and internationally. It operates through the Alibaba China E-Commerce Group, Alibaba International Digital Commerce Group, Cloud Intelligence Group, and All Others segments. The Alibaba China E-commerce Group segment operates Taobao and Tmall, which are digital retail platforms; Taobao Instant Commerce, a local services and on-demand delivery platform; 1688.com, a domestic wholesale marketplace; and Xianyu, a consumer-to-consumer community and marketplace for idle goods. Its Alibaba International Digital Commerce Group segment includes AliExpress, a global e-commerce platform; Trendyol, an e-commerce platform in Turkey; Lazada, an e-commerce platform in Southeast Asia; Daraz, an e-commerce platform in South Asia, primarily in Pakistan and Bangladesh; and Alibaba.com, an integrated international online wholesale marketplace. The Cloud Intelligence Group segment offers a suite of cloud services based on infrastructure-as-a-service, platform-as-a-service, and model-as-a-service. Its All Others segment comprises Amap, a provider of mobile digital maps, navigation, and real-time traffic information in China; Cainiao, which provides logistics solutions; Youku, an online long-form video platform in China; Freshippo, a retail platform for groceries and fresh goods; and Alibaba Health, a pharmaceutical and healthcare services platform. Alibaba Group Holding Limited was incorporated in 1999 and is based in Hangzhou, China.
Joie
| Score | Price | 52 Week & Averages | Relative Strength | Risk | |||||
|---|---|---|---|---|---|---|---|---|---|
| Total | 51 | Current | $101.82 | 52W High | $178.33 -42.90% | Relative Strength | -0.25 | Beta | 0.46 |
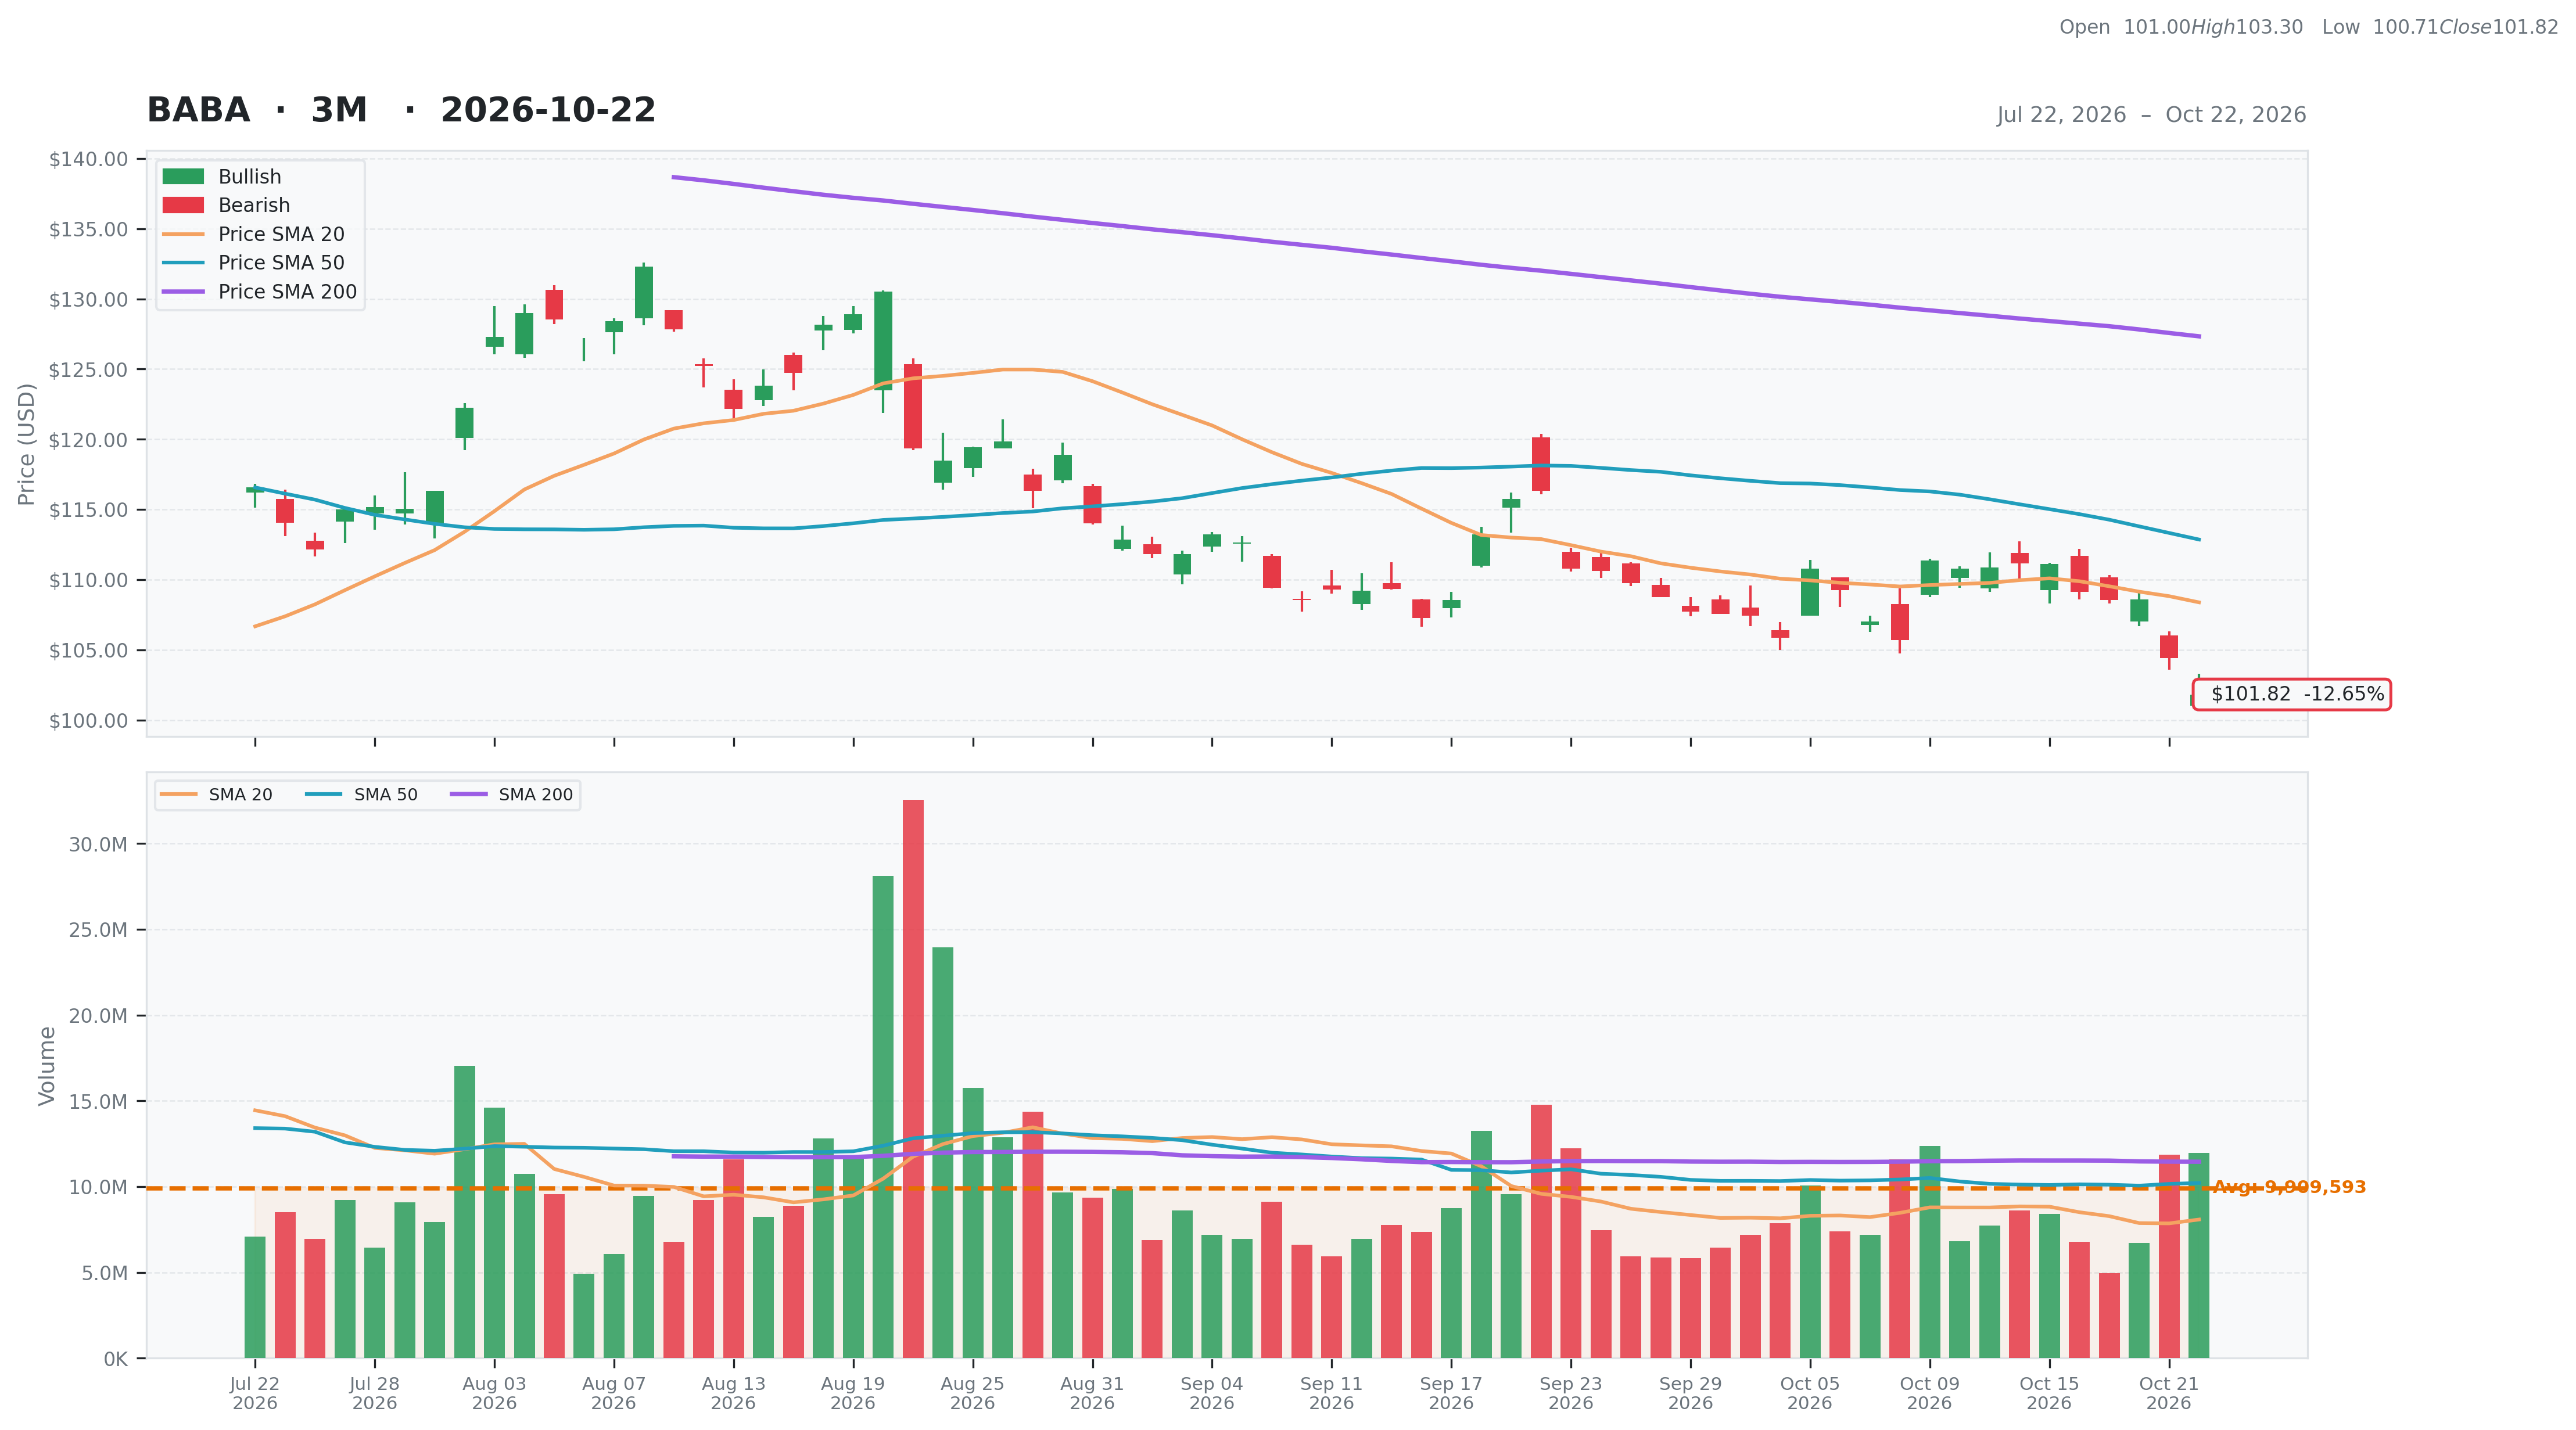
| Business Quality | 11 | Weekly | $111.13 -8.38% | 52W Low | $94.81 7.39% | 3M | -0.09 | Short % | 0.02 |
| Financial Strength | 9 | Monthly | $116.31 -12.46% | Above 50DMA | $112.86 -9.78% | 6M | -0.22 | Risk Score | |
| Growth Outlook | 4 | Quarterly | $112.14 -9.20% | Above 200DMA | $127.33 -20.04% | 9M | -0.42 | ||
| Momentum | 3 | Yearly | $177.82 -42.74% | 12M | -0.41 | ||||
| Valuation | Financial Strength | Growth/Profitability | |||
|---|---|---|---|---|---|
| Trailing P/E | 26.42 | Cash | 385,697M | Revenue Growth | 0.09% |
| Forward P/E | 11.77 | Debt | 266,530M | Earnings Growth | -0.79% |
| PEG Ratio | 0.51 | Debt/Equity | 23.93 | Qtr Earnings Growth | -0.74% |
| Price/Sales | 0.26 | Current Ratio | 1.36 | Gross Margin | 0.38% |
| Price/Book | 1.62 | Quick Ratio | 0.72 | Operating Margin | 0.07% |
| EV/Revenue | 0.19 | Operating CF | 78,486M | Profit Margin | 0.07% |
| EV/EBITDA | 2.01 | Free CF | -82,644M | EBITDA Margin | 0.10% |
| Ent Value | 200,338M | Return on Assets | 0.02% | ||
| Return on Equity | 0.06% | ||||
| Technical | Volume & Bollinger Bands | Analyst | |||
|---|---|---|---|---|---|
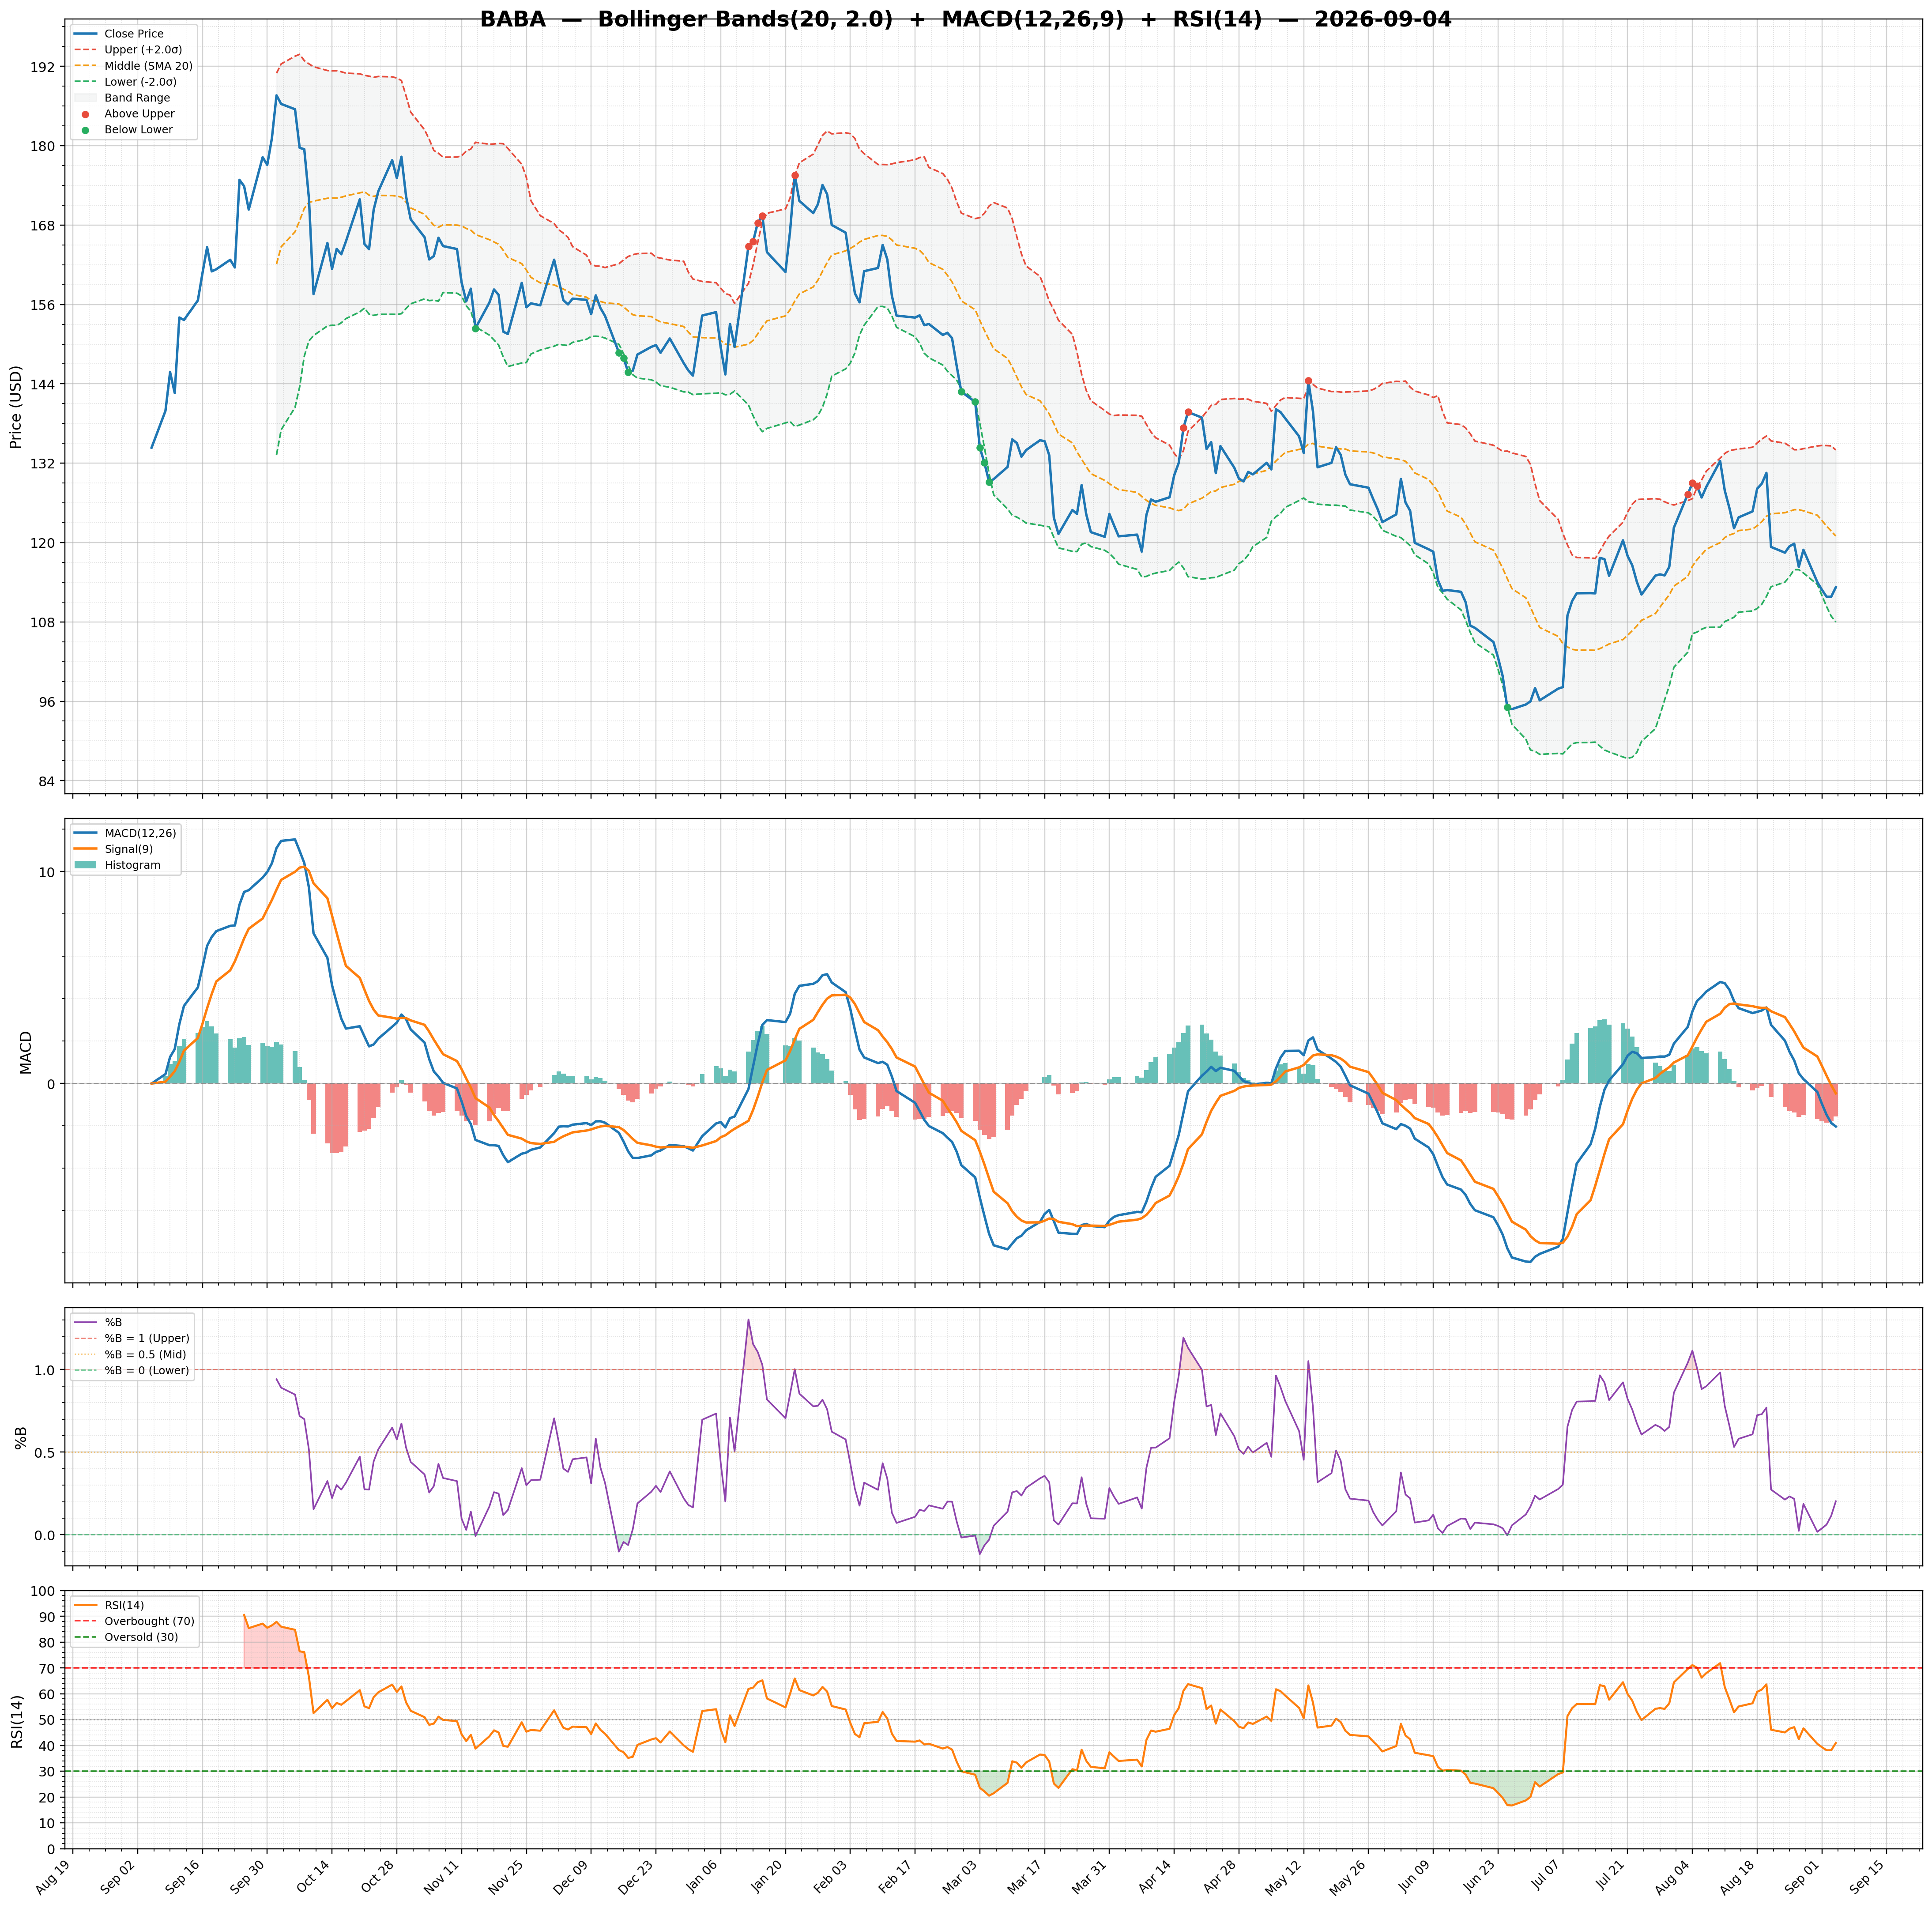
| RSI | 32.87 | Volume | 6.62M | Rating | strong_buy |
| Previous RSI | 36.86 | Avg Volume 20D | 8.08M | Target Mean | $186.62 |
| RSI Trend | Down | Relative Volume | 1.40 | Target High | $239.38 |
| MACD | -1.68 | Lower Band | 103.32 | Target Low | $95.66 |
| MACD Signal | -1.27 | Middle Band | 108.38 | Target Median | $188.84 |
| Histogram | -0.40 | Upper Band | 113.44 | Analysts | 40 |
| Previous Histogram | -0.04 | Bandwidth | 9.340 | Upside | 71.04% |
| Histogram Trend | Decreasing | %B | -0.15 | ||