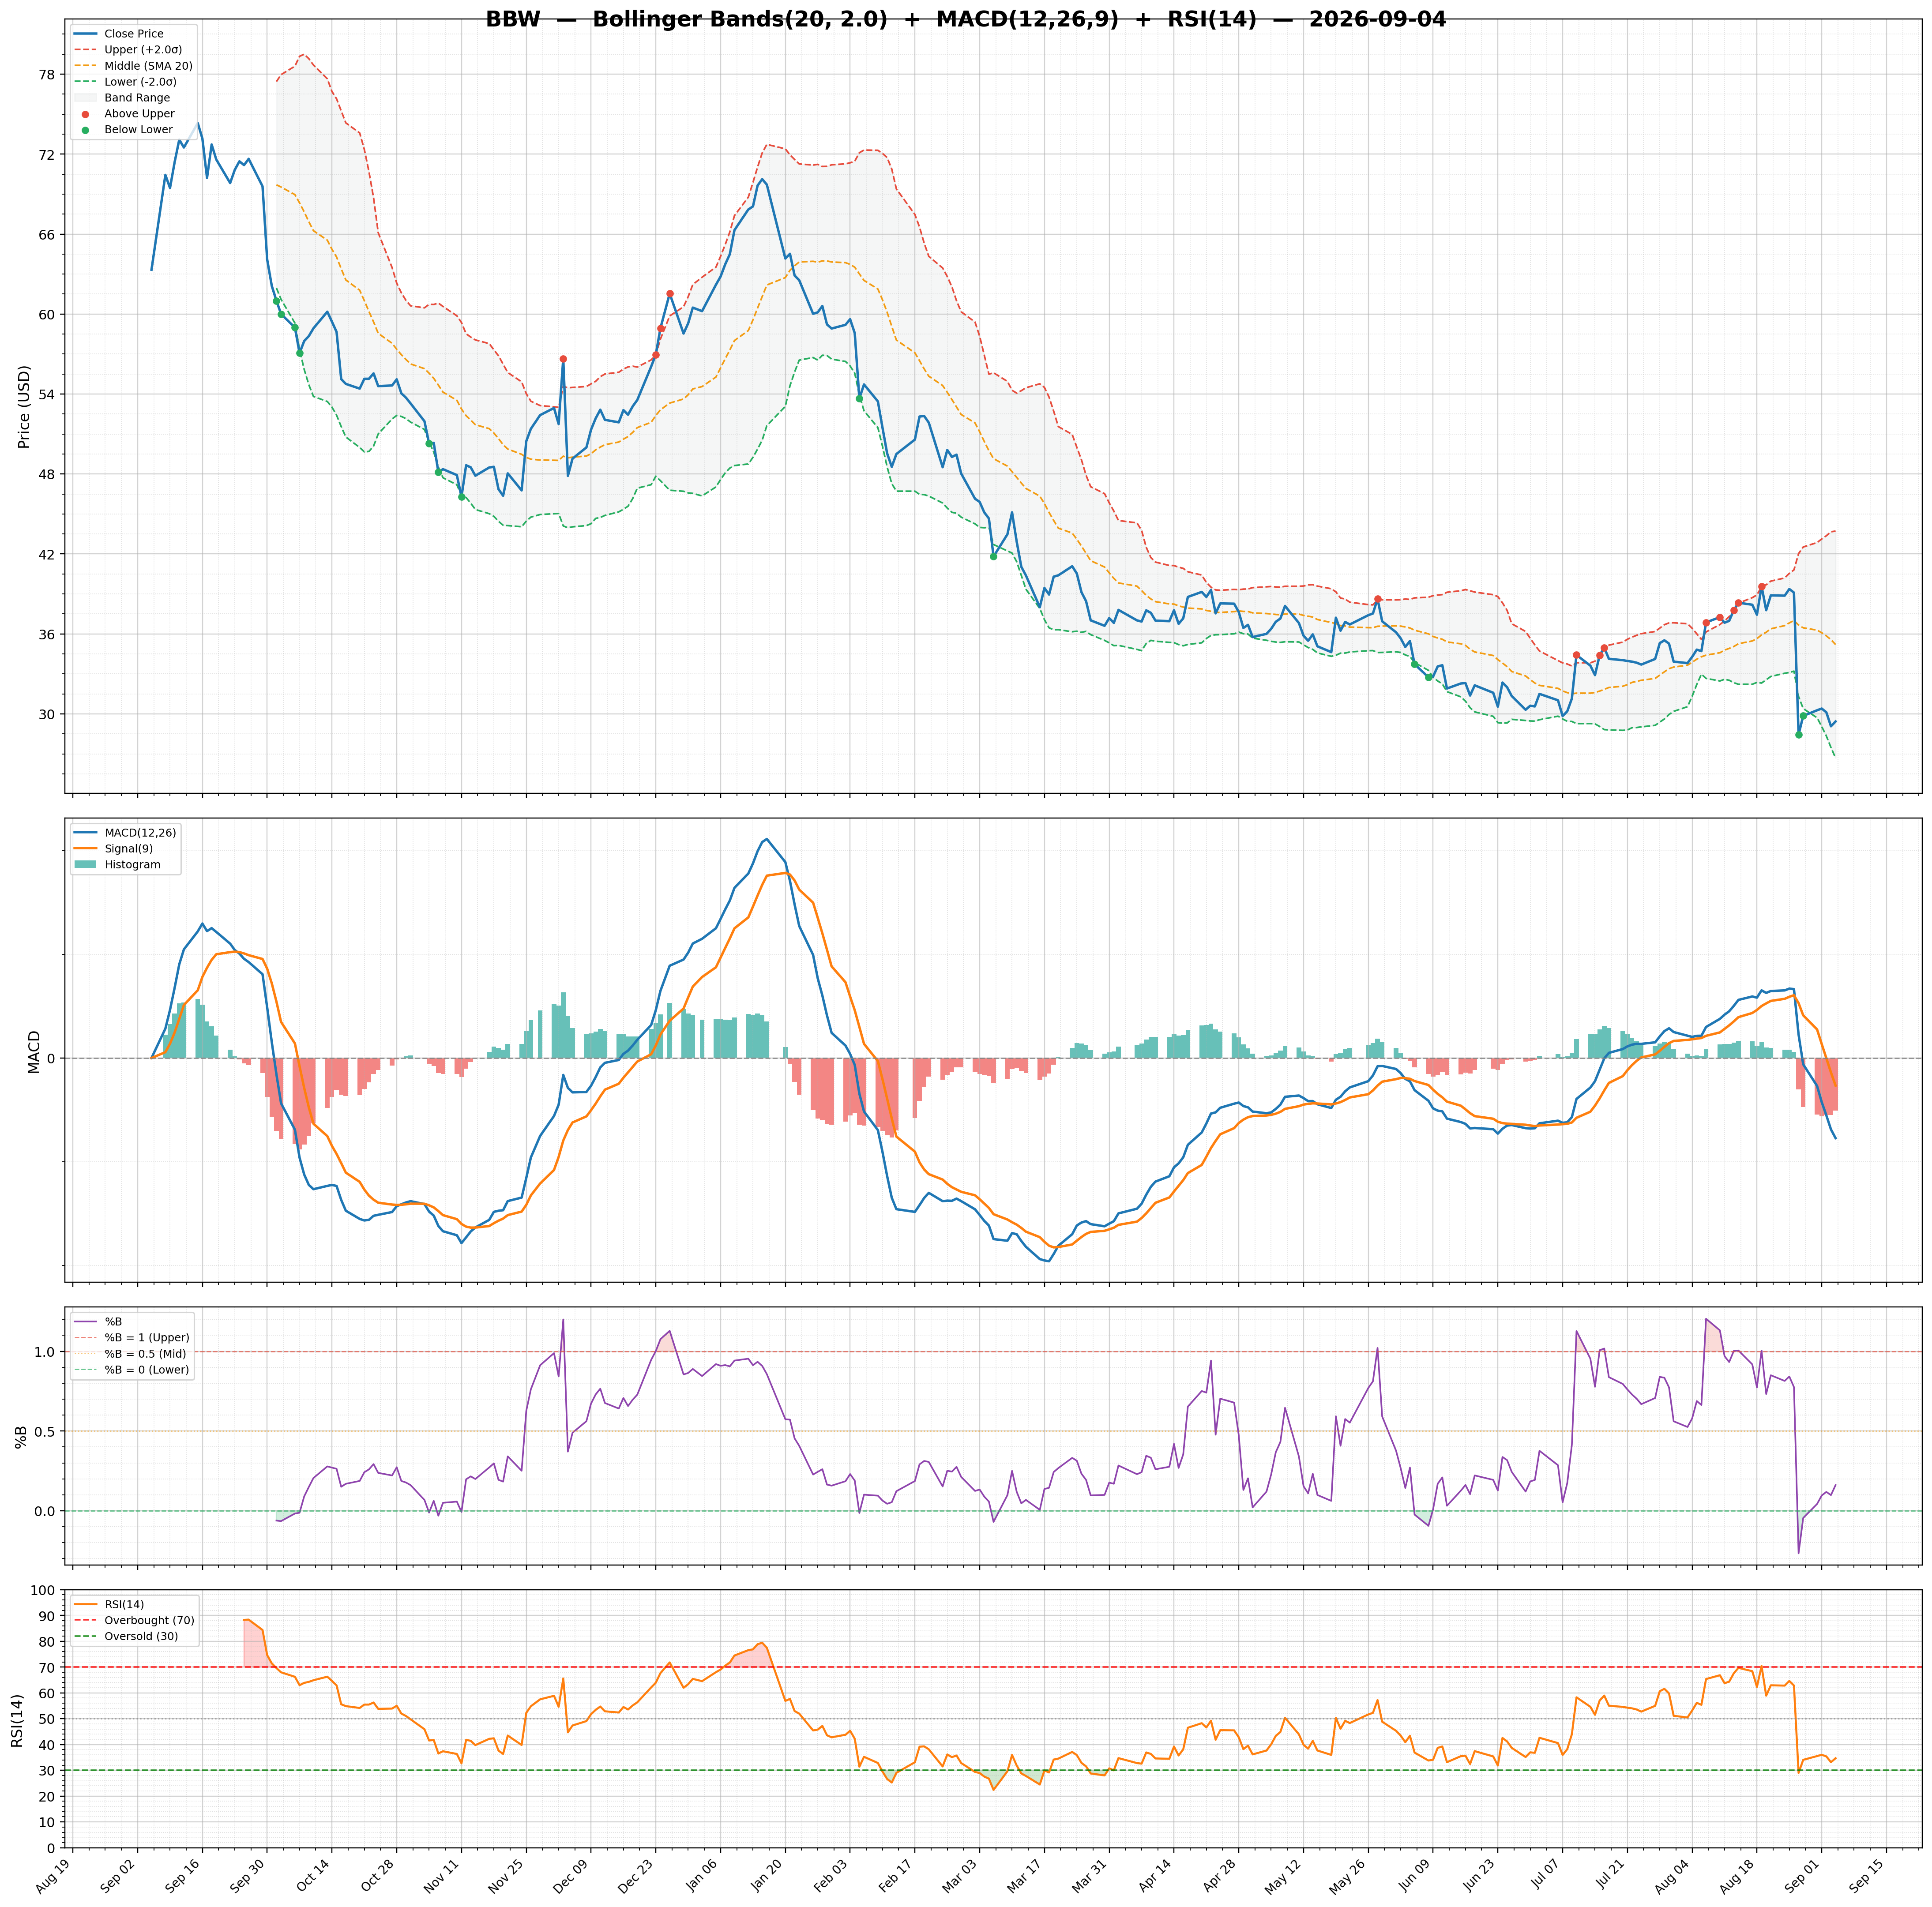
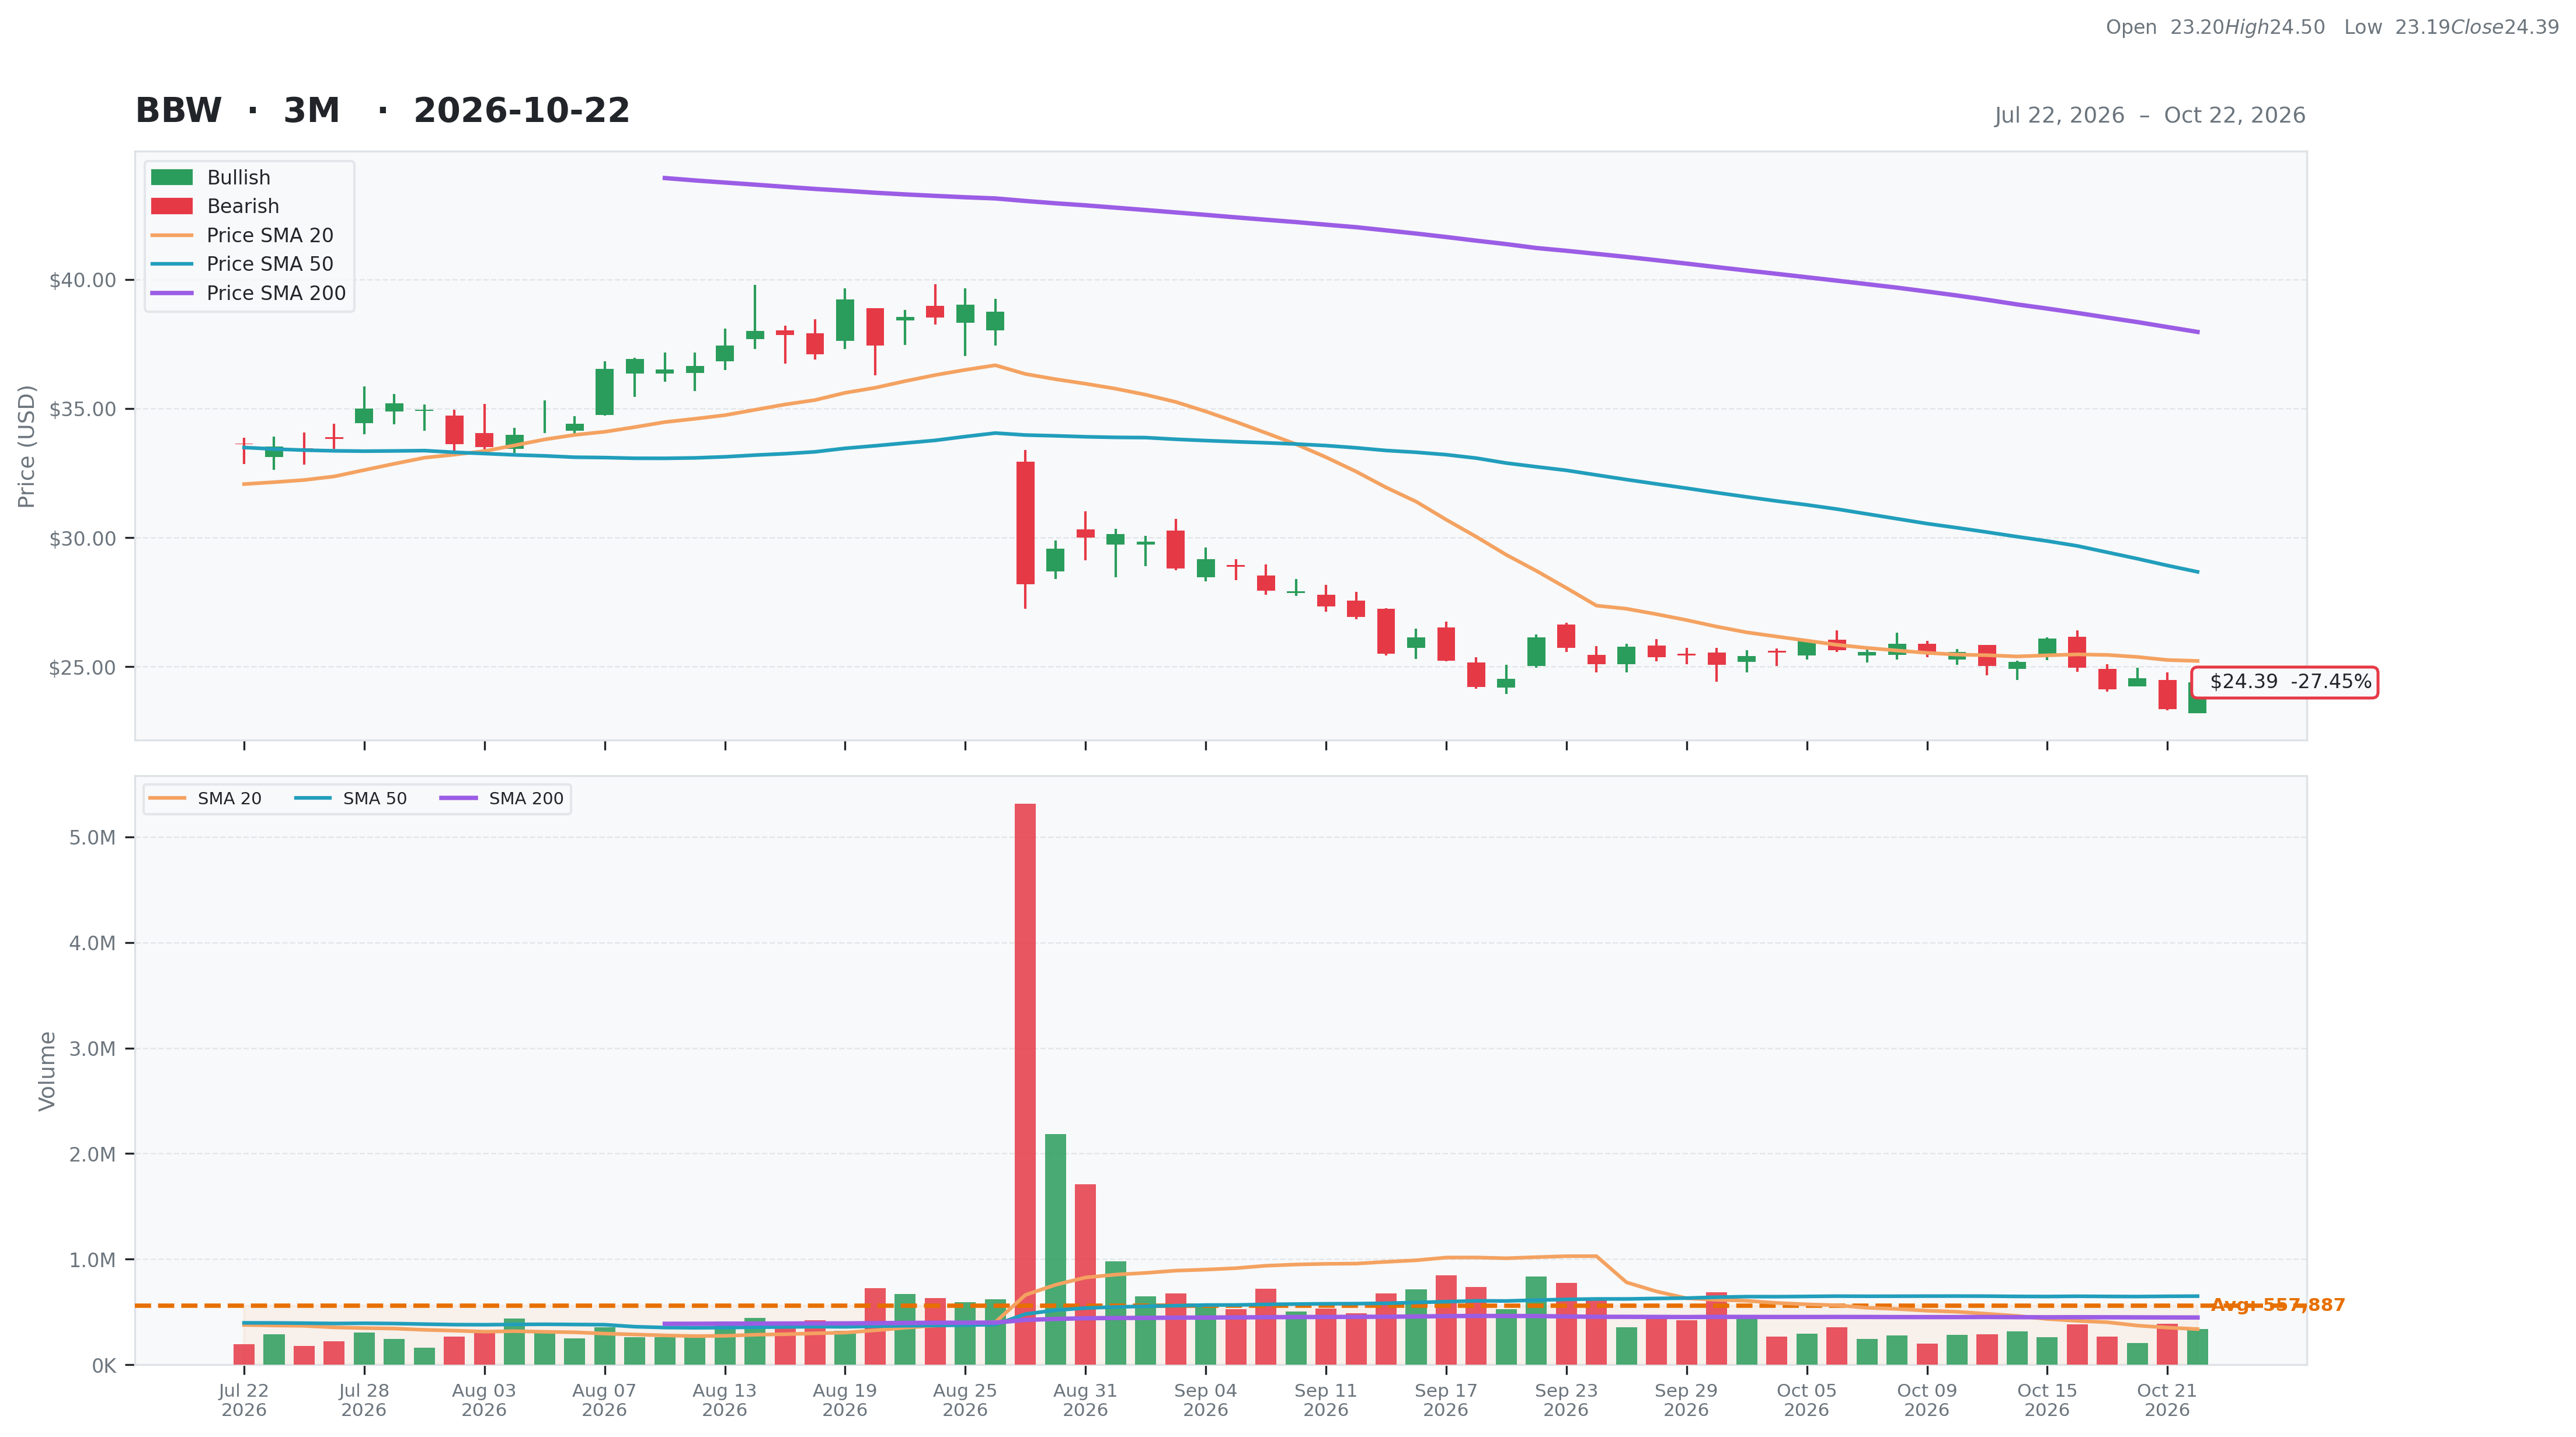
Build-A-Bear Workshop, Inc. (BBW)
Consumer Cyclical • Specialty Retail • $24.39 • MCap: 307,490,592
https://www.buildabear.com • Build-A-Bear Workshop, Inc. operates as a mall-based, experiential specialty retailer for children in the United States, Canada, the United Kingdom, Ireland, North America, and Europe. It operates through three segments: Direct-to-Consumer, Commercial, and International Franchising. The company offers various styles of plush products to be stuffed, pre-stuffed plush products, and sounds and scents that can be added to the stuffed animals, as well as range of clothing, shoes and accessories, and other toy and novelty items. It operates its stores under the Build-A-Bear Workshop brand name; and sells its products through its e-commerce sites and third-party marketplace sites. Build-A-Bear Workshop, Inc. was founded in 1997 and is headquartered in Saint Louis, Missouri.
Watch List
| Score | Price | 52 Week & Averages | Relative Strength | Risk | |||||
|---|---|---|---|---|---|---|---|---|---|
| Total | 56 | Current | $24.39 | 52W High | $69.50 -64.91% | Relative Strength | -0.41 | Beta | 1.01 |
| Business Quality | 14 | Weekly | $26.10 -6.55% | 52W Low | $23.36 4.41% | 3M | -0.27 | Short % | 0.27 |
| Financial Strength | 13 | Monthly | $26.14 -6.68% | Above 50DMA | $28.68 -14.95% | 6M | -0.34 | Risk Score | 3 |
| Growth Outlook | 0 | Quarterly | $33.40 -26.98% | Above 200DMA | $37.97 -35.76% | 9M | -0.61 | ||
| Momentum | 2 | Yearly | $54.16 -54.97% | 12M | -0.55 | ||||
| Valuation | Financial Strength | Growth/Profitability | |||
|---|---|---|---|---|---|
| Trailing P/E | 5.93 | Cash | 14M | Revenue Growth | -0.07% |
| Forward P/E | 6.32 | Debt | 126M | Earnings Growth | -0.26% |
| PEG Ratio | 0.43 | Debt/Equity | 78.94 | Qtr Earnings Growth | -0.29% |
| Price/Sales | 0.59 | Current Ratio | 1.60 | Gross Margin | 0.55% |
| Price/Book | 1.92 | Quick Ratio | 0.39 | Operating Margin | 0.10% |
| EV/Revenue | 0.80 | Operating CF | 59M | Profit Margin | 0.10% |
| EV/EBITDA | 5.89 | Free CF | 7M | EBITDA Margin | 0.14% |
| Ent Value | 413M | Return on Assets | 0.10% | ||
| Return on Equity | 0.33% | ||||
| Technical | Volume & Bollinger Bands | Analyst | |||
|---|---|---|---|---|---|
| RSI | 41.11 | Volume | 0.38M | Rating | strong_buy |
| Previous RSI | 33.67 | Avg Volume 20D | 0.34M | Target Mean | $45.00 |
| RSI Trend | Up | Relative Volume | 0.75 | Target High | $50.00 |
| MACD | -0.99 | Lower Band | 23.86 | Target Low | $40.00 |
| MACD Signal | -1.07 | Middle Band | 25.23 | Target Median | $45.00 |
| Histogram | 0.08 | Upper Band | 26.59 | Analysts | 3 |
| Previous Histogram | 0.06 | Bandwidth | 10.800 | Upside | 80.29% |
| Histogram Trend | Increasing | %B | 0.19 | ||