Booking Holdings Inc. Common St (BKNG)
Consumer Cyclical • Travel Services • $161.1 • MCap: 122,813,136,896
https://www.bookingholdings.com • Booking Holdings Inc., together with its subsidiaries, provides online and traditional travel and restaurant reservations and related services in the United States, the Netherlands, the United Kingdom, and internationally. The company operates Booking.com, which offers online accommodation reservations; and Priceline, which provides discount travel reservations services, as well as online accommodation, flight, rental car reservation services, vacation packages, cruises, activity, and affiliate programs. It also operates Agoda that offers online accommodation reservation, flight, ground transportation, and attractions. In addition, the company operates KAYAK, an online meta-search service that allows consumers to search and compare travel itineraries and prices; and OpenTable for booking online restaurant reservations, as well as reservation management services to restaurants. Further, it offers travel-related insurance products, payment facilitation, and restaurant management services to consumers, travel service providers, and restaurants; and advertising services. The company was formerly known as The Priceline Group Inc. and changed its name to Booking Holdings Inc. in February 2018. Booking Holdings Inc. was founded in 1997 and is headquartered in Norwalk, Connecticut.
RND_10_7_2026
Notes
10/07/2026
Wall Street consensus targets sit at $190 to $236+. This implies a conservative 20% to 50% upside over a 12-month period once regulatory noise clears.
10/07/2026
Look for the volume spike
10/07/2026
For a strict one-year horizon, the recommendation is a HOLD for existing positions and a cautious buy/accumulate for new capital
| Score | Price | 52 Week & Averages | Relative Strength | Risk | |||||
|---|---|---|---|---|---|---|---|---|---|
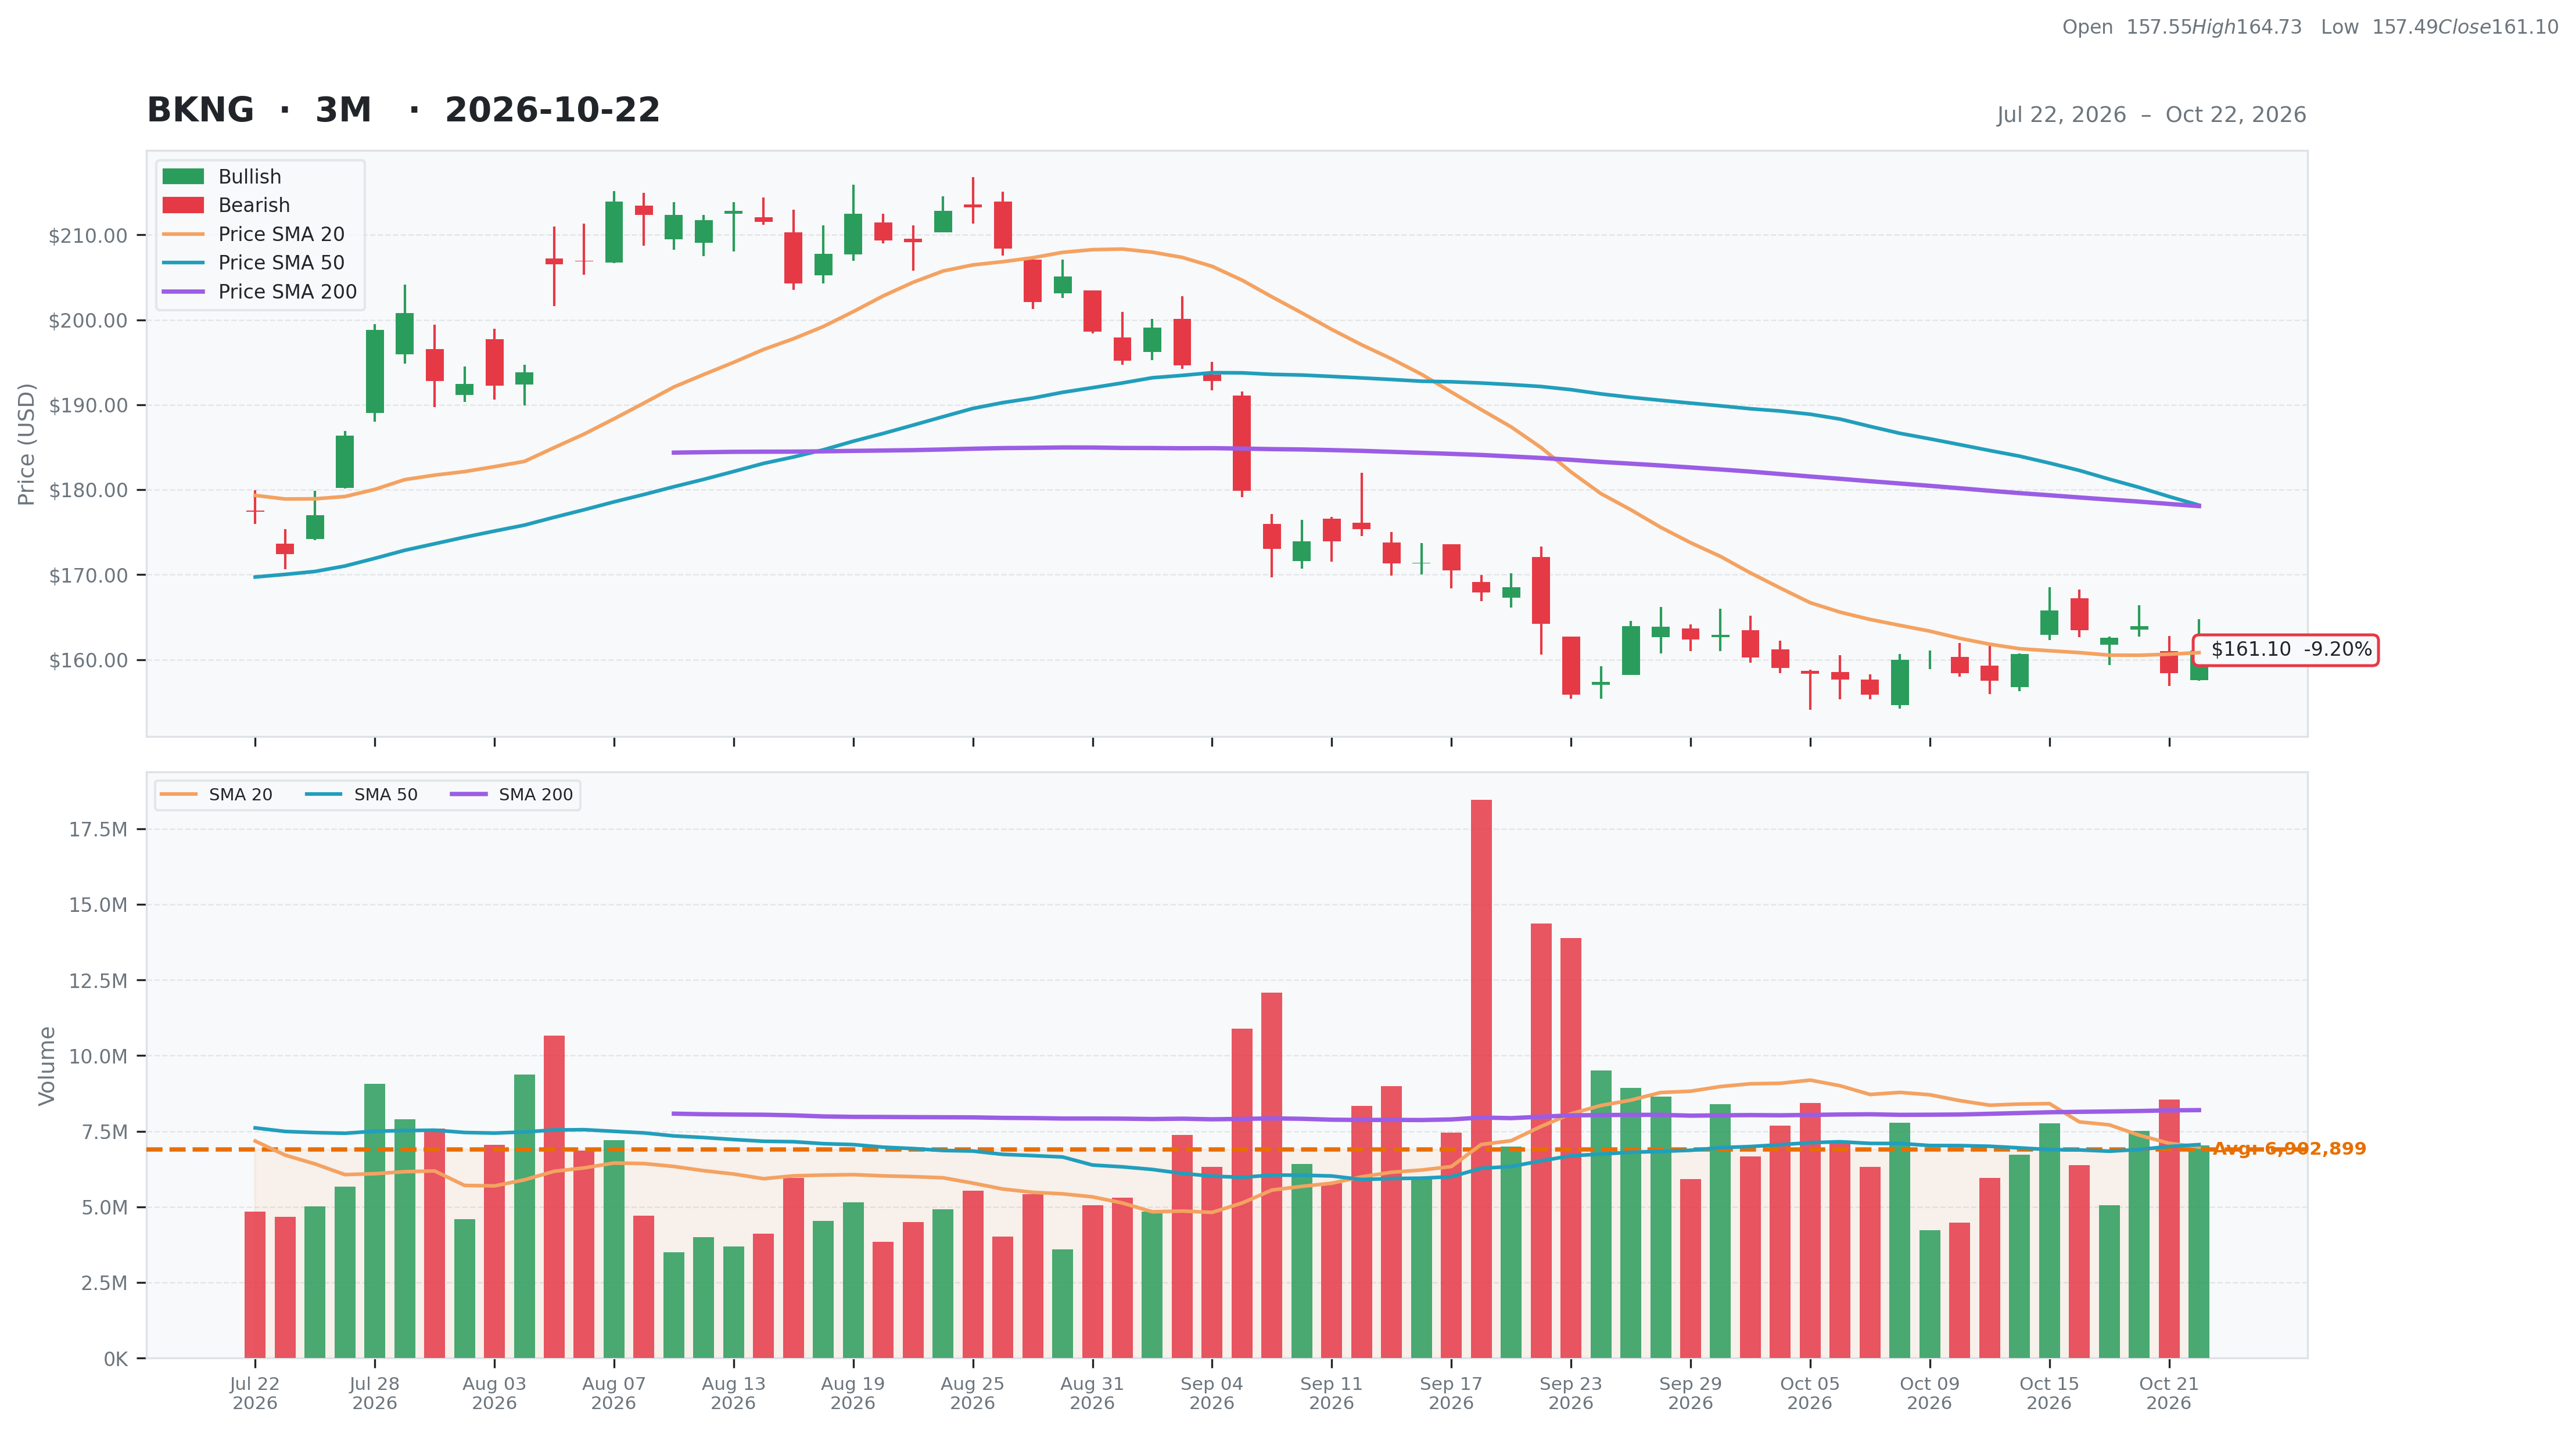
| Total | 79 | Current | $161.10 | 52W High | $218.11 -26.14% | Relative Strength | -0.14 | Beta | 1.13 |
| Business Quality | 25 | Weekly | $165.80 -2.83% | 52W Low | $153.37 5.04% | 3M | -0.09 | Short % | 0.03 |
| Financial Strength | 11 | Monthly | $164.22 -1.90% | Above 50DMA | $178.18 -9.59% | 6M | -0.08 | Risk Score | 1 |
| Growth Outlook | 15 | Quarterly | $177.03 -9.00% | Above 200DMA | $178.07 -9.53% | 9M | -0.21 | ||
| Momentum | 3 | Yearly | $208.27 -22.65% | 12M | -0.21 | ||||
| Valuation | Financial Strength | Growth/Profitability | |||
|---|---|---|---|---|---|
| Trailing P/E | 18.12 | Cash | 17,214M | Revenue Growth | 0.08% |
| Forward P/E | 13.20 | Debt | 20,924M | Earnings Growth | 1.30% |
| PEG Ratio | 0.91 | Debt/Equity | N/A | Qtr Earnings Growth | 1.18% |
| Price/Sales | 4.35 | Current Ratio | 1.09 | Gross Margin | 0.87% |
| Price/Book | -11.49 | Quick Ratio | 1.02 | Operating Margin | 0.34% |
| EV/Revenue | 4.48 | Operating CF | 9,859M | Profit Margin | 0.26% |
| EV/EBITDA | 12.15 | Free CF | 7,726M | EBITDA Margin | 0.37% |
| Ent Value | 126,523M | Return on Assets | 0.20% | ||
| Return on Equity | N/A | ||||
| Technical | Volume & Bollinger Bands | Analyst | |||
|---|---|---|---|---|---|
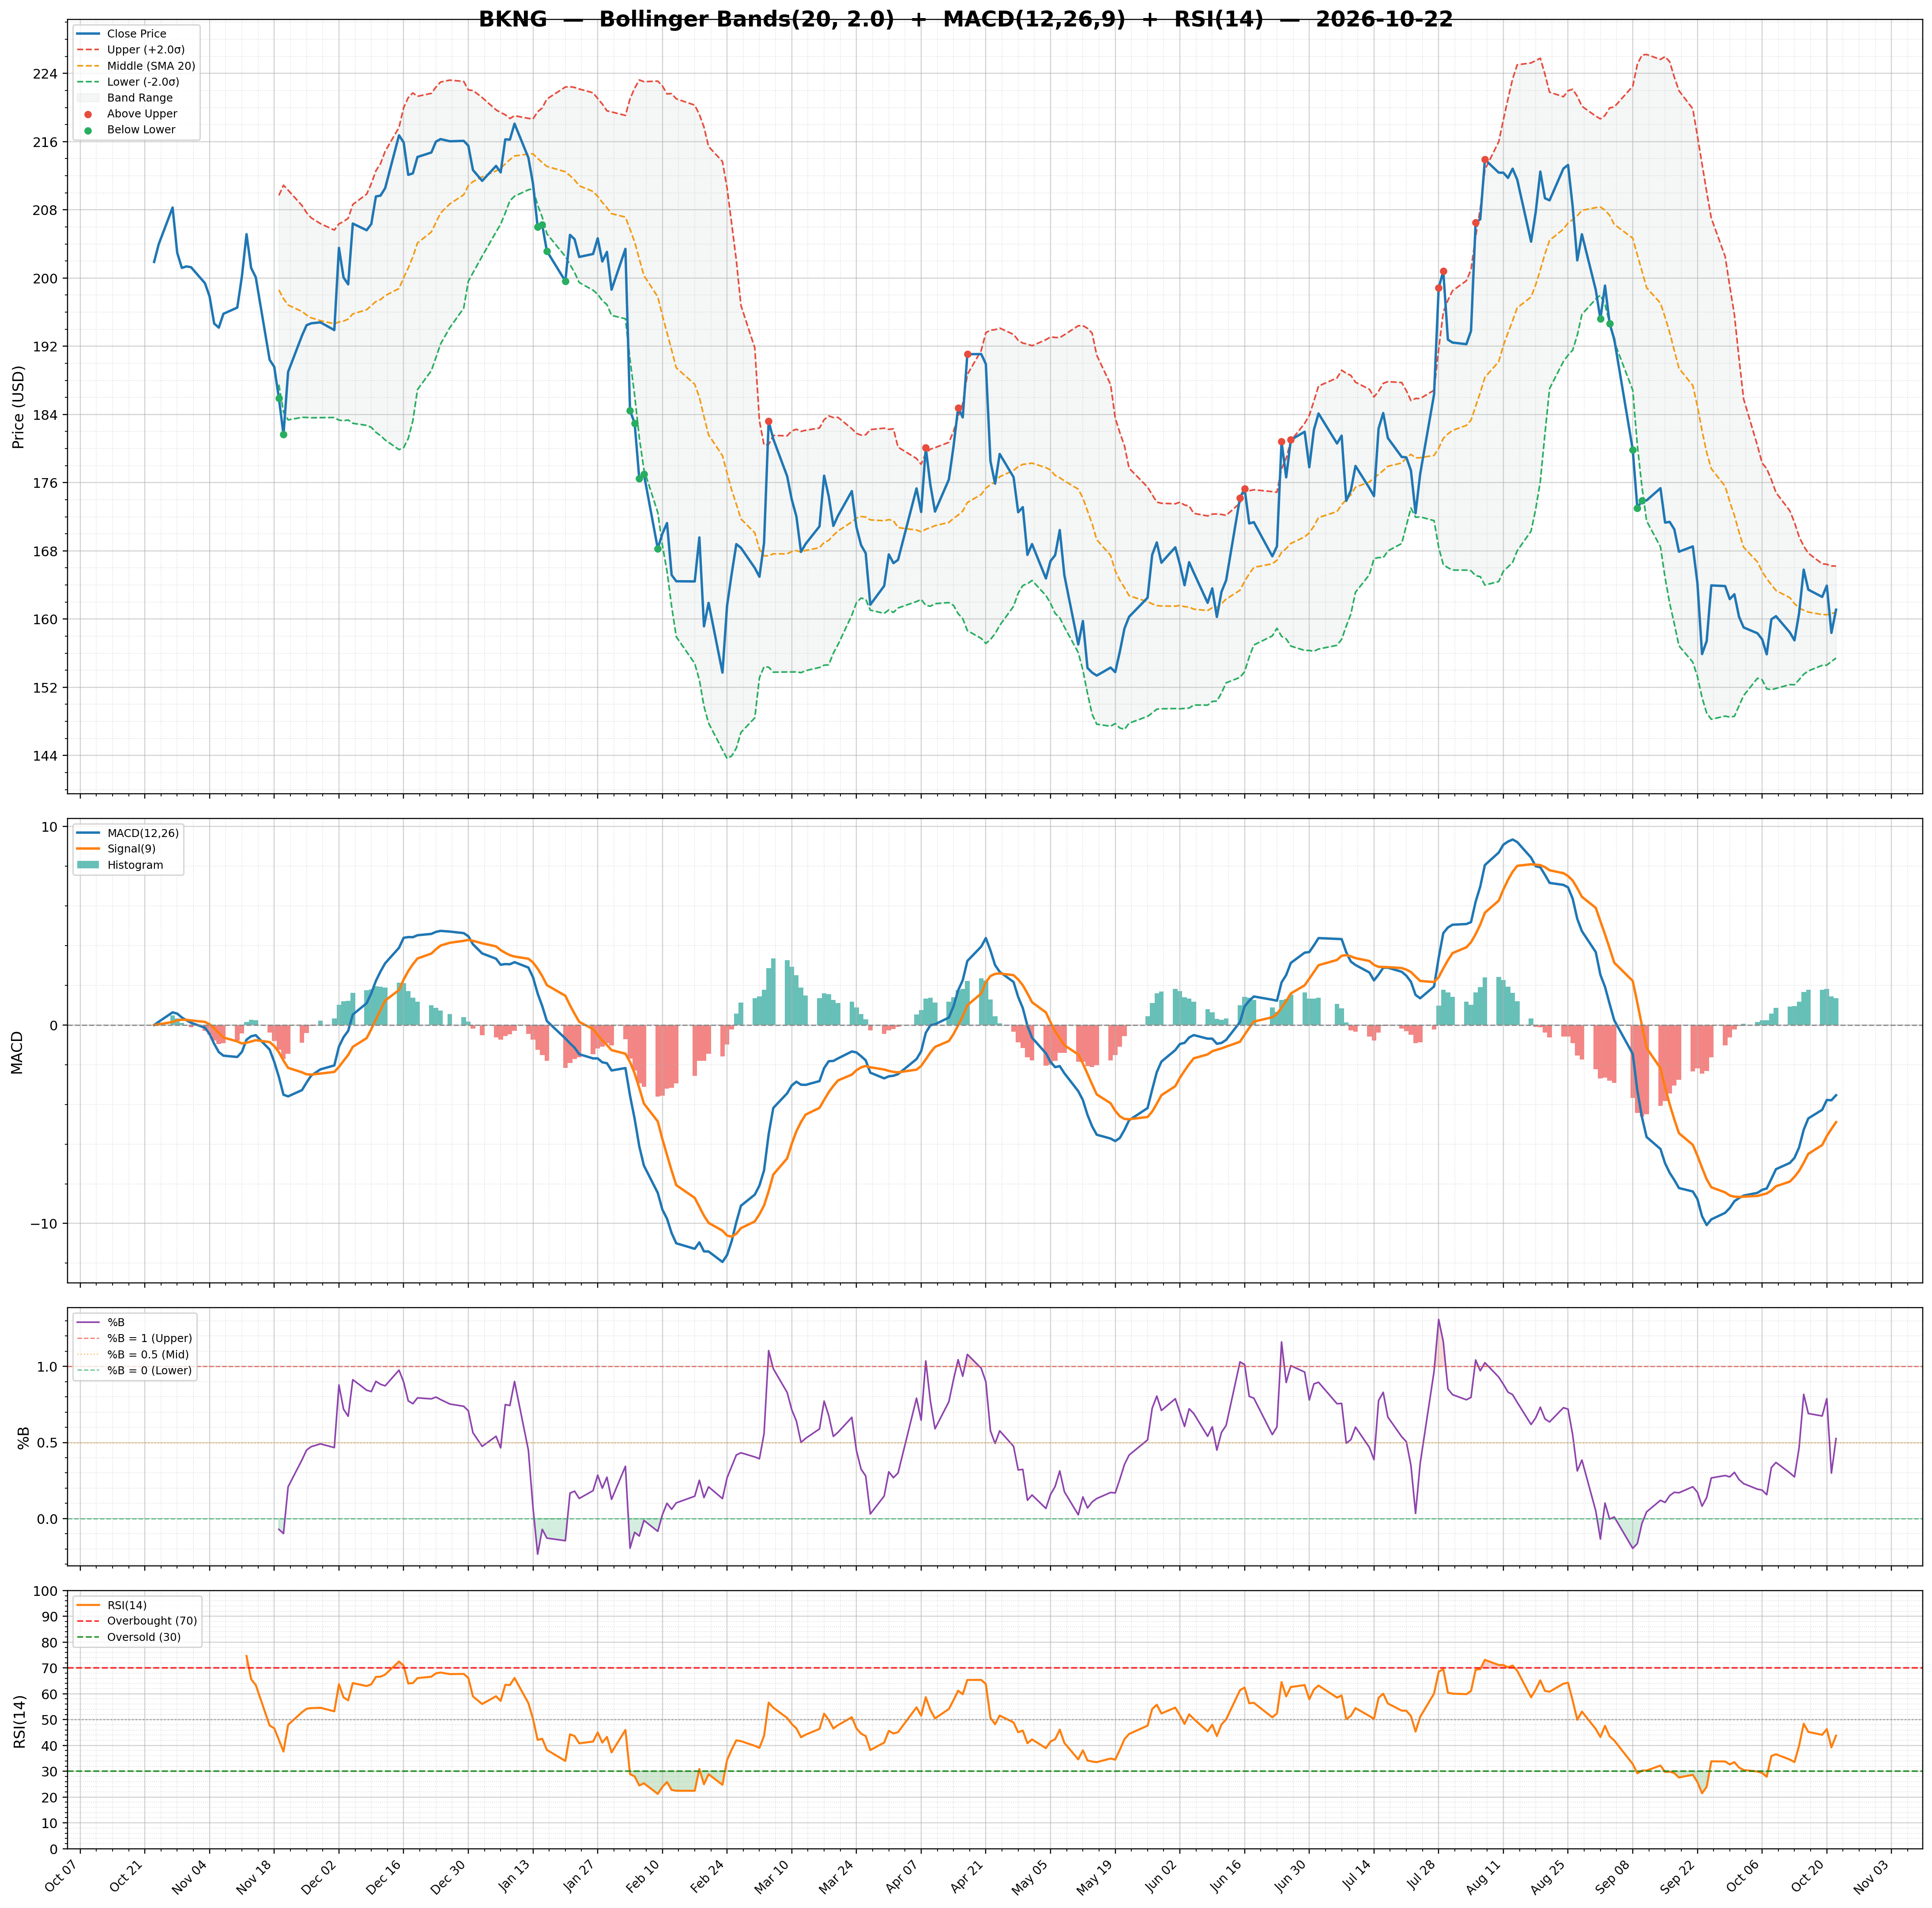
| RSI | 43.80 | Volume | 6.37M | Rating | buy |
| Previous RSI | 39.25 | Avg Volume 20D | 6.98M | Target Mean | $233.83 |
| RSI Trend | Up | Relative Volume | 0.88 | Target High | $301.00 |
| MACD | -3.54 | Lower Band | 155.42 | Target Low | $170.00 |
| MACD Signal | -4.89 | Middle Band | 160.82 | Target Median | $240.00 |
| Histogram | 1.36 | Upper Band | 166.22 | Analysts | 35 |
| Previous Histogram | 1.44 | Bandwidth | 6.710 | Upside | 43.06% |
| Histogram Trend | Decreasing | %B | 0.53 | ||