Blend Labs, Inc. (BLND)
Technology • Software - Application • $1.11 • MCap: 212,885,632
https://www.blend.com • Blend Labs, Inc. provides a cloud-based software platform for financial services firms in the United States, India, and Mexico. The company offers a suite of products that powers digital-first consumer journeys for mortgages, home equity loans and lines of credit, vehicle loans, rapid home lending, personal loans, credit cards, and deposit accounts; and a suite of add-on products that offers to enhance consumers' journeys to homeownership, such as close, income verification for mortgage and home equity lines of credit, and home equity loans. It also provides Blend Builder to configure or build custom workflows from a pre-built set of components; verification components to automate confirmation tasks that are needed to underwrite a loan or approve the opening of a new deposit account; decisioning components to reduce the need for human intervention by automatically applying business rules throughout an application workflow configured by a financial services firm; AI capabilities; and workflow intelligence components to manage data collection and automate tasks throughout the loan origination process. In addition, the company offers application programming interfaces, which integrate the capabilities of technology, data, and service providers into software platform, as well as support services, professional and consulting services. It serves banks, credit unions, fintechs, and other non-bank mortgage lenders. The company was incorporated in 2012 and is headquartered in Novato, California.
ET
| Score | Price | 52 Week & Averages | Relative Strength | Risk | |||||
|---|---|---|---|---|---|---|---|---|---|
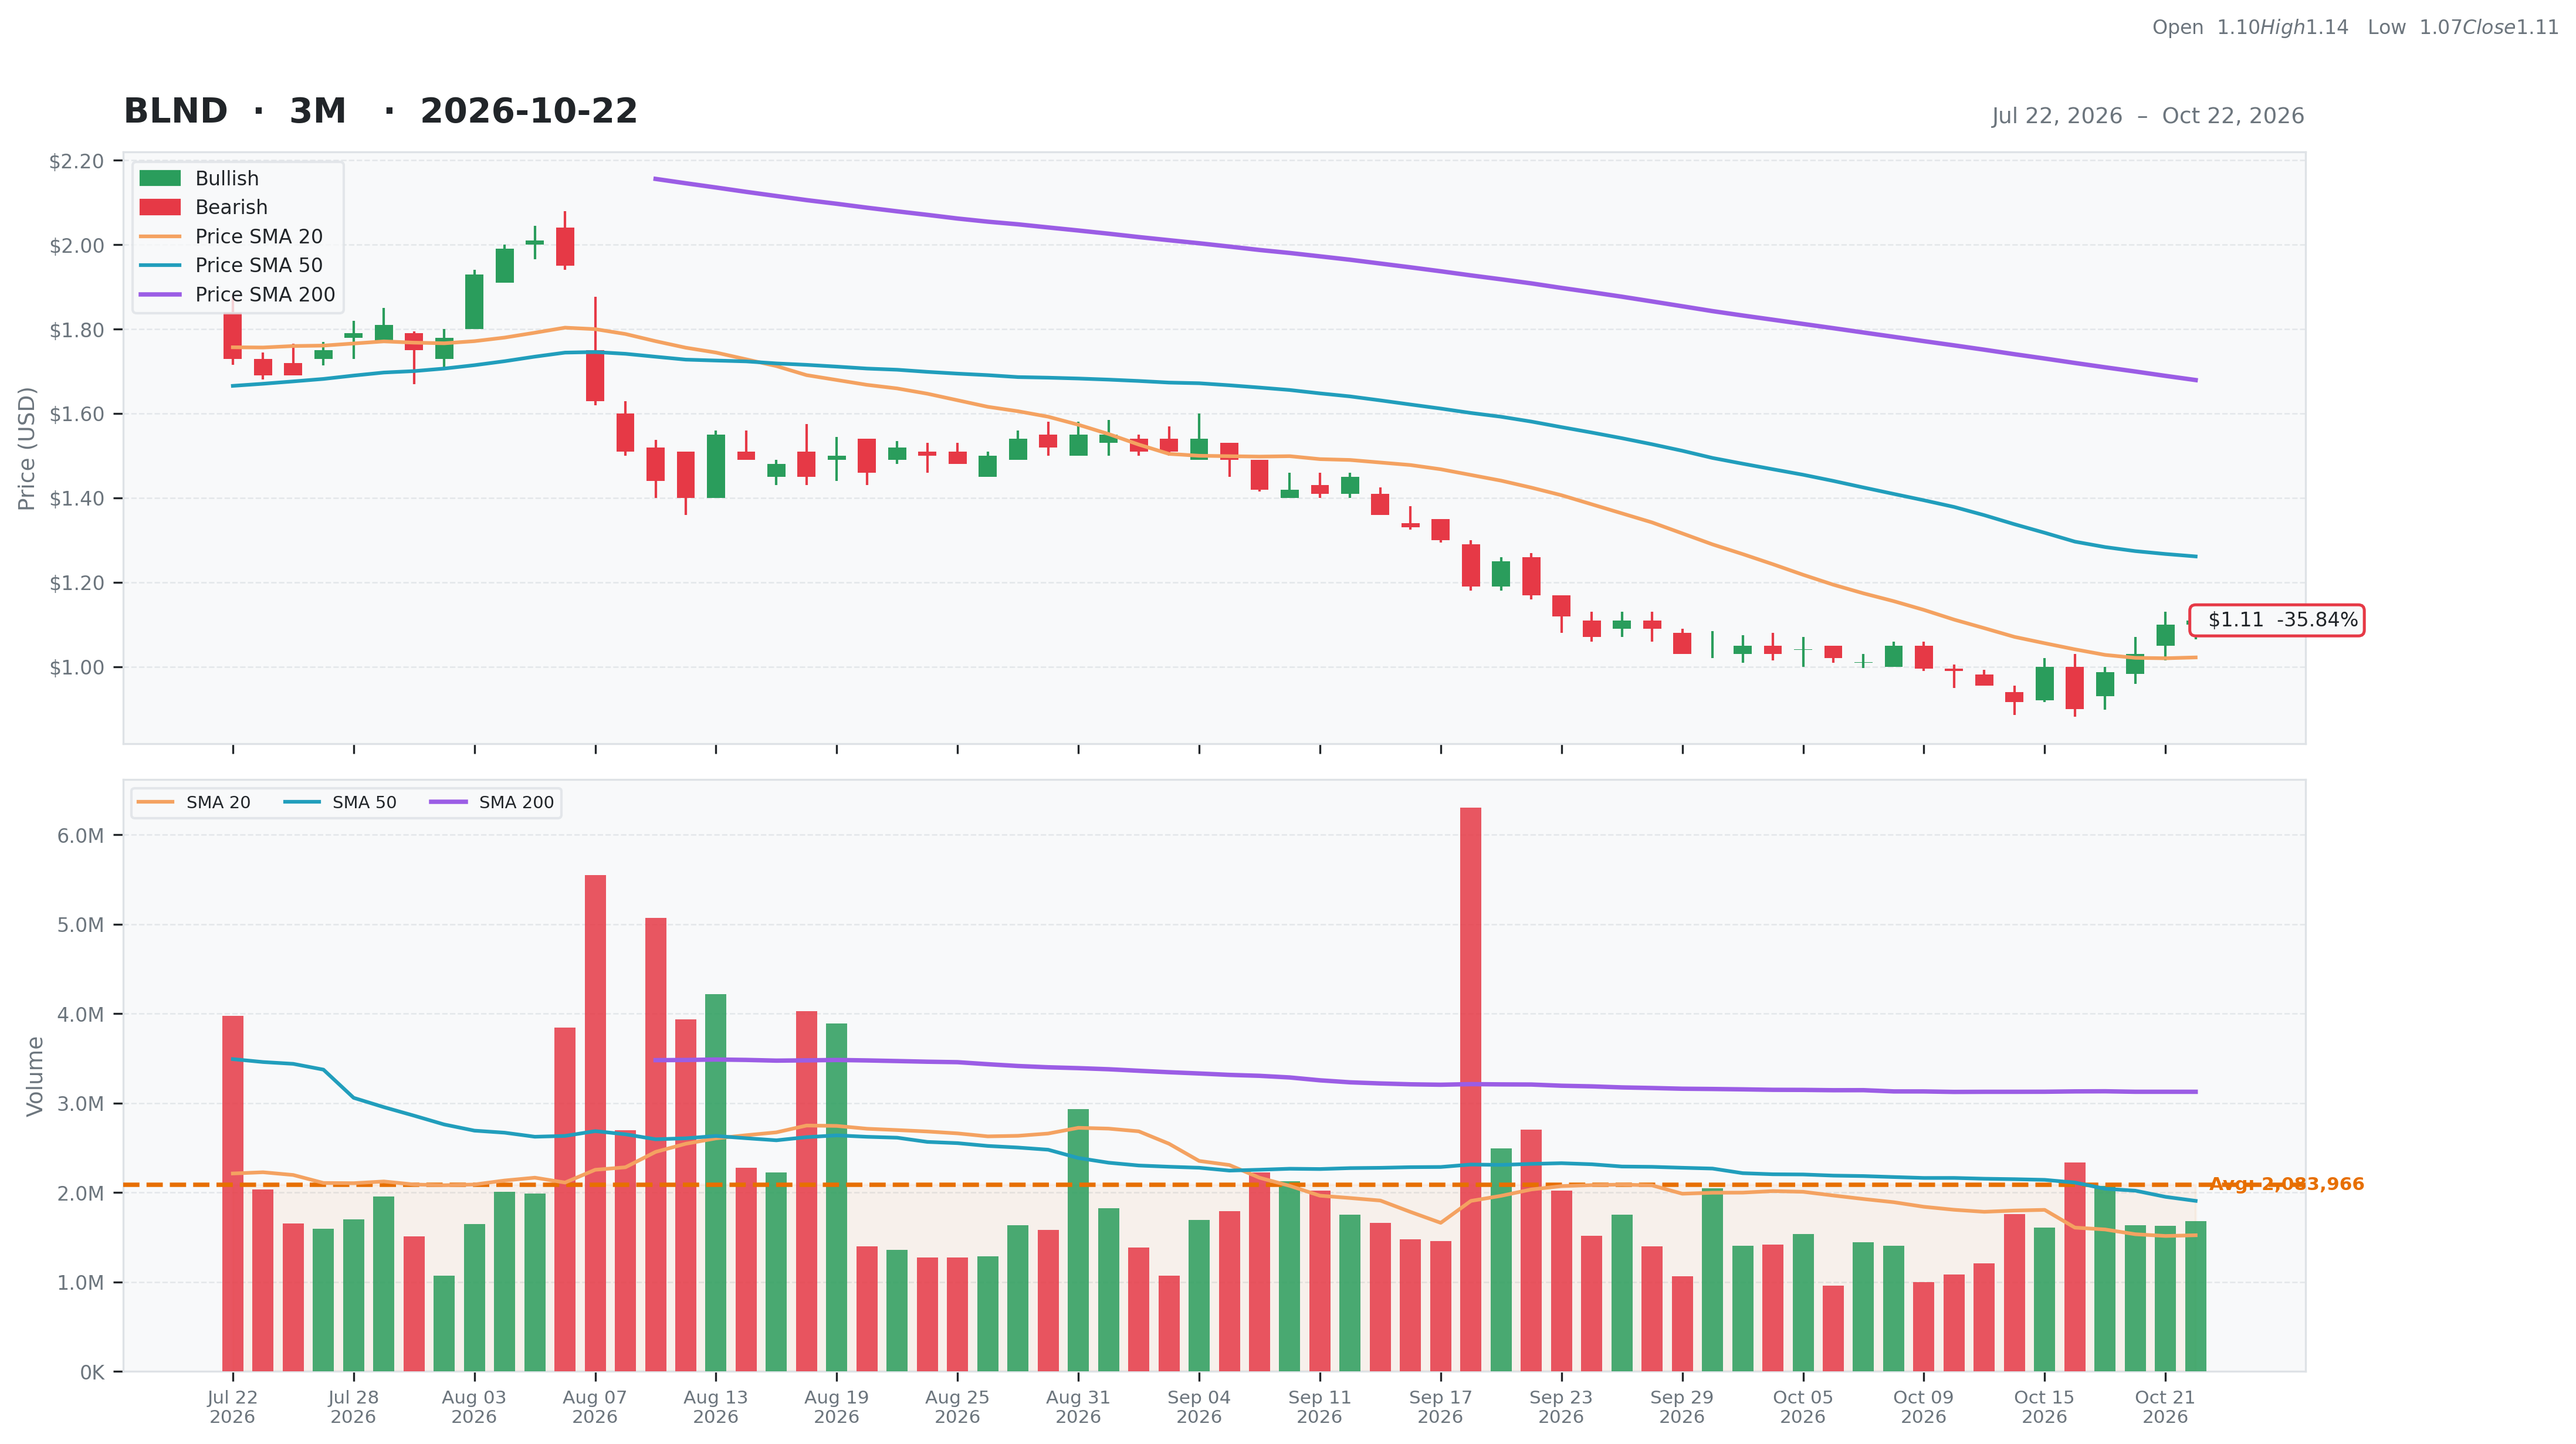
| Total | 45 | Current | $1.11 | 52W High | $3.56 -68.82% | Relative Strength | -0.44 | Beta | 1.08 |
| Business Quality | 10 | Weekly | $1.00 11.00% | 52W Low | $0.90 23.33% | 3M | -0.34 | Short % | 0.05 |
| Financial Strength | 13 | Monthly | $1.17 -5.13% | Above 50DMA | $1.26 -12.01% | 6M | -0.20 | Risk Score | 10 |
| Growth Outlook | 1 | Quarterly | $1.69 -34.32% | Above 200DMA | $1.68 -33.90% | 9M | -0.62 | ||
| Momentum | 2 | Yearly | $3.55 -68.73% | 12M | -0.69 | ||||
| Valuation | Financial Strength | Growth/Profitability | |||
|---|---|---|---|---|---|
| Trailing P/E | N/A | Cash | 45M | Revenue Growth | 0.07% |
| Forward P/E | 15.00 | Debt | 2M | Earnings Growth | N/A |
| PEG Ratio | N/A | Debt/Equity | 2.15 | Qtr Earnings Growth | N/A |
| Price/Sales | 1.64 | Current Ratio | 1.62 | Gross Margin | 0.75% |
| Price/Book | -2.87 | Quick Ratio | 1.36 | Operating Margin | -0.05% |
| EV/Revenue | 2.61 | Operating CF | 13M | Profit Margin | 0.00% |
| EV/EBITDA | -23.42 | Free CF | 24M | EBITDA Margin | -0.11% |
| Ent Value | 339M | Return on Assets | -0.06% | ||
| Return on Equity | 0.02% | ||||
| Technical | Volume & Bollinger Bands | Analyst | |||
|---|---|---|---|---|---|
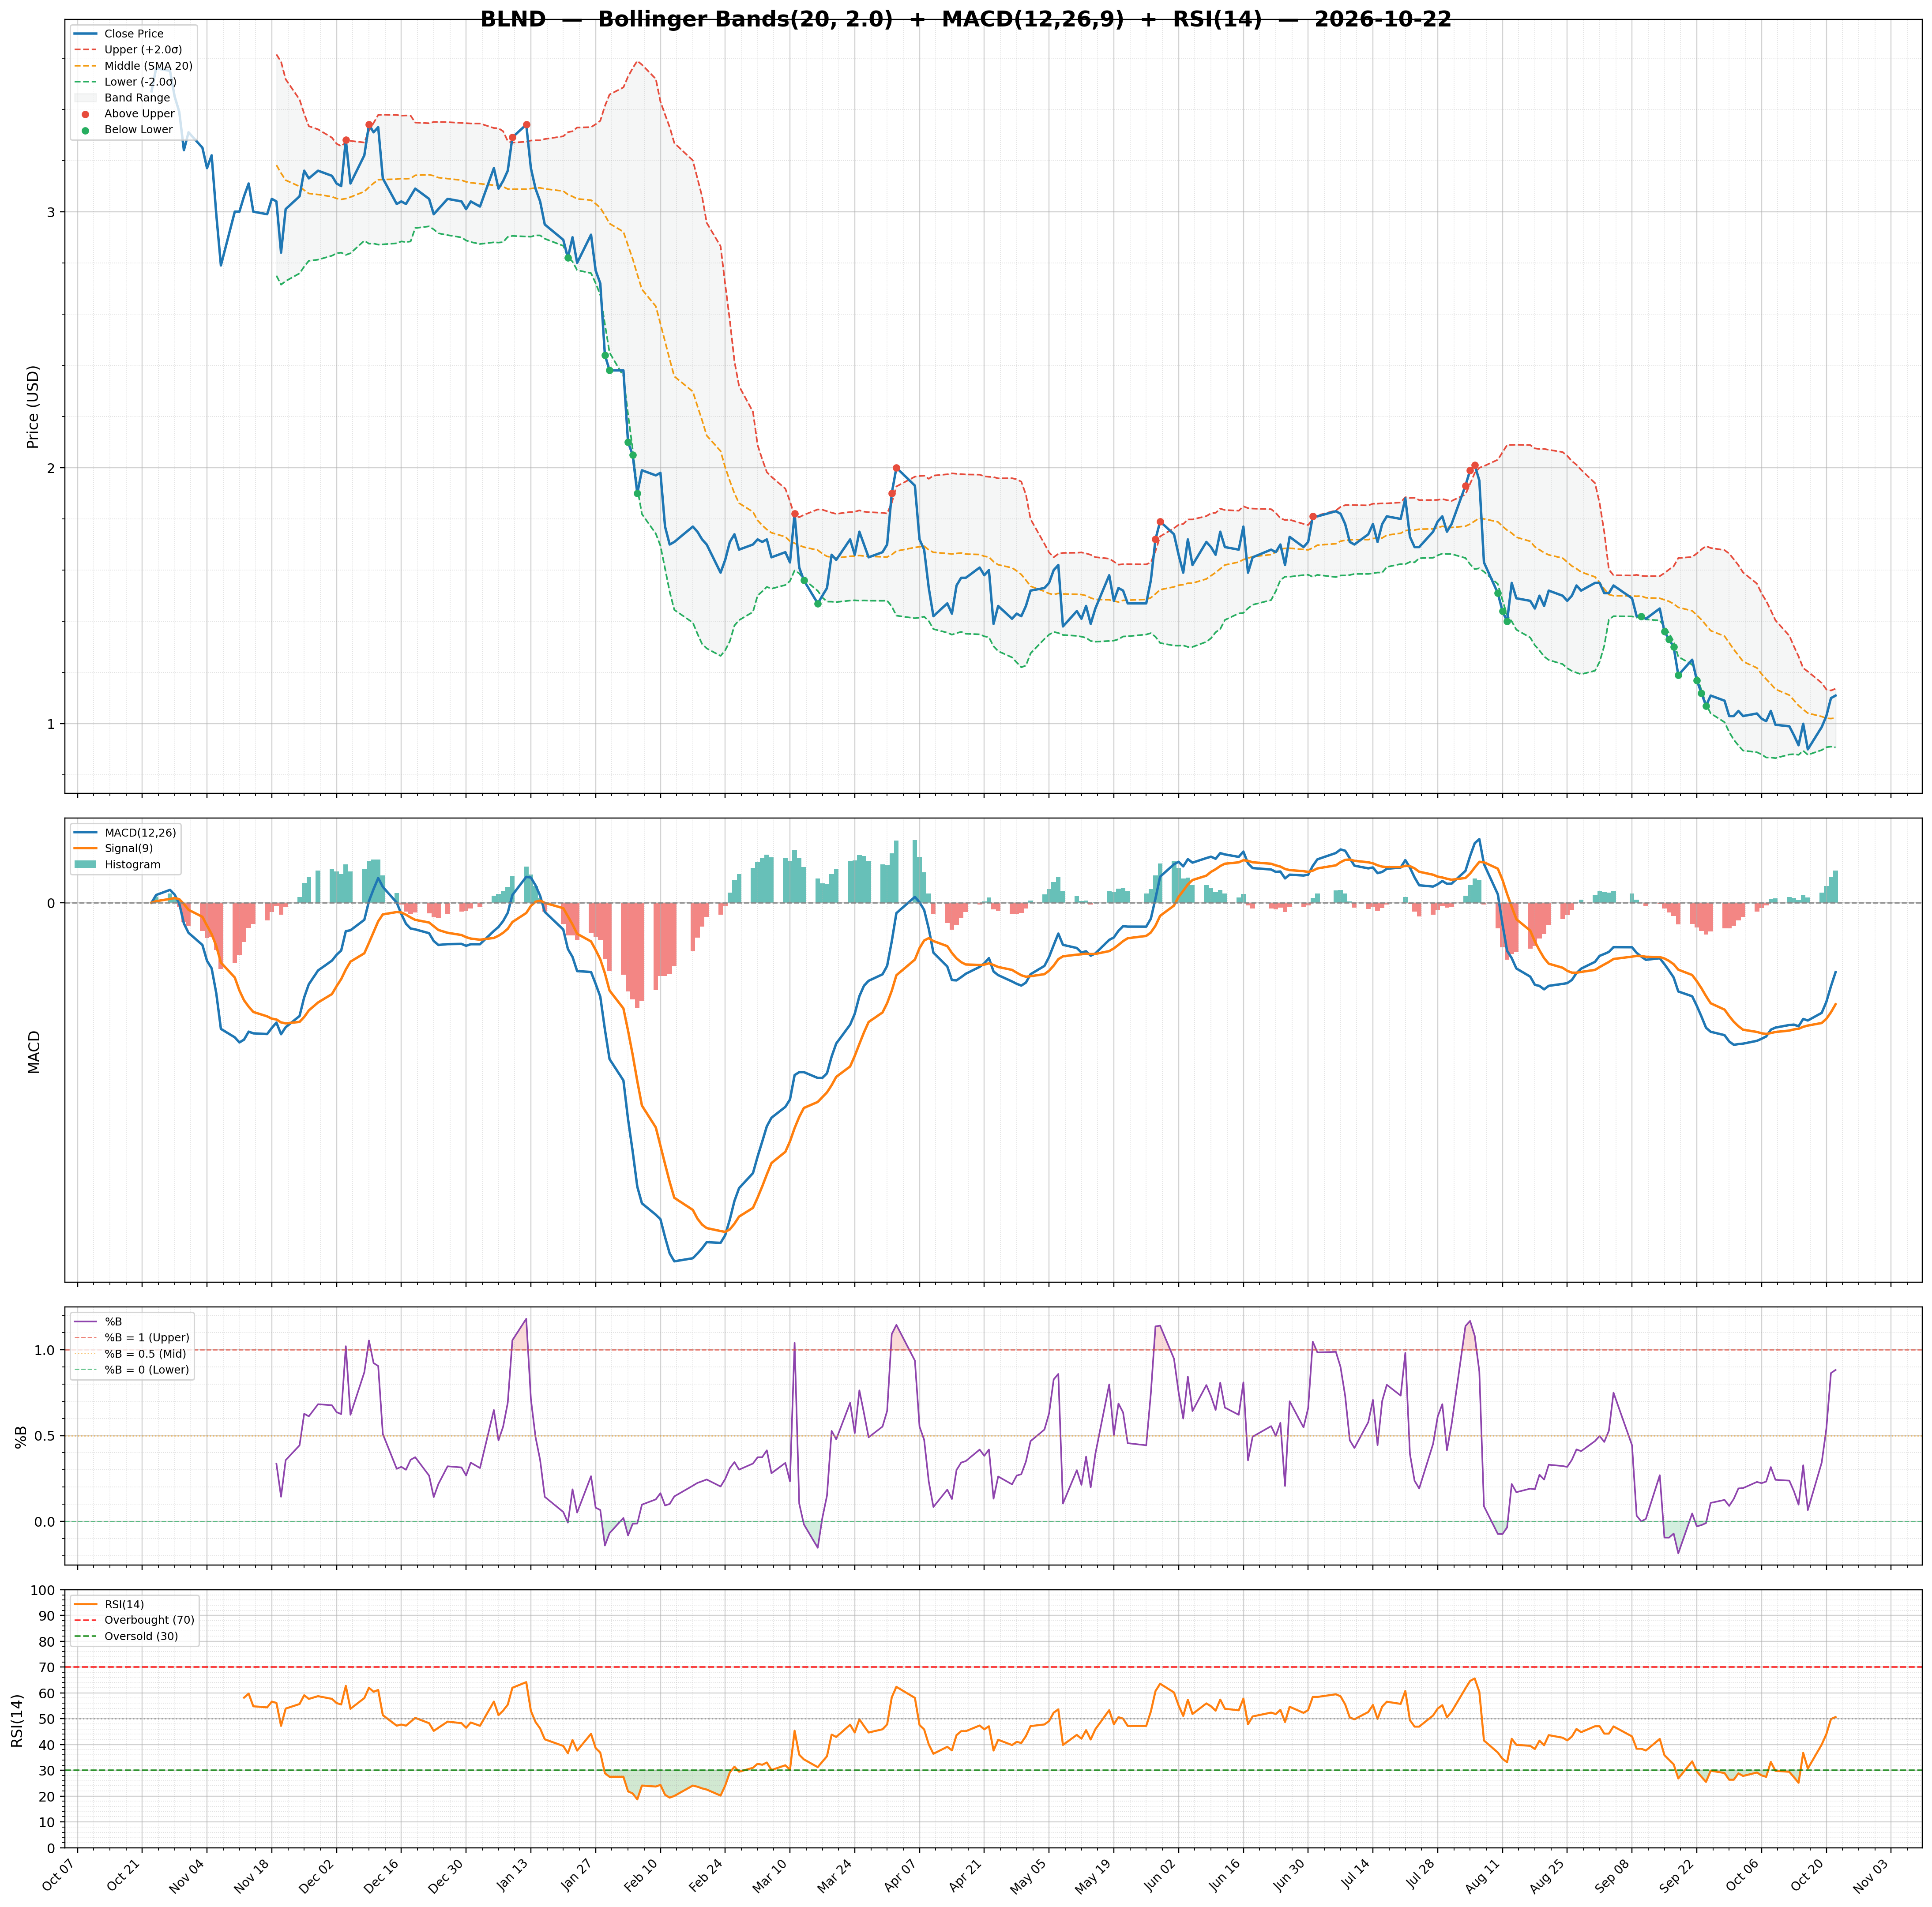
| RSI | 50.66 | Volume | 2.34M | Rating | none |
| Previous RSI | 49.86 | Avg Volume 20D | 1.52M | Target Mean | $2.96 |
| RSI Trend | Up | Relative Volume | 0.94 | Target High | $4.00 |
| MACD | -0.06 | Lower Band | 0.91 | Target Low | $1.80 |
| MACD Signal | -0.09 | Middle Band | 1.02 | Target Median | $3.00 |
| Histogram | 0.03 | Upper Band | 1.14 | Analysts | 5 |
| Previous Histogram | 0.02 | Bandwidth | 22.440 | Upside | 228.85% |
| Histogram Trend | Increasing | %B | 0.88 | ||