DMC Global Inc. (BOOM)
Industrials • Conglomerates • $5.23 • MCap: 109,483,248
https://www.dmcglobal.com • DMC Global Inc. provides various products and engineered solutions for the construction, energy, and industrial processing markets worldwide. It operates through three segments: Arcadia Products, DynaEnergetics, and NobelClad. The Arcadia Products segment offers designed, engineered, fabricated, and finished aluminum framing systems, windows, curtain walls, storefronts, entrance systems, and other architectural components for use in commercial exteriors; and interior framing and partitions comprising framing systems, aluminum doors, sliding systems, and glazing systems. This segment also provides custom, fully fabricated aluminum, steel, and wood windows and doors for the home market. This segment sells its products through a national in-house sales force for buildings, such as office towers, airports, hotels, education and athletic facilities, health care facilities, government buildings, retail centers, mixed use and multi-family residential buildings, and industrial and manufacturing centers. The DynaEnergetics segment designs, manufactures, and sells perforating systems, such as initiation systems, shaped charges, detonating cords, gun hardware, and a control panel; and perforating systems and associated hardware for the oil and gas industry. This segment sells its products through direct selling, distributors, and independent sales representatives. The NobelClad segment produces and sells explosion-welded clad metal plates for use in the construction of heavy, corrosion resistant pressure vessels, and heat exchangers for oil and gas, chemical and petrochemical, petroleum refining, alternative energy, hydrometallurgy, aluminum production, shipbuilding, power generation, and industrial refrigeration industries. The company was formerly known as Dynamic Materials Corporation and changed its name to DMC Global Inc. in November 2016. DMC Global Inc. was founded in 1965 and is headquartered in Broomfield, Colorado.
AAII
| Score | Price | 52 Week & Averages | Relative Strength | Risk | |||||
|---|---|---|---|---|---|---|---|---|---|
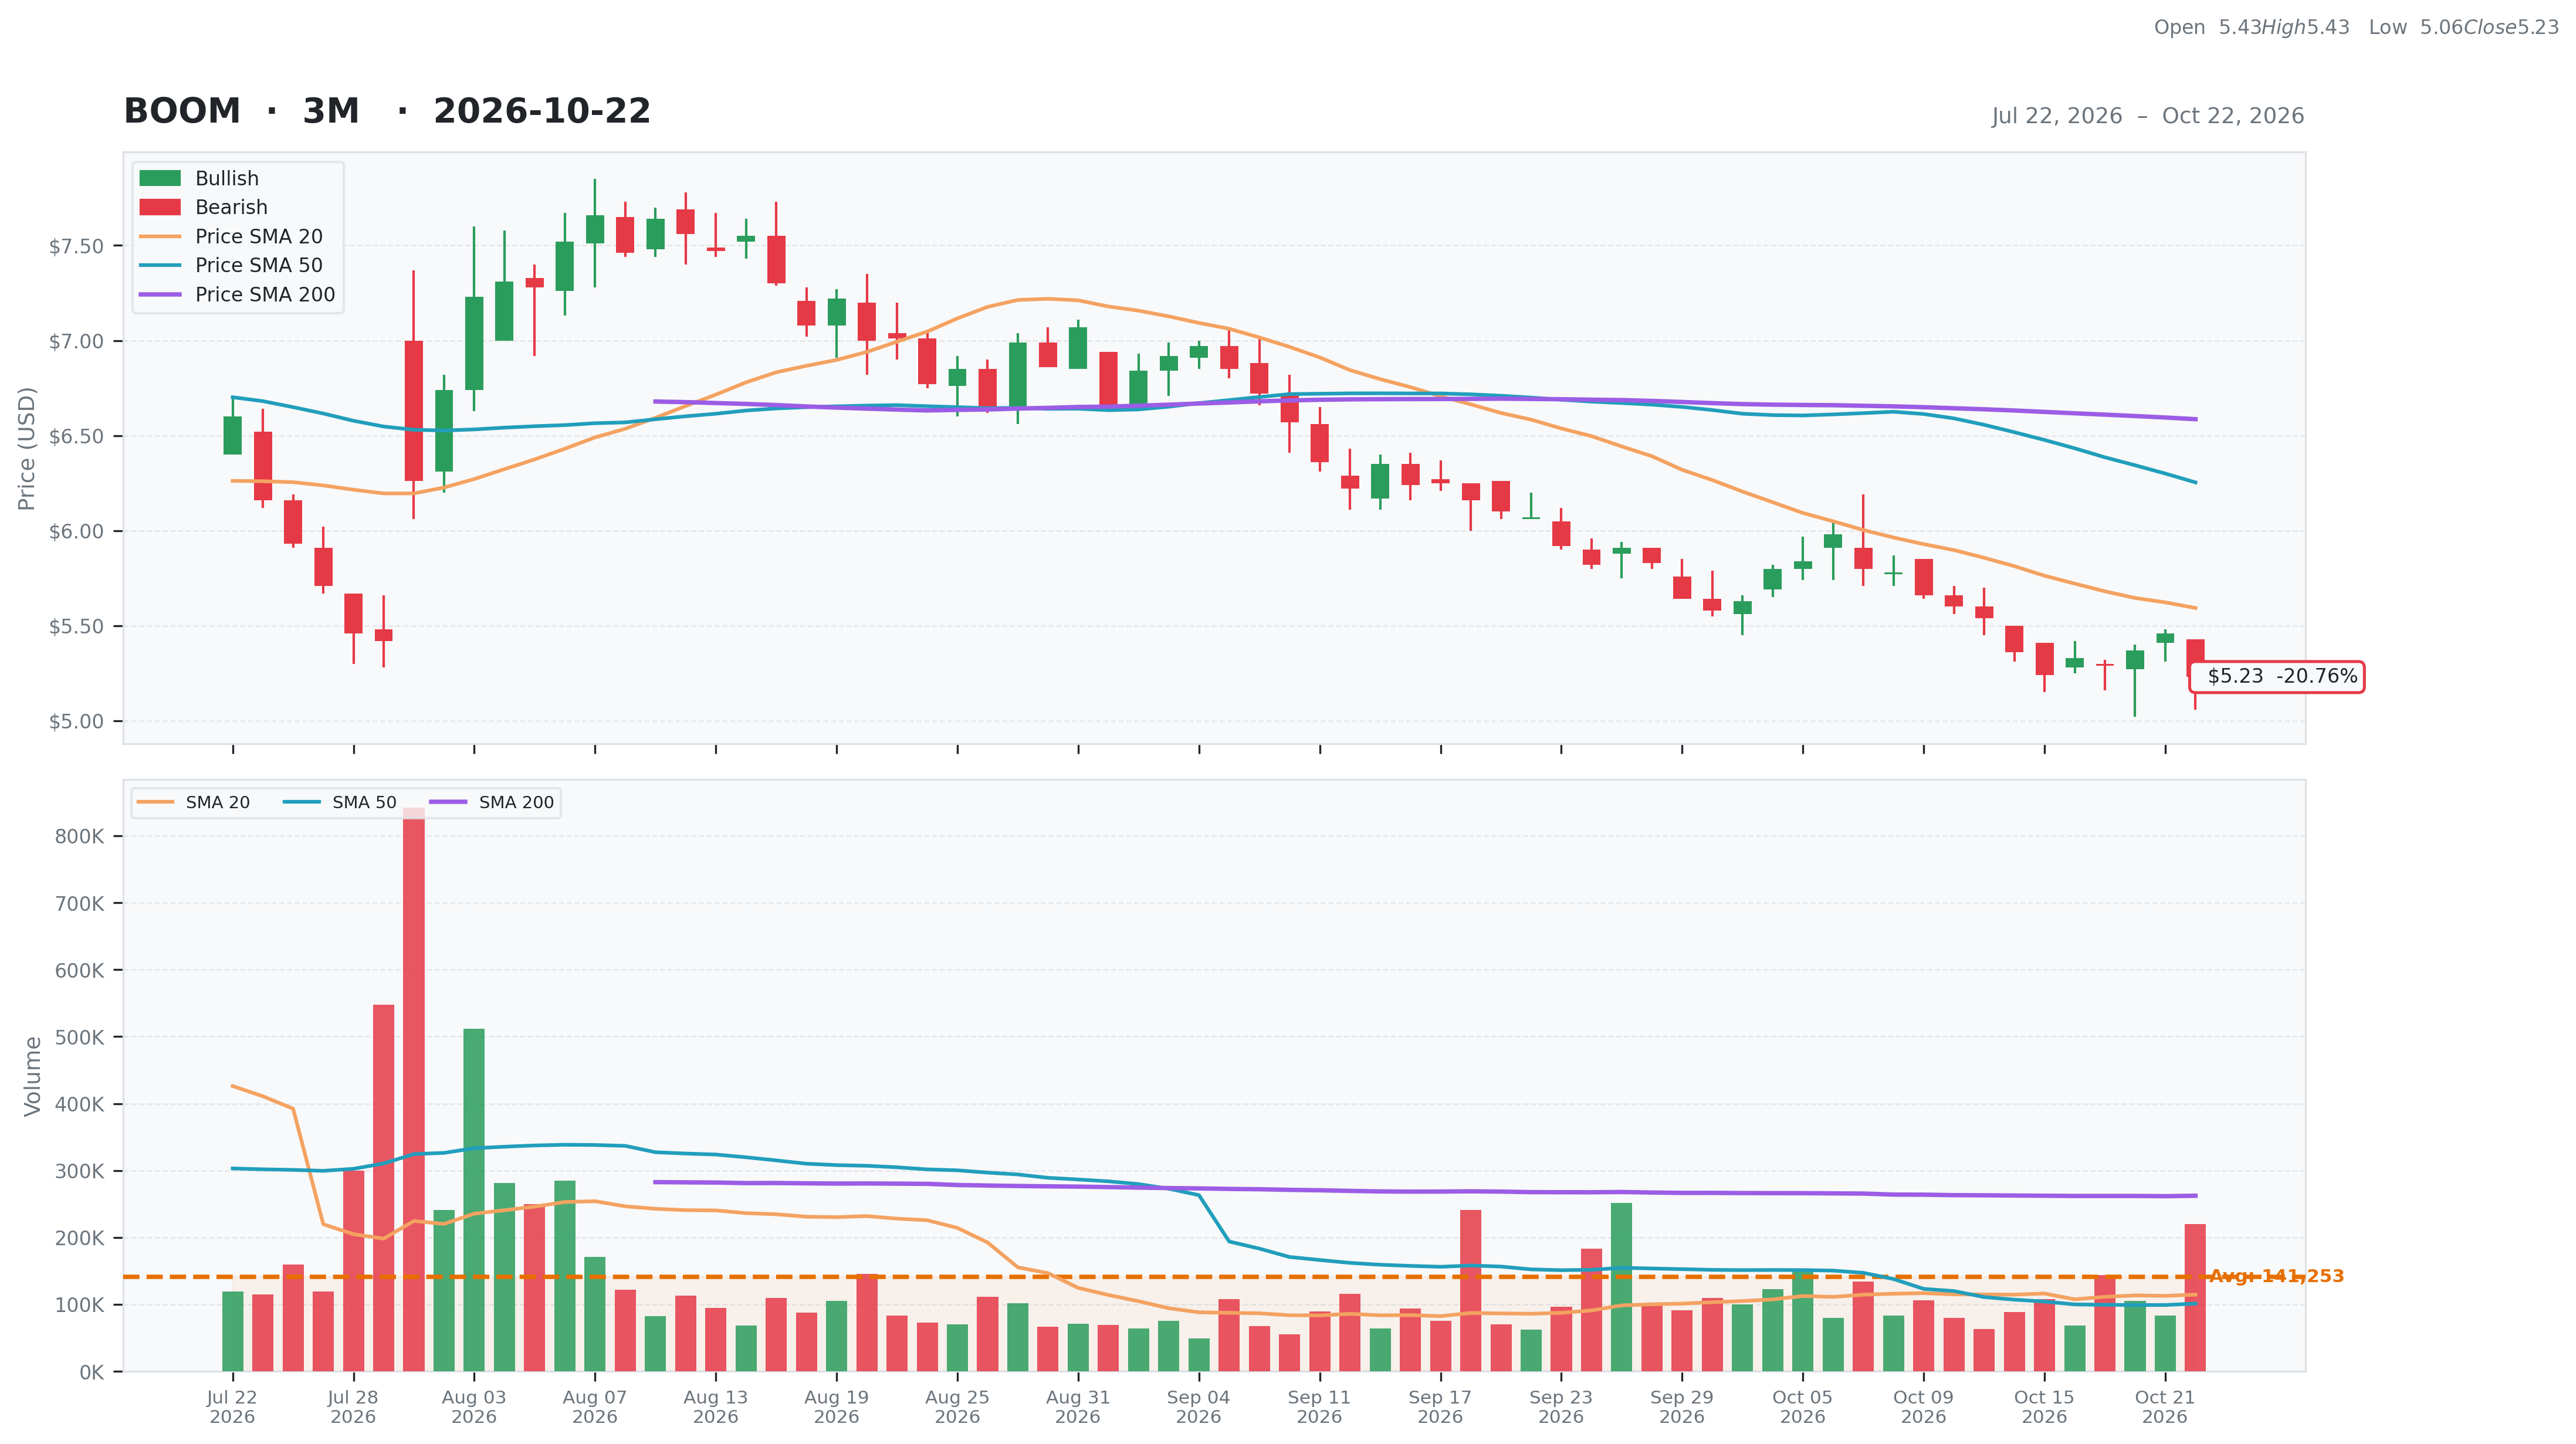
| Total | 44 | Current | $5.23 | 52W High | $8.97 -41.69% | Relative Strength | -0.22 | Beta | 1.80 |
| Business Quality | 1 | Weekly | $5.24 -0.19% | 52W Low | $4.73 10.57% | 3M | -0.12 | Short % | 0.01 |
| Financial Strength | 13 | Monthly | $6.07 -13.84% | Above 50DMA | $6.25 -16.37% | 6M | -0.07 | Risk Score | 7 |
| Growth Outlook | 5 | Quarterly | $5.93 -11.80% | Above 200DMA | $6.59 -20.59% | 9M | -0.41 | ||
| Momentum | 2 | Yearly | $8.50 -38.47% | 12M | -0.38 | ||||
| Valuation | Financial Strength | Growth/Profitability | |||
|---|---|---|---|---|---|
| Trailing P/E | N/A | Cash | 29M | Revenue Growth | 0.01% |
| Forward P/E | 12.40 | Debt | 104M | Earnings Growth | N/A |
| PEG Ratio | 0.49 | Debt/Equity | 24.55 | Qtr Earnings Growth | 3.37% |
| Price/Sales | 0.19 | Current Ratio | 2.56 | Gross Margin | 0.20% |
| Price/Book | 0.46 | Quick Ratio | 1.07 | Operating Margin | 0.03% |
| EV/Revenue | 0.63 | Operating CF | 23M | Profit Margin | -0.03% |
| EV/EBITDA | 13.67 | Free CF | 22M | EBITDA Margin | 0.05% |
| Ent Value | 372M | Return on Assets | -0.01% | ||
| Return on Equity | -0.04% | ||||
| Technical | Volume & Bollinger Bands | Analyst | |||
|---|---|---|---|---|---|
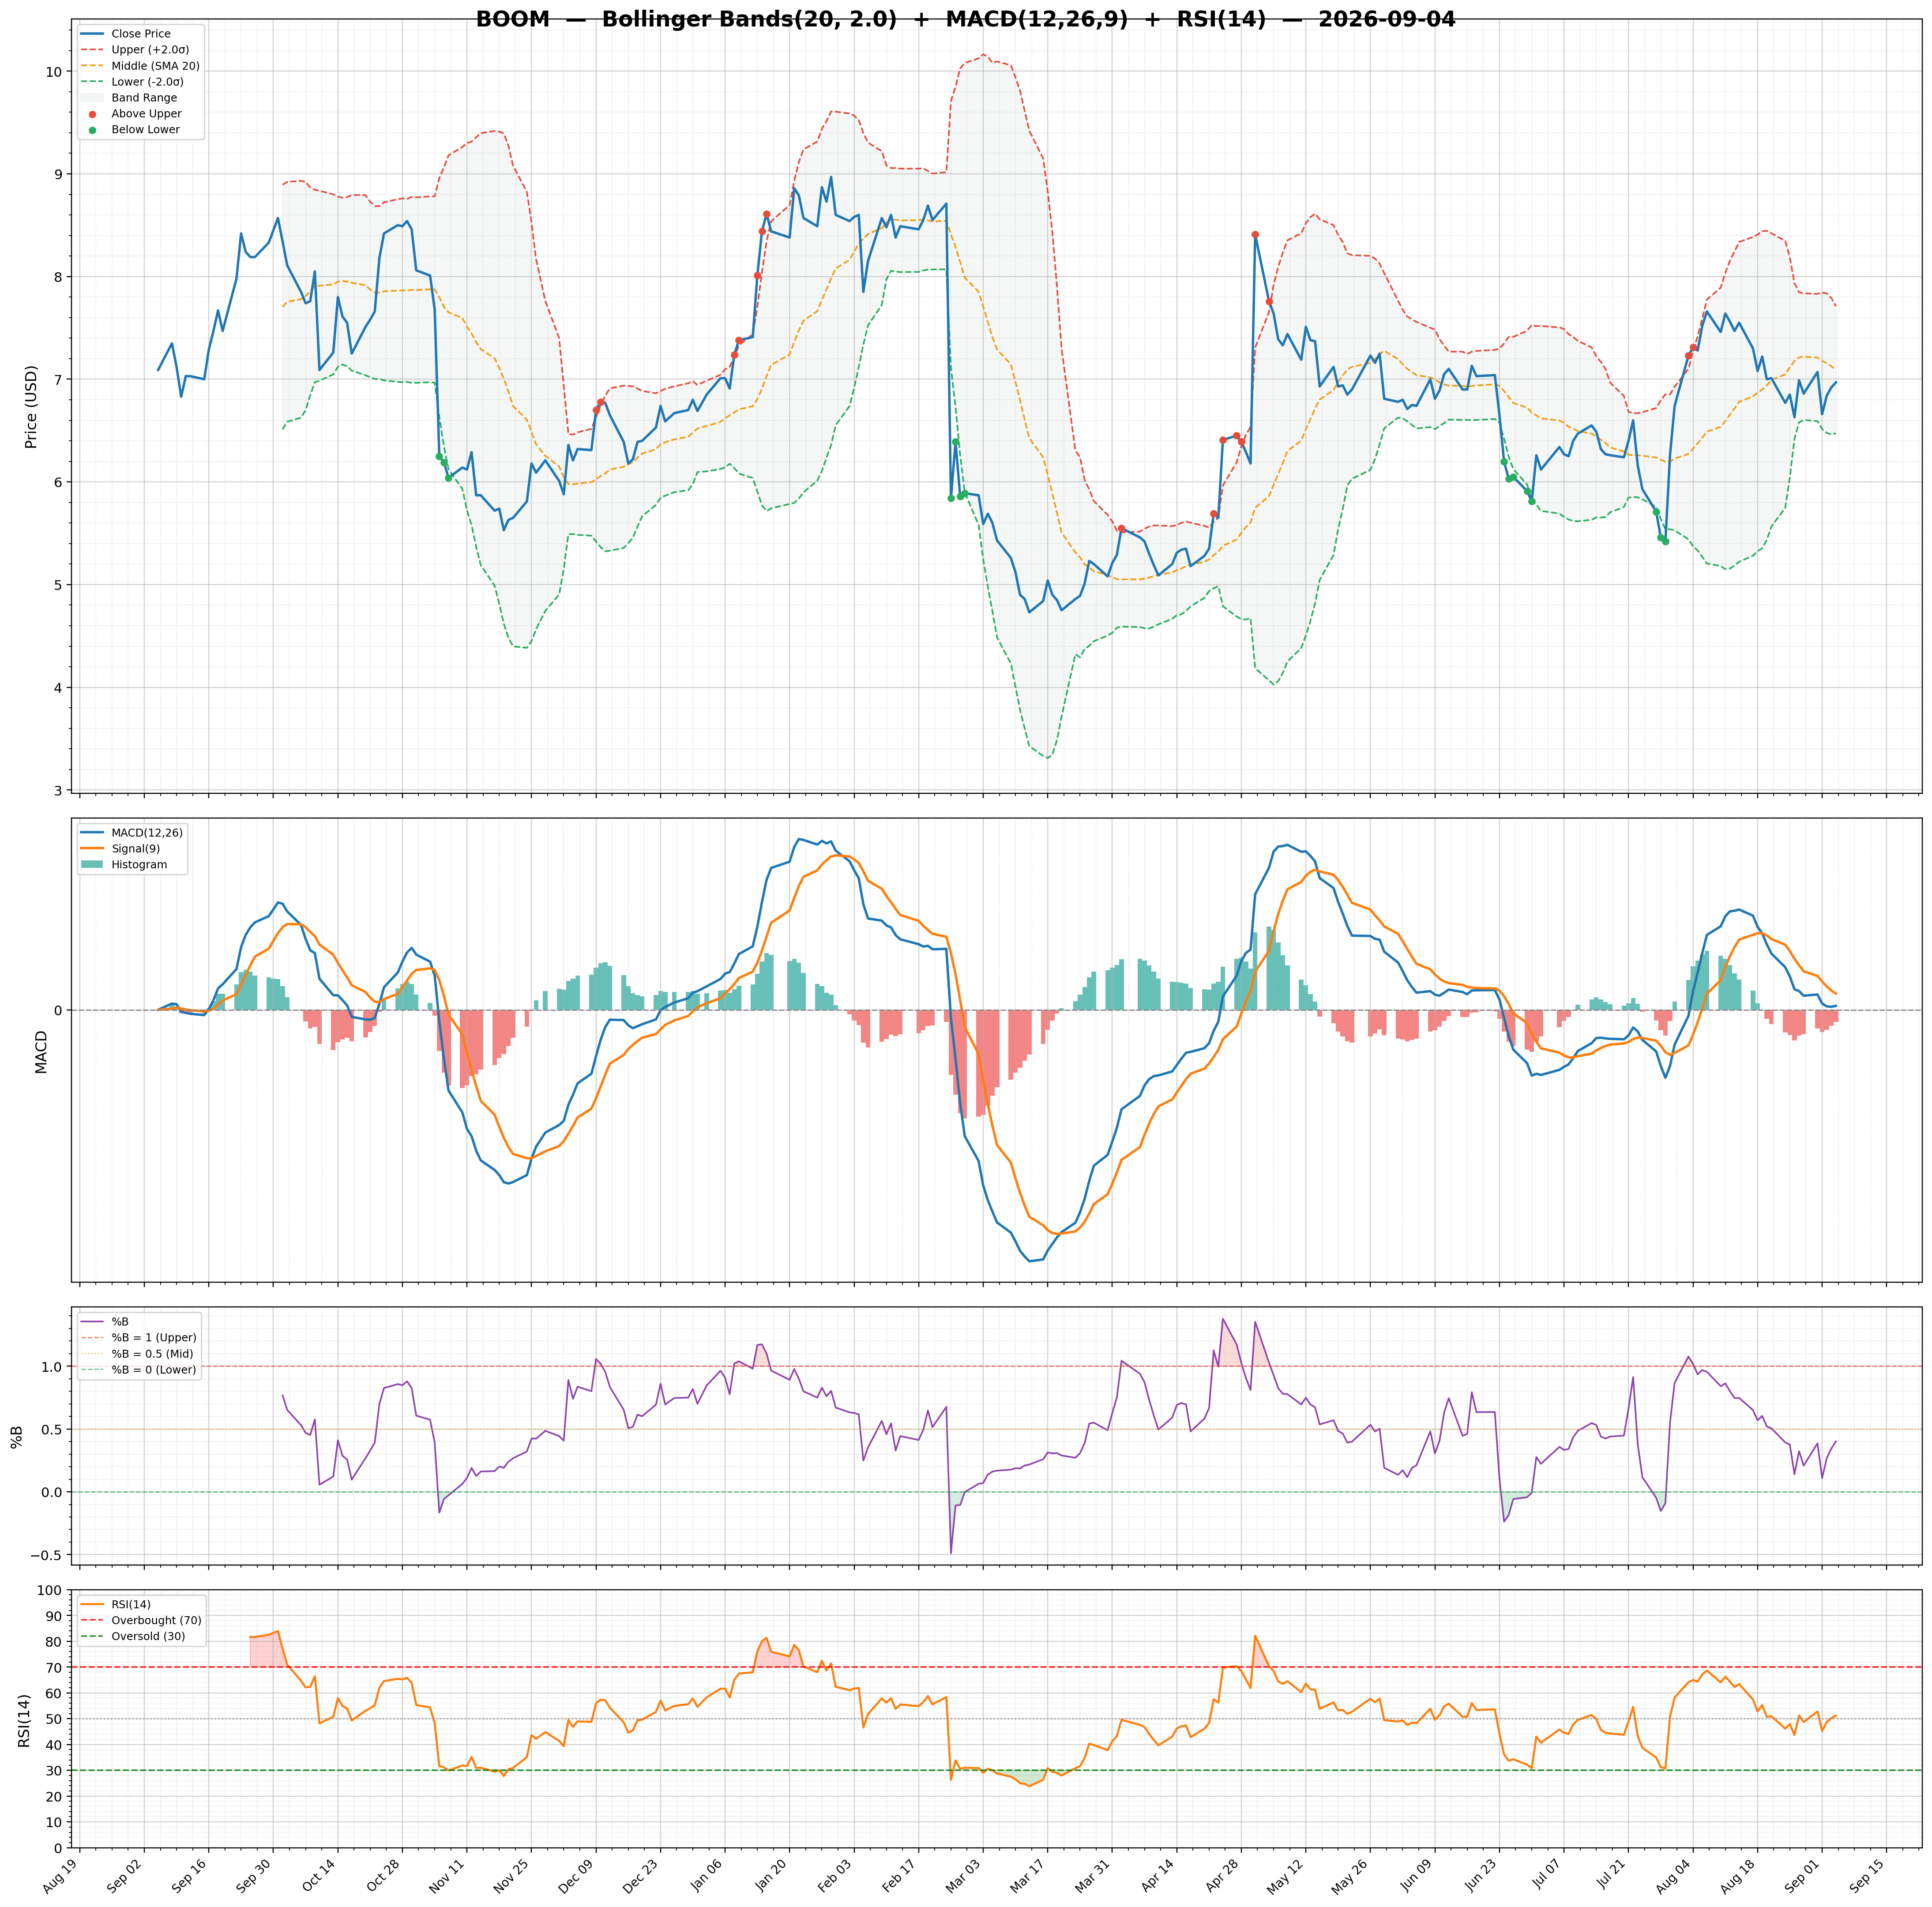
| RSI | 32.94 | Volume | 0.07M | Rating | none |
| Previous RSI | 38.51 | Avg Volume 20D | 0.11M | Target Mean | $10.00 |
| RSI Trend | Down | Relative Volume | 1.95 | Target High | $10.00 |
| MACD | -0.26 | Lower Band | 5.13 | Target Low | $10.00 |
| MACD Signal | -0.26 | Middle Band | 5.59 | Target Median | $10.00 |
| Histogram | 0.00 | Upper Band | 6.06 | Analysts | 1 |
| Previous Histogram | 0.00 | Bandwidth | 16.720 | Upside | 87.62% |
| Histogram Trend | Decreasing | %B | 0.11 | ||