Bassett Furniture Industries, I (BSET)
Consumer Cyclical • Furnishings, Fixtures & Appliances • $22.03 • MCap: 185,225,632
https://www.bassettfurniture.com • Bassett Furniture Industries, Incorporated, together with its subsidiaries, designs, manufactures, sources, distributes, and retails home furnishings and furniture products in the United States. It operates through two segments, Wholesale and Retail—Company-Owned Stores. The company offers sofas, chairs, reclining furniture, ottomans and benches, and leather furniture; tables and cabinets; dining and outdoor furniture; beds, dressers and chests, nightstands and bedside tables, mattresses and bases, duvet covers and inserts, quilts and coverlets, sheets and pillowcases, shams and pillow inserts, accent pillows, and throws; office chairs, desks, and storages; home decor products, lighting, wall decor, mirrors, cabinet hardware, and cutting boards; and rugs. It is also involved in wood and upholstery operations. The company sells its products through a network of company-owned and licensee-owned stores under the Bassett Home Furnishings name; and independent retailers; multi-line furniture stores, including Bassett galleries or design centers; and online. Bassett Furniture Industries, Incorporated was founded in 1902 and is based in Bassett, Virginia.
Ex-AAII
| Score | Price | 52 Week & Averages | Relative Strength | Risk | |||||
|---|---|---|---|---|---|---|---|---|---|
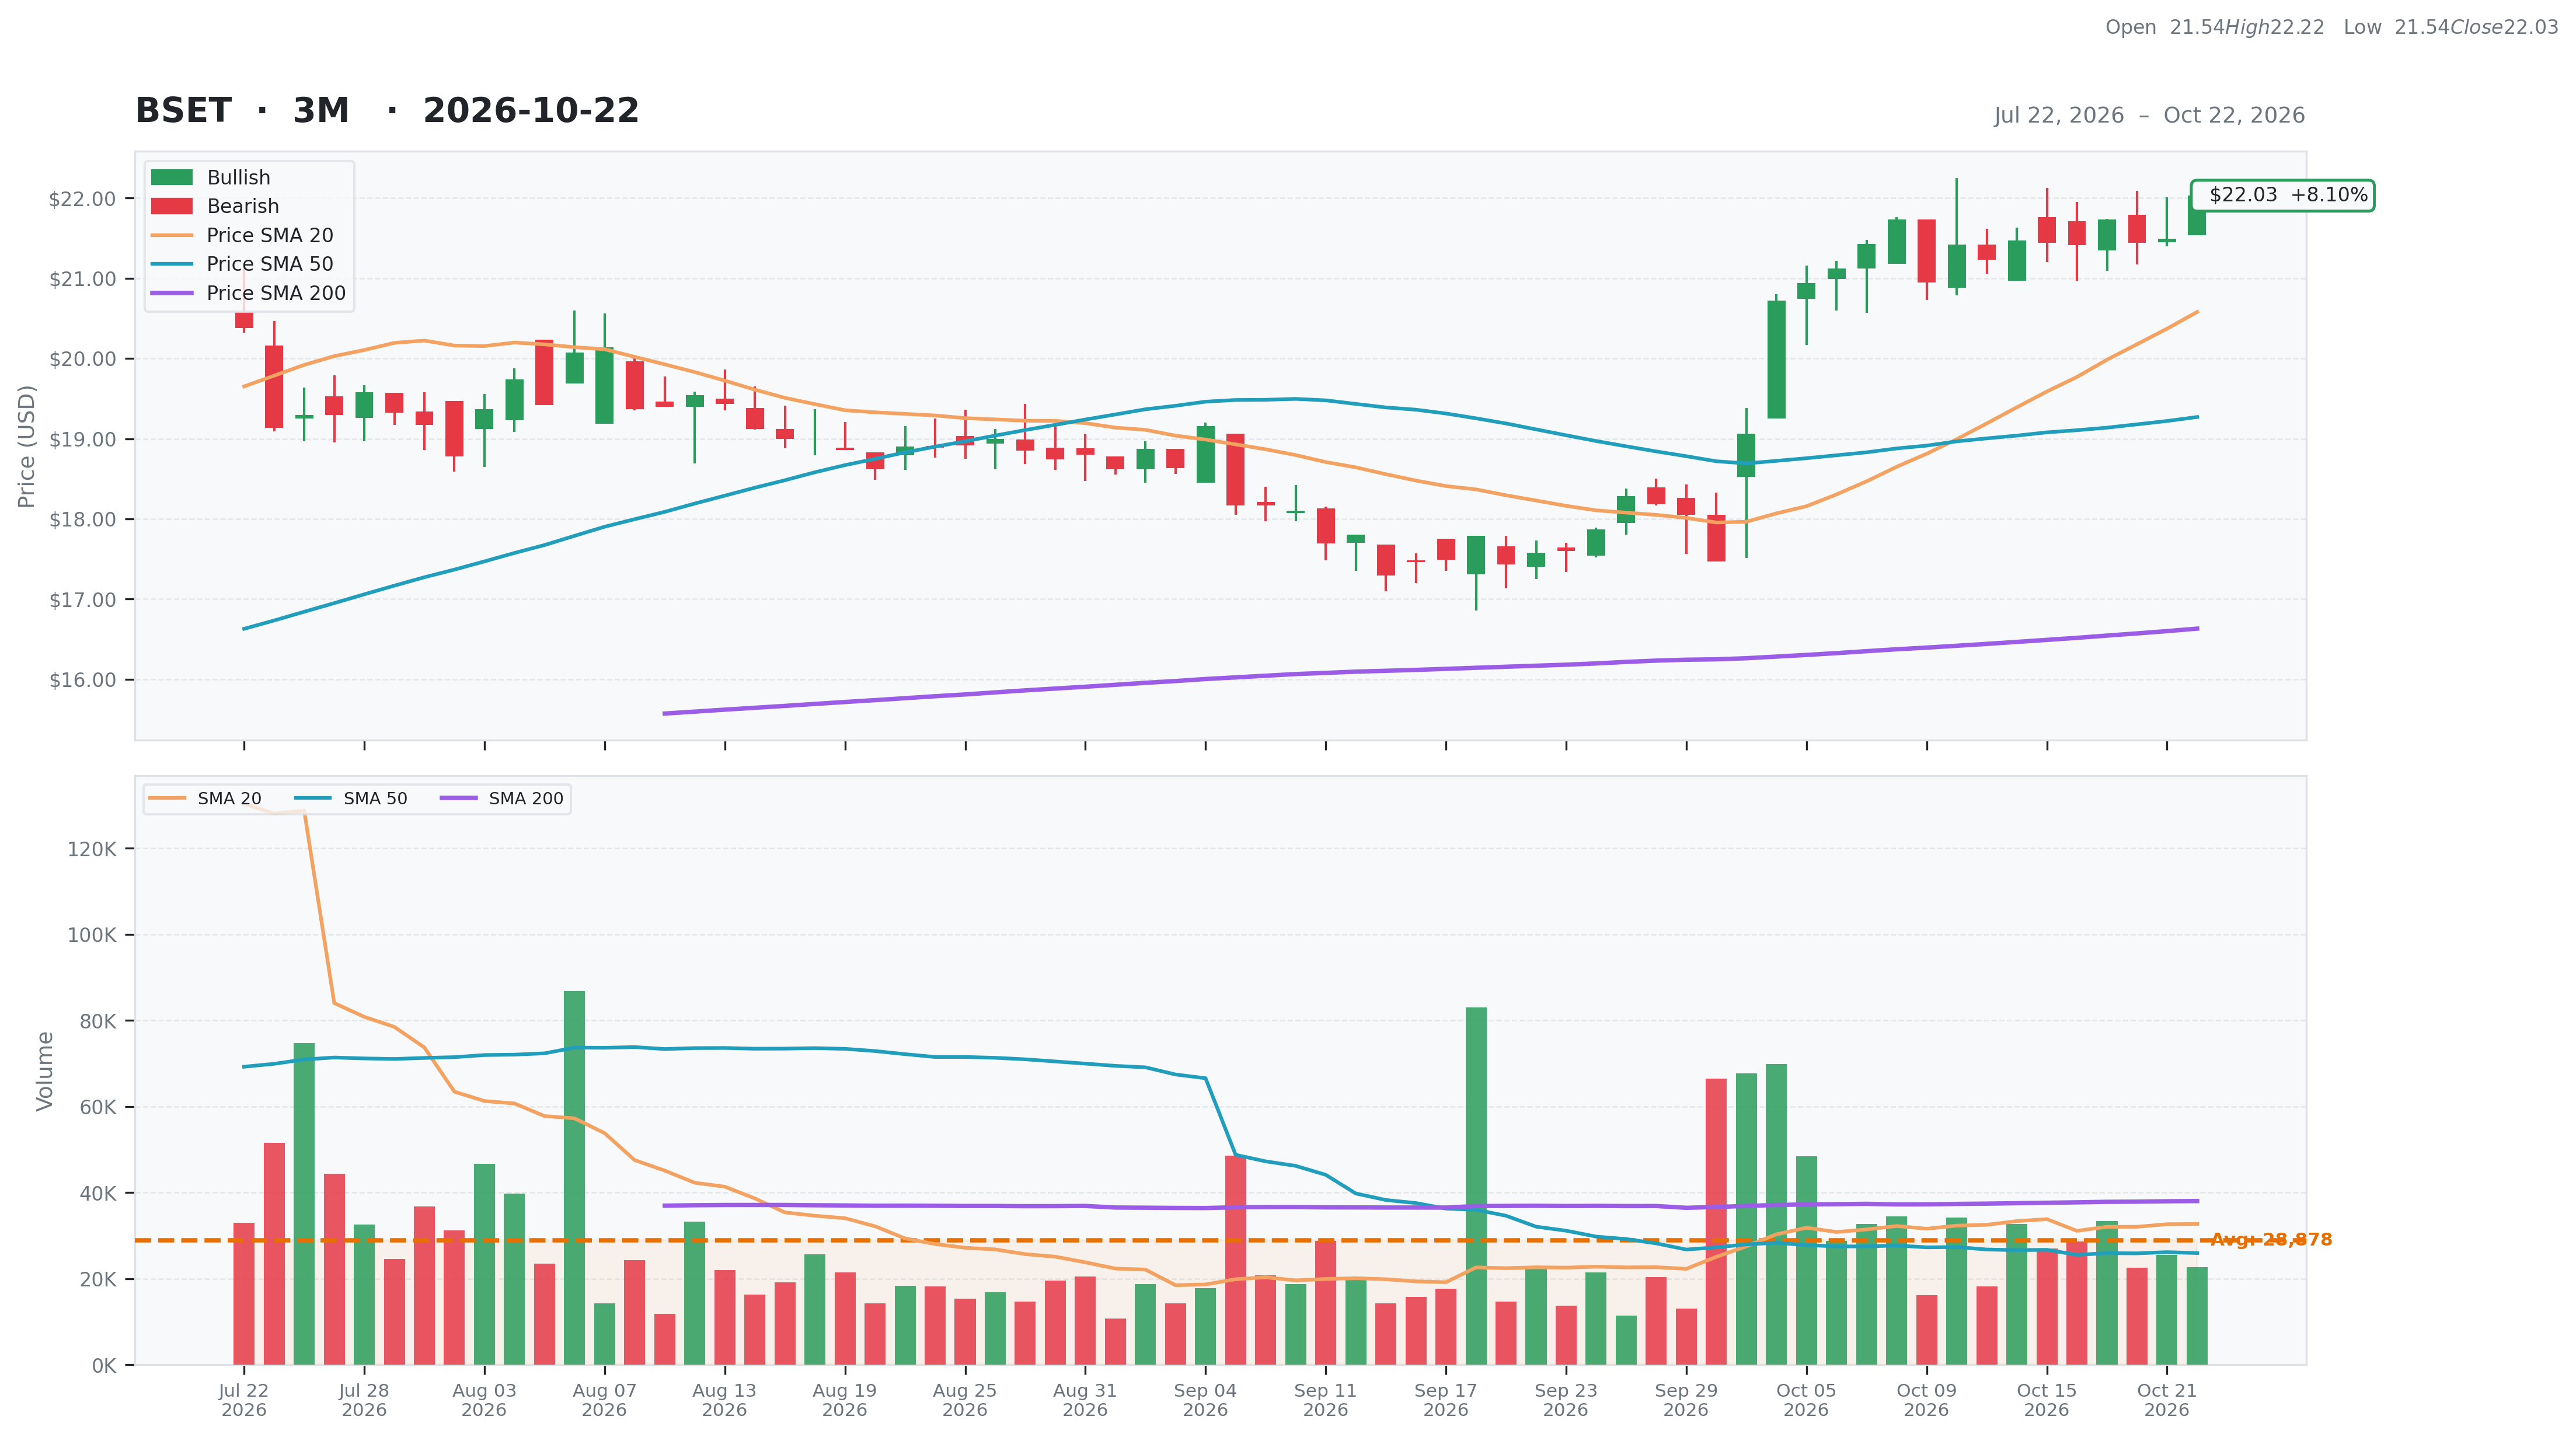
| Total | 62 | Current | $22.03 | 52W High | $22.03 0.00% | Relative Strength | 0.34 | Beta | 0.68 |
| Business Quality | 10 | Weekly | $21.44 2.75% | 52W Low | $13.59 62.14% | 3M | 0.14 | Short % | 0.01 |
| Financial Strength | 10 | Monthly | $17.58 25.31% | Above 50DMA | $19.27 14.32% | 6M | 0.51 | Risk Score | 4 |
| Growth Outlook | 15 | Quarterly | $19.29 14.20% | Above 200DMA | $16.63 32.47% | 9M | 0.39 | ||
| Momentum | 4 | Yearly | $14.42 52.81% | 12M | 0.52 | ||||
| Valuation | Financial Strength | Growth/Profitability | |||
|---|---|---|---|---|---|
| Trailing P/E | 27.45 | Cash | 53M | Revenue Growth | 0.03% |
| Forward P/E | 15.92 | Debt | 83M | Earnings Growth | 1.67% |
| PEG Ratio | 0.84 | Debt/Equity | 50.15 | Qtr Earnings Growth | 1.62% |
| Price/Sales | 0.55 | Current Ratio | 1.95 | Gross Margin | 0.57% |
| Price/Book | 1.12 | Quick Ratio | 0.98 | Operating Margin | 0.03% |
| EV/Revenue | 0.64 | Operating CF | 16M | Profit Margin | 0.02% |
| EV/EBITDA | 12.16 | Free CF | 9M | EBITDA Margin | 0.05% |
| Ent Value | 215M | Return on Assets | 0.02% | ||
| Return on Equity | 0.04% | ||||
| Technical | Volume & Bollinger Bands | Analyst | |||
|---|---|---|---|---|---|
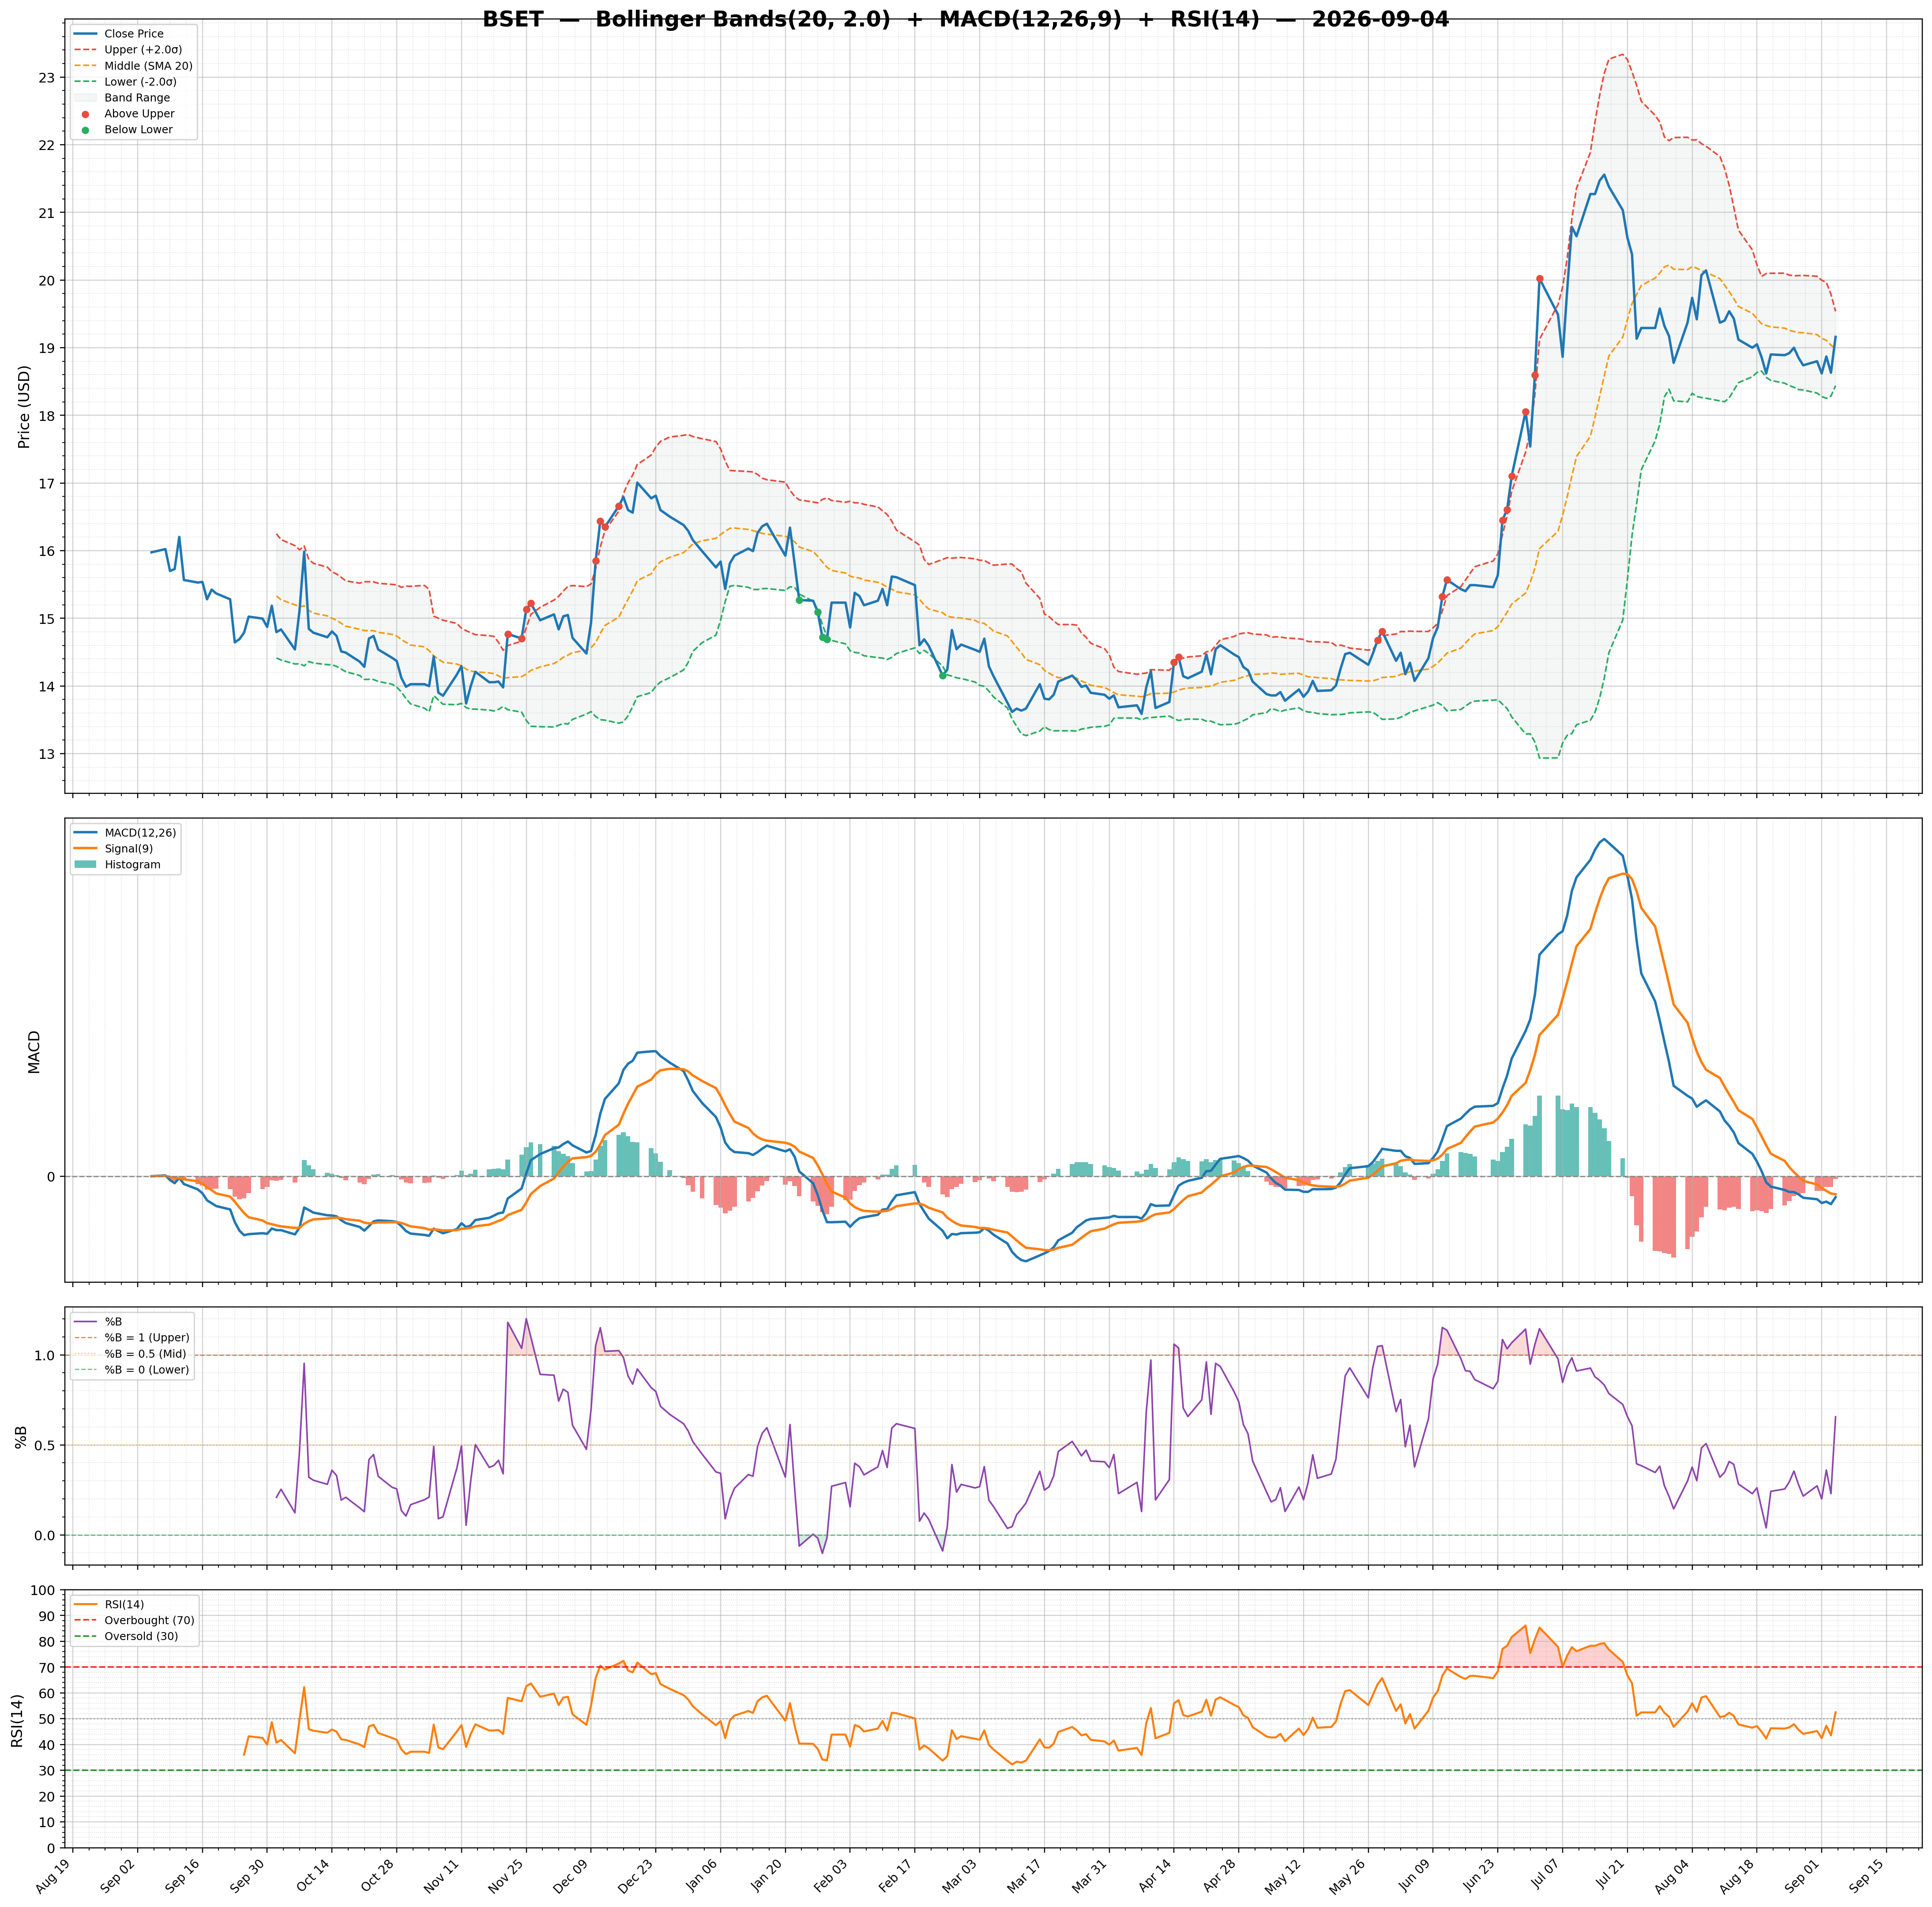
| RSI | 68.88 | Volume | 0.03M | Rating | strong_buy |
| Previous RSI | 64.86 | Avg Volume 20D | 0.03M | Target Mean | $23.00 |
| RSI Trend | Up | Relative Volume | 0.75 | Target High | $24.00 |
| MACD | 0.82 | Lower Band | 17.66 | Target Low | $22.00 |
| MACD Signal | 0.76 | Middle Band | 20.58 | Target Median | $23.00 |
| Histogram | 0.06 | Upper Band | 23.50 | Analysts | 2 |
| Previous Histogram | 0.06 | Bandwidth | 28.340 | Upside | 7.43% |
| Histogram Trend | Decreasing | %B | 0.75 | ||