Webull Corporation (BULL)
Technology • Software - Application • $5.91 • MCap: 3,275,925,760
https://www.webullcorp.com • Webull Corporation operates as a digital investment platform. The company offers various products and services, including trading, wealth management product distribution, market data and information, user community, and investor education. Its platform enables retail investors to trade securities through its licensed broker dealer in the United States, Canada, the United Kingdom, Australia, Hong Kong, Indonesia, Singapore, Malaysia, Thailand, Japan, South Africa, the Netherlands, and internationally. Webull Corporation was founded in 2016 and is headquartered in Saint Petersburg, Florida.
ET
| Score | Price | 52 Week & Averages | Relative Strength | Risk | |||||
|---|---|---|---|---|---|---|---|---|---|
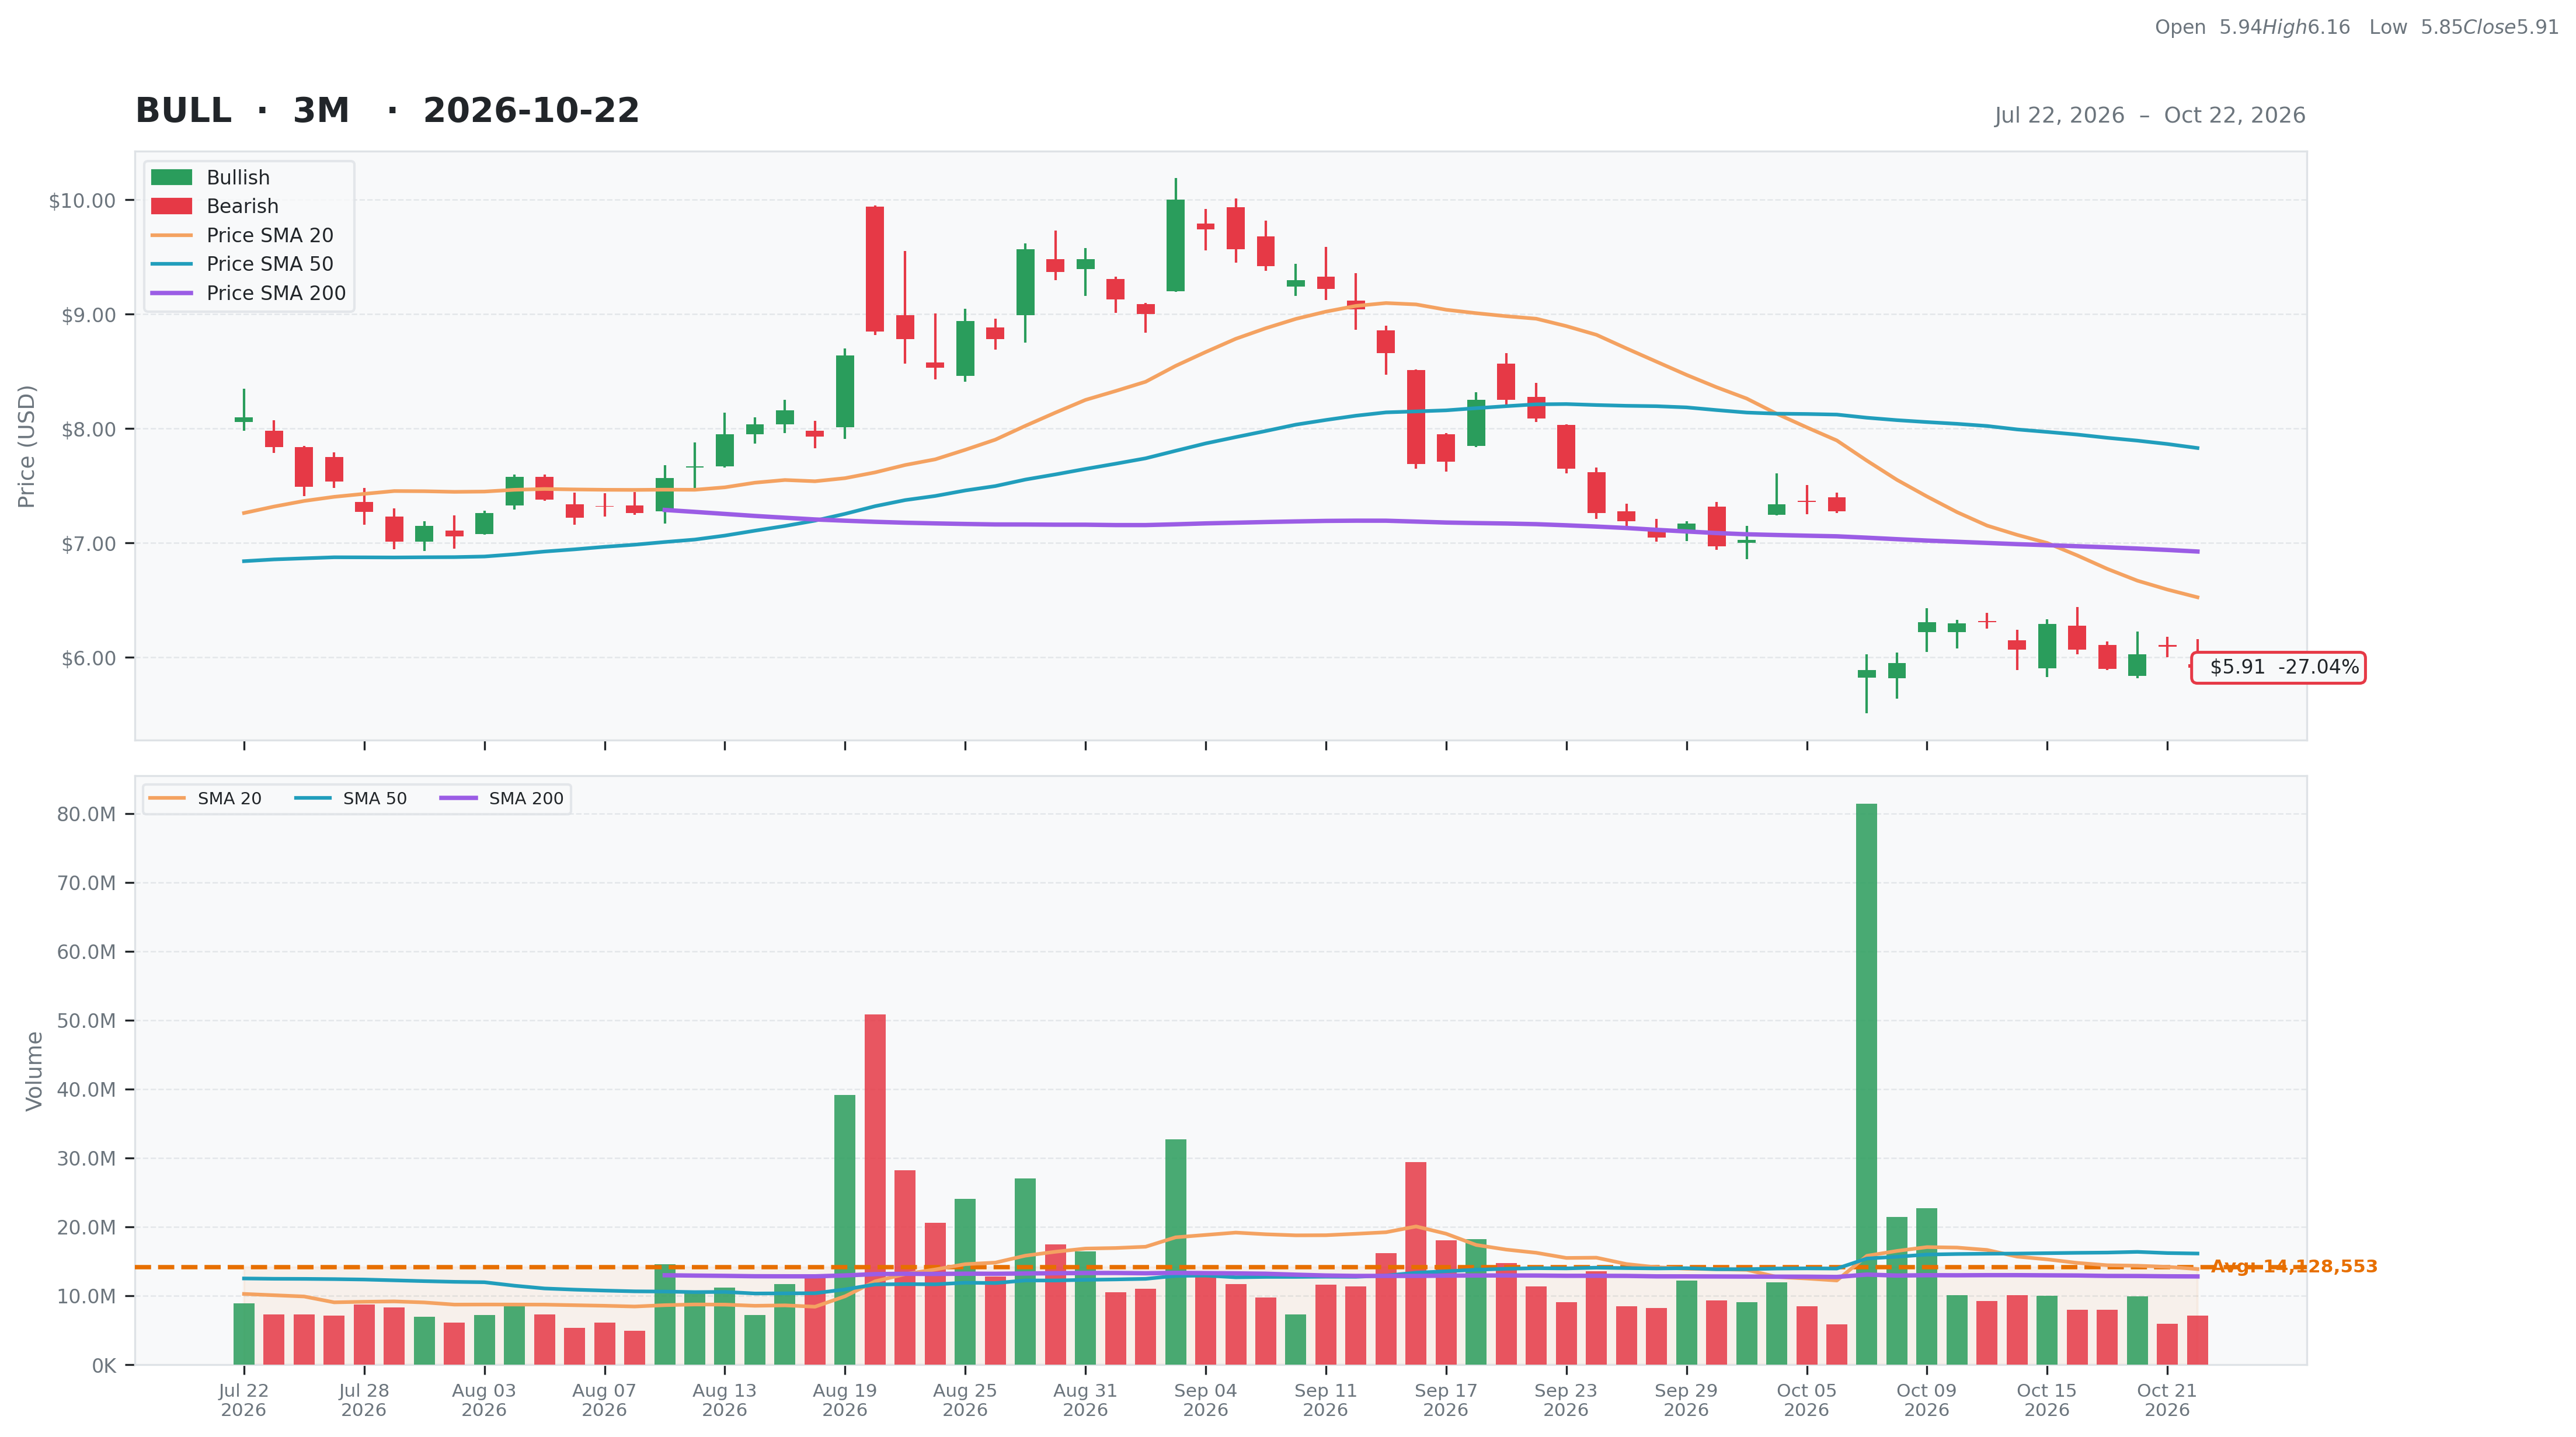
| Total | 57 | Current | $5.91 | 52W High | $11.57 -48.92% | Relative Strength | -0.26 | Beta | 0.64 |
| Business Quality | 20 | Weekly | $6.30 -6.12% | 52W Low | $4.63 27.65% | 3M | -0.21 | Short % | 0.09 |
| Financial Strength | 12 | Monthly | $8.09 -26.95% | Above 50DMA | $7.83 -24.52% | 6M | -0.14 | Risk Score | |
| Growth Outlook | 5 | Quarterly | $7.49 -21.09% | Above 200DMA | $6.93 -14.67% | 9M | -0.25 | ||
| Momentum | 2 | Yearly | $11.57 -48.92% | 12M | -0.49 | ||||
| Valuation | Financial Strength | Growth/Profitability | |||
|---|---|---|---|---|---|
| Trailing P/E | 75.88 | Cash | 1,926M | Revenue Growth | 0.52% |
| Forward P/E | 19.58 | Debt | 79M | Earnings Growth | N/A |
| PEG Ratio | N/A | Debt/Equity | 7.54 | Qtr Earnings Growth | N/A |
| Price/Sales | 4.87 | Current Ratio | 1.21 | Gross Margin | 0.77% |
| Price/Book | 3.08 | Quick Ratio | 1.19 | Operating Margin | 0.22% |
| EV/Revenue | 2.04 | Operating CF | 43M | Profit Margin | 0.06% |
| EV/EBITDA | N/A | Free CF | N/A | EBITDA Margin | 0.00% |
| Ent Value | 1,369M | Return on Assets | 0.01% | ||
| Return on Equity | 0.05% | ||||
| Technical | Volume & Bollinger Bands | Analyst | |||
|---|---|---|---|---|---|
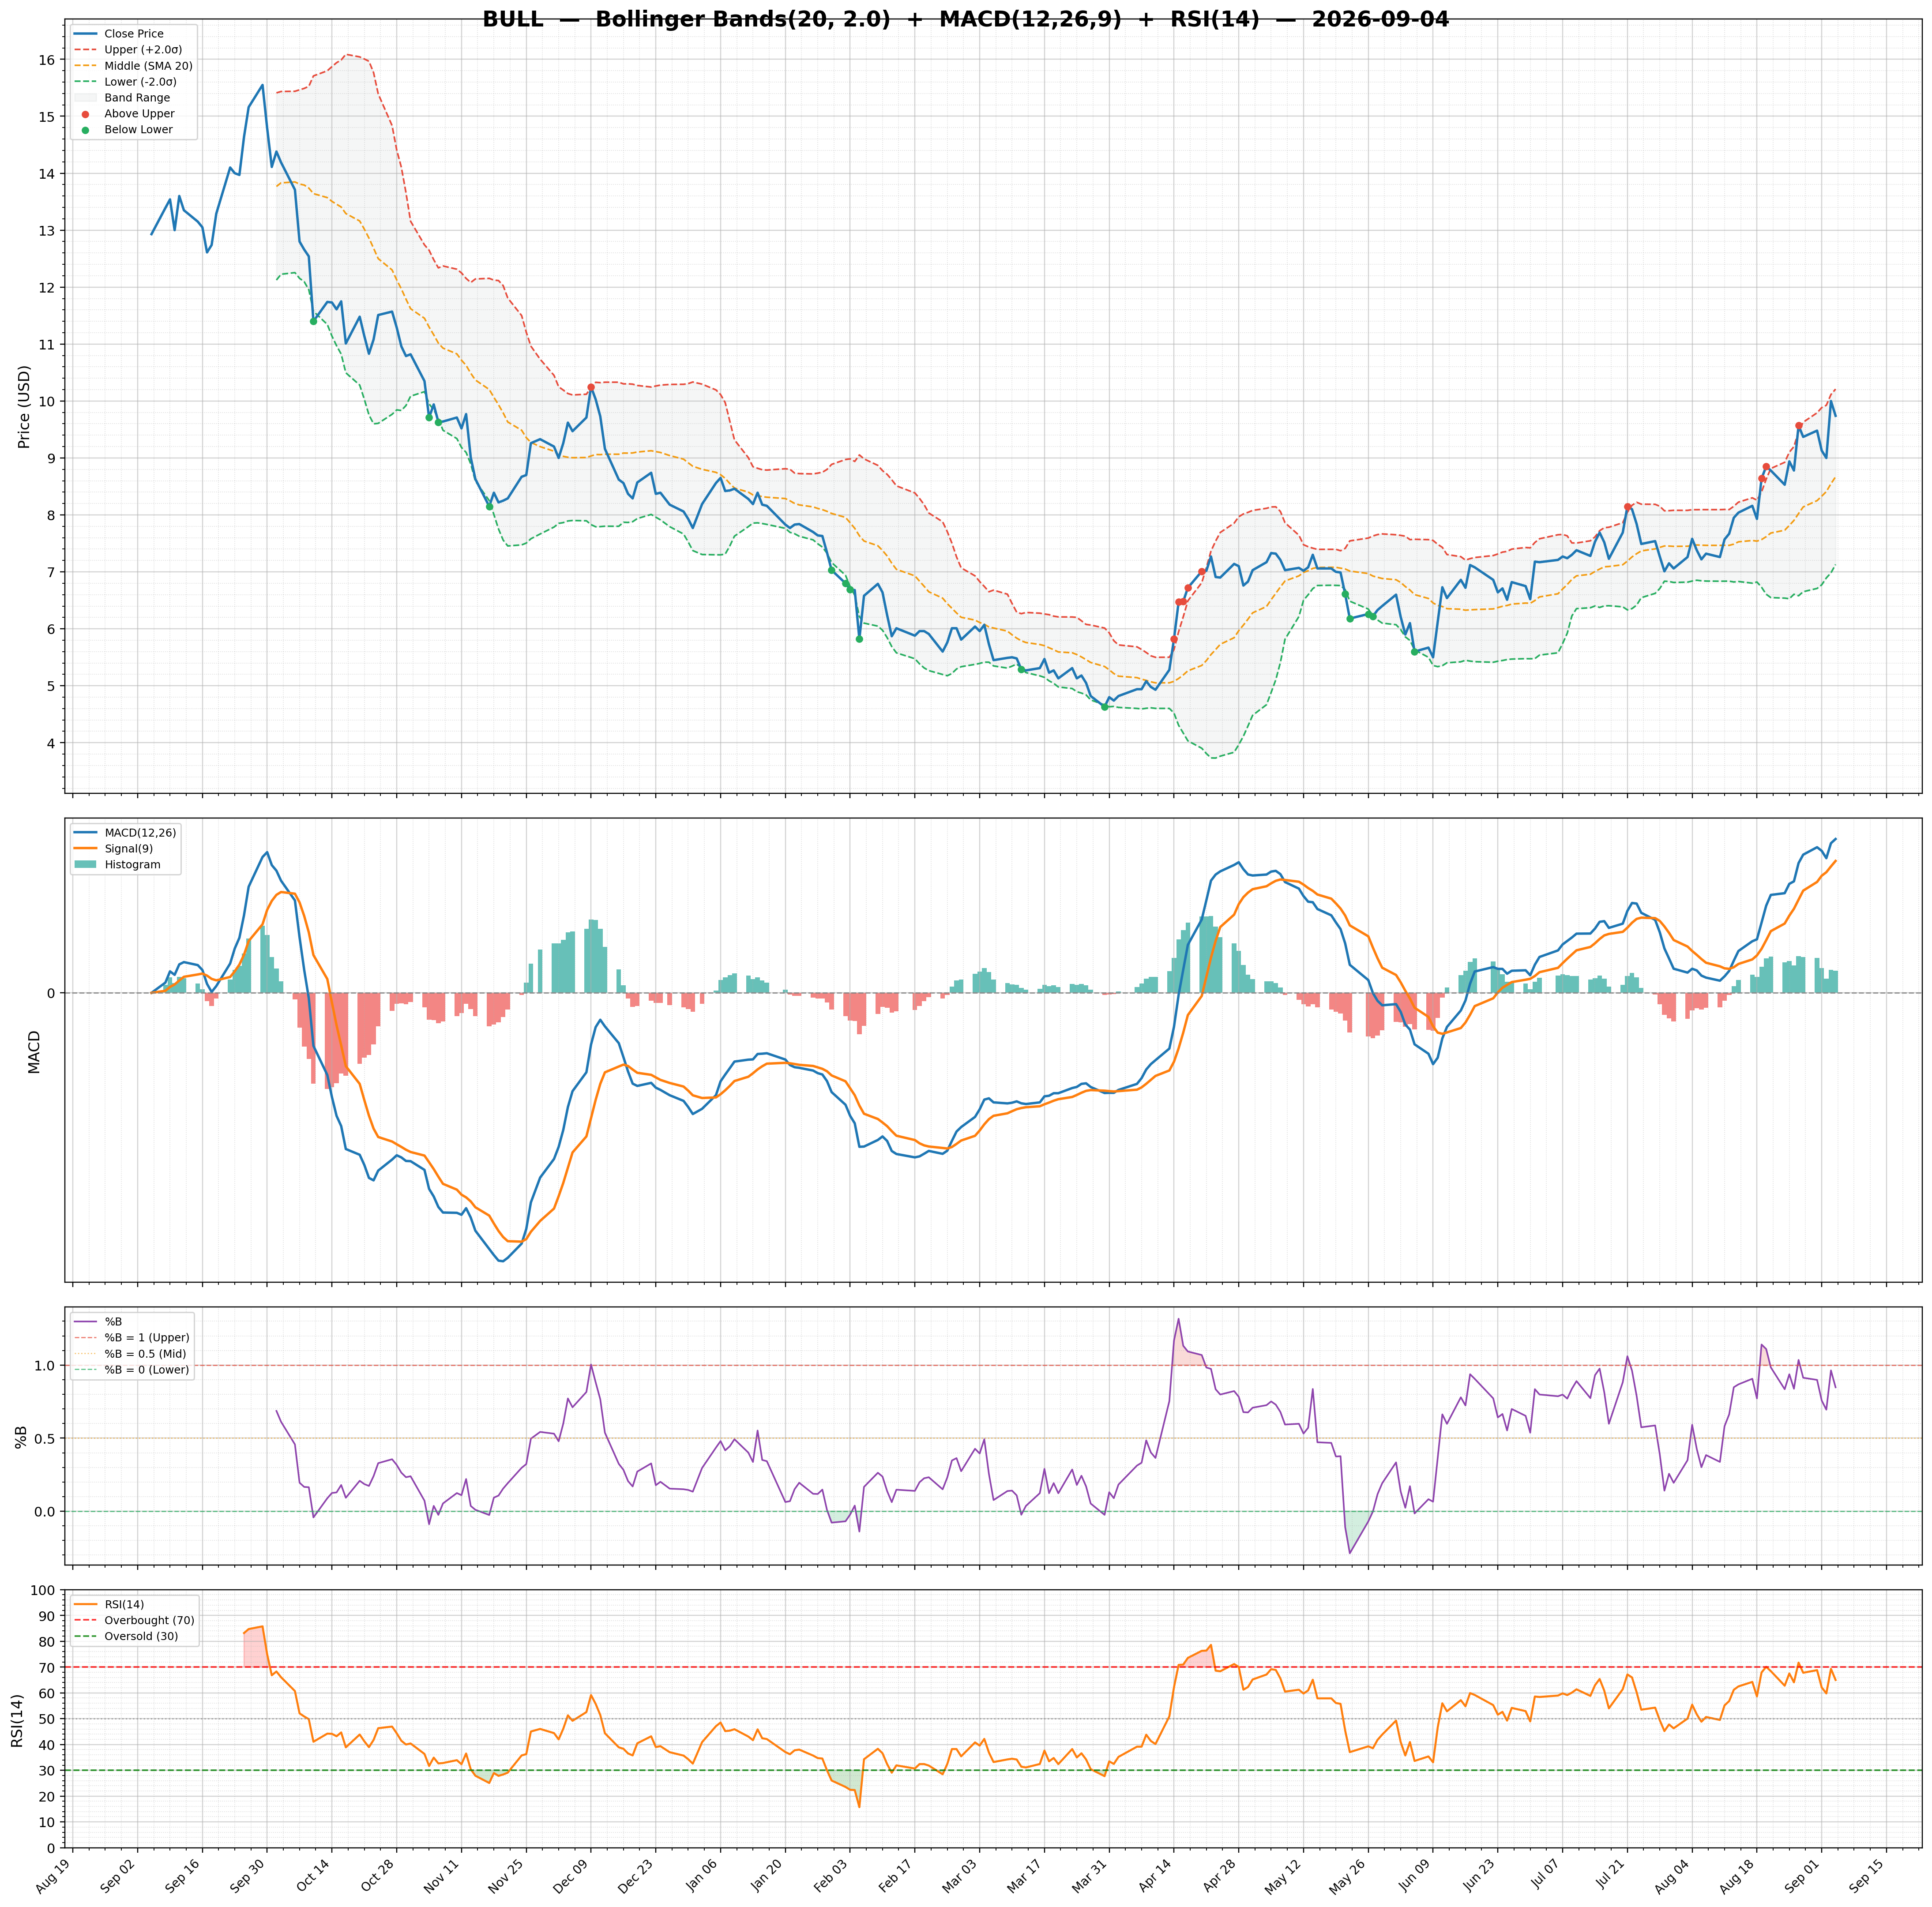
| RSI | 34.18 | Volume | 7.93M | Rating | strong_buy |
| Previous RSI | 36.37 | Avg Volume 20D | 13.89M | Target Mean | $11.25 |
| RSI Trend | Down | Relative Volume | 0.49 | Target High | $12.00 |
| MACD | -0.53 | Lower Band | 5.40 | Target Low | $9.00 |
| MACD Signal | -0.53 | Middle Band | 6.53 | Target Median | $12.00 |
| Histogram | 0.00 | Upper Band | 7.66 | Analysts | 4 |
| Previous Histogram | -0.00 | Bandwidth | 34.620 | Upside | 85.34% |
| Histogram Trend | Increasing | %B | 0.23 | ||