Cal-Maine Foods, Inc. (CALM)
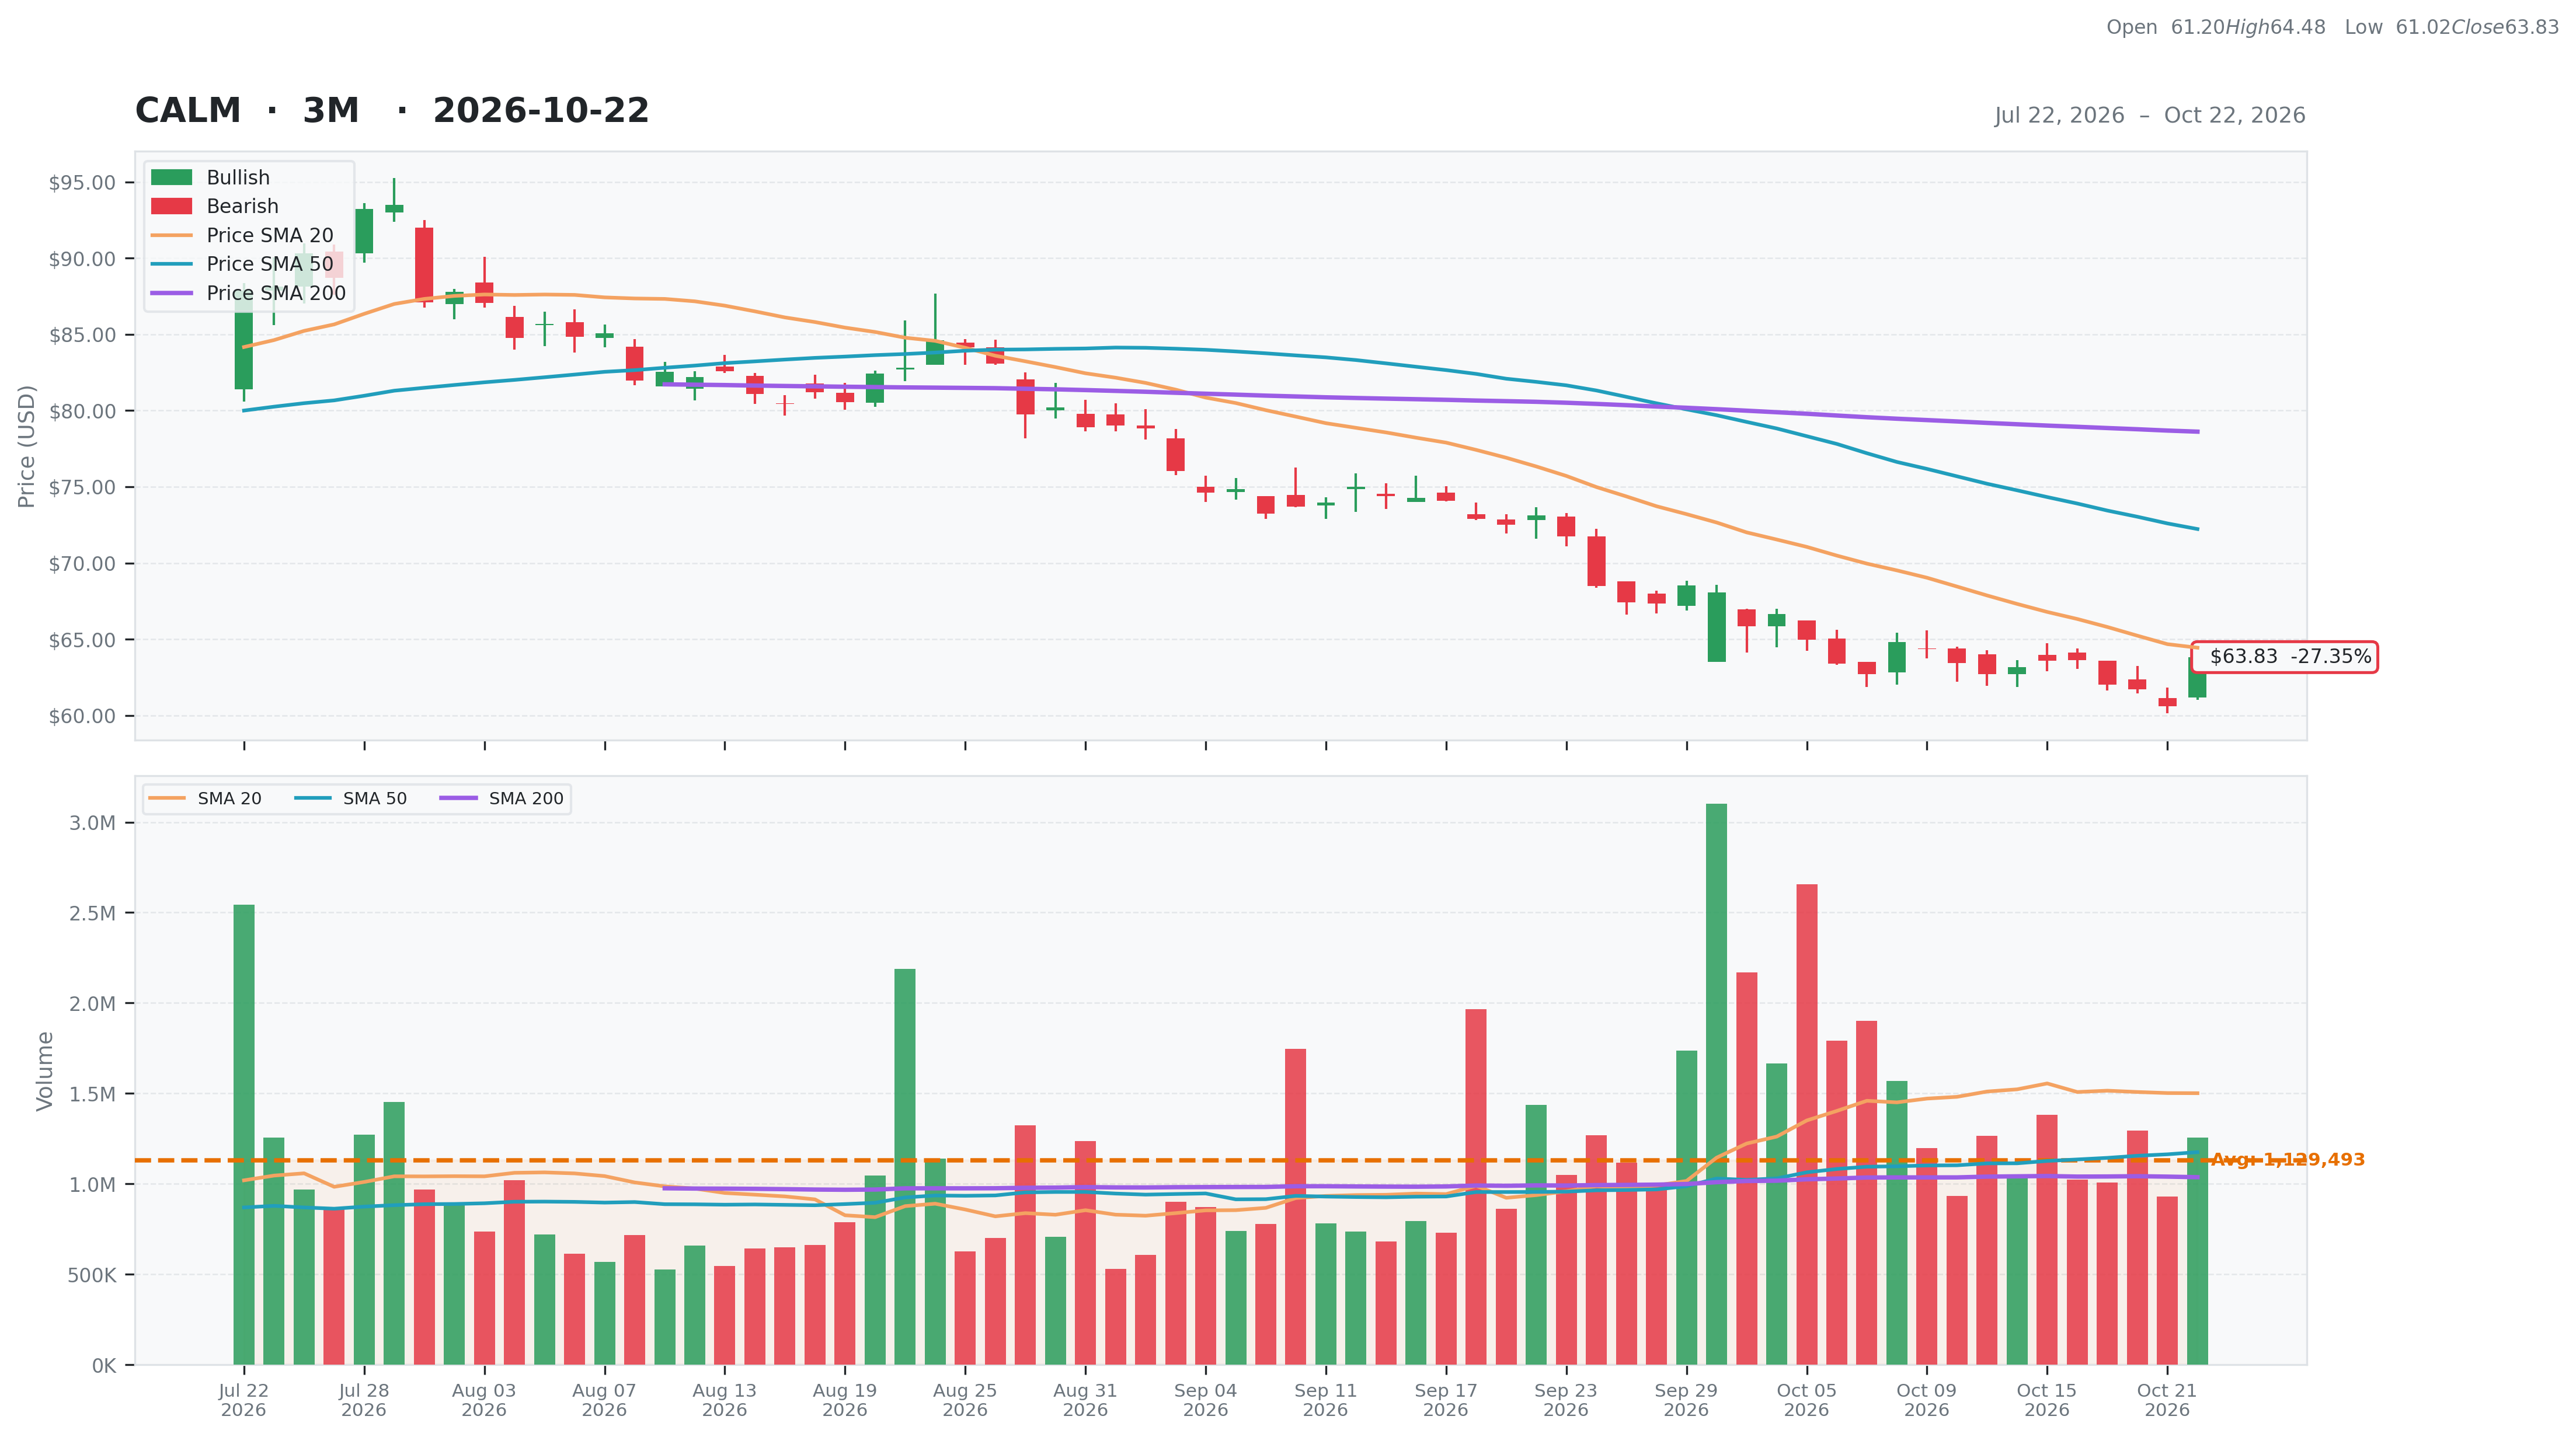
Consumer Defensive • Farm Products • $63.83 • MCap: 2,973,130,496
https://www.calmainefoods.com • Cal-Maine Foods, Inc., together with its subsidiaries, engages in the production, grading, packaging, marketing, and distribution of shell eggs, egg products, and prepared foods in the United Sates. It operates through Conventional Shell Eggs, Specialty Shell Eggs, and Prepared Foods segments. The company offers specialty shell eggs, including cage-free, organic, brown, free-range, and pasture-raised and nutritionally enhanced eggs, as well as conventional and co-pack shell eggs. It also provides prepared food products, such as pre-cooked egg patties, omelets, folded and scrambled egg formats, hard-cooked eggs, pancakes, waffles, and specialty wraps. The company offers its products under the Egg-Land's Best, Land O' Lakes, Farmhouse Eggs, Sunups, 4Grain, Van's, MeadowCreek Foods, and Crepini brand names. It sells its products to various customers, including national and regional grocery store chains, club stores, independent supermarkets, foodservice distributors, and egg product consumers. Cal-Maine Foods, Inc. was founded in 1957 and is headquartered in Ridgeland, Mississippi.
ET
| Score | Price | 52 Week & Averages | Relative Strength | Risk | |||||
|---|---|---|---|---|---|---|---|---|---|
| Total | 20 | Current | $63.83 | 52W High | $93.50 -31.73% | Relative Strength | -0.24 | Beta | 0.23 |
| Business Quality | 1 | Weekly | $63.59 0.38% | 52W Low | $60.61 5.31% | 3M | -0.29 | Short % | 0.14 |
| Financial Strength | 9 | Monthly | $73.13 -12.72% | Above 50DMA | $72.23 -11.63% | 6M | -0.16 | Risk Score | 6 |
| Growth Outlook | 1 | Quarterly | $90.32 -29.33% | Above 200DMA | $78.62 -18.81% | 9M | -0.21 | ||
| Momentum | 0 | Yearly | $87.91 -27.39% | 12M | -0.27 | ||||
| Valuation | Financial Strength | Growth/Profitability | |||
|---|---|---|---|---|---|
| Trailing P/E | 51.75 | Cash | 768M | Revenue Growth | -0.42% |
| Forward P/E | 62.71 | Debt | 0M | Earnings Growth | N/A |
| PEG Ratio | 2.20 | Debt/Equity | N/A | Qtr Earnings Growth | N/A |
| Price/Sales | 1.18 | Current Ratio | 7.70 | Gross Margin | 0.14% |
| Price/Book | 1.16 | Quick Ratio | 5.51 | Operating Margin | -0.15% |
| EV/Revenue | 0.88 | Operating CF | 100M | Profit Margin | 0.02% |
| EV/EBITDA | 14.92 | Free CF | -176M | EBITDA Margin | 0.06% |
| Ent Value | 2,216M | Return on Assets | 0.00% | ||
| Return on Equity | 0.02% | ||||
| Technical | Volume & Bollinger Bands | Analyst | |||
|---|---|---|---|---|---|
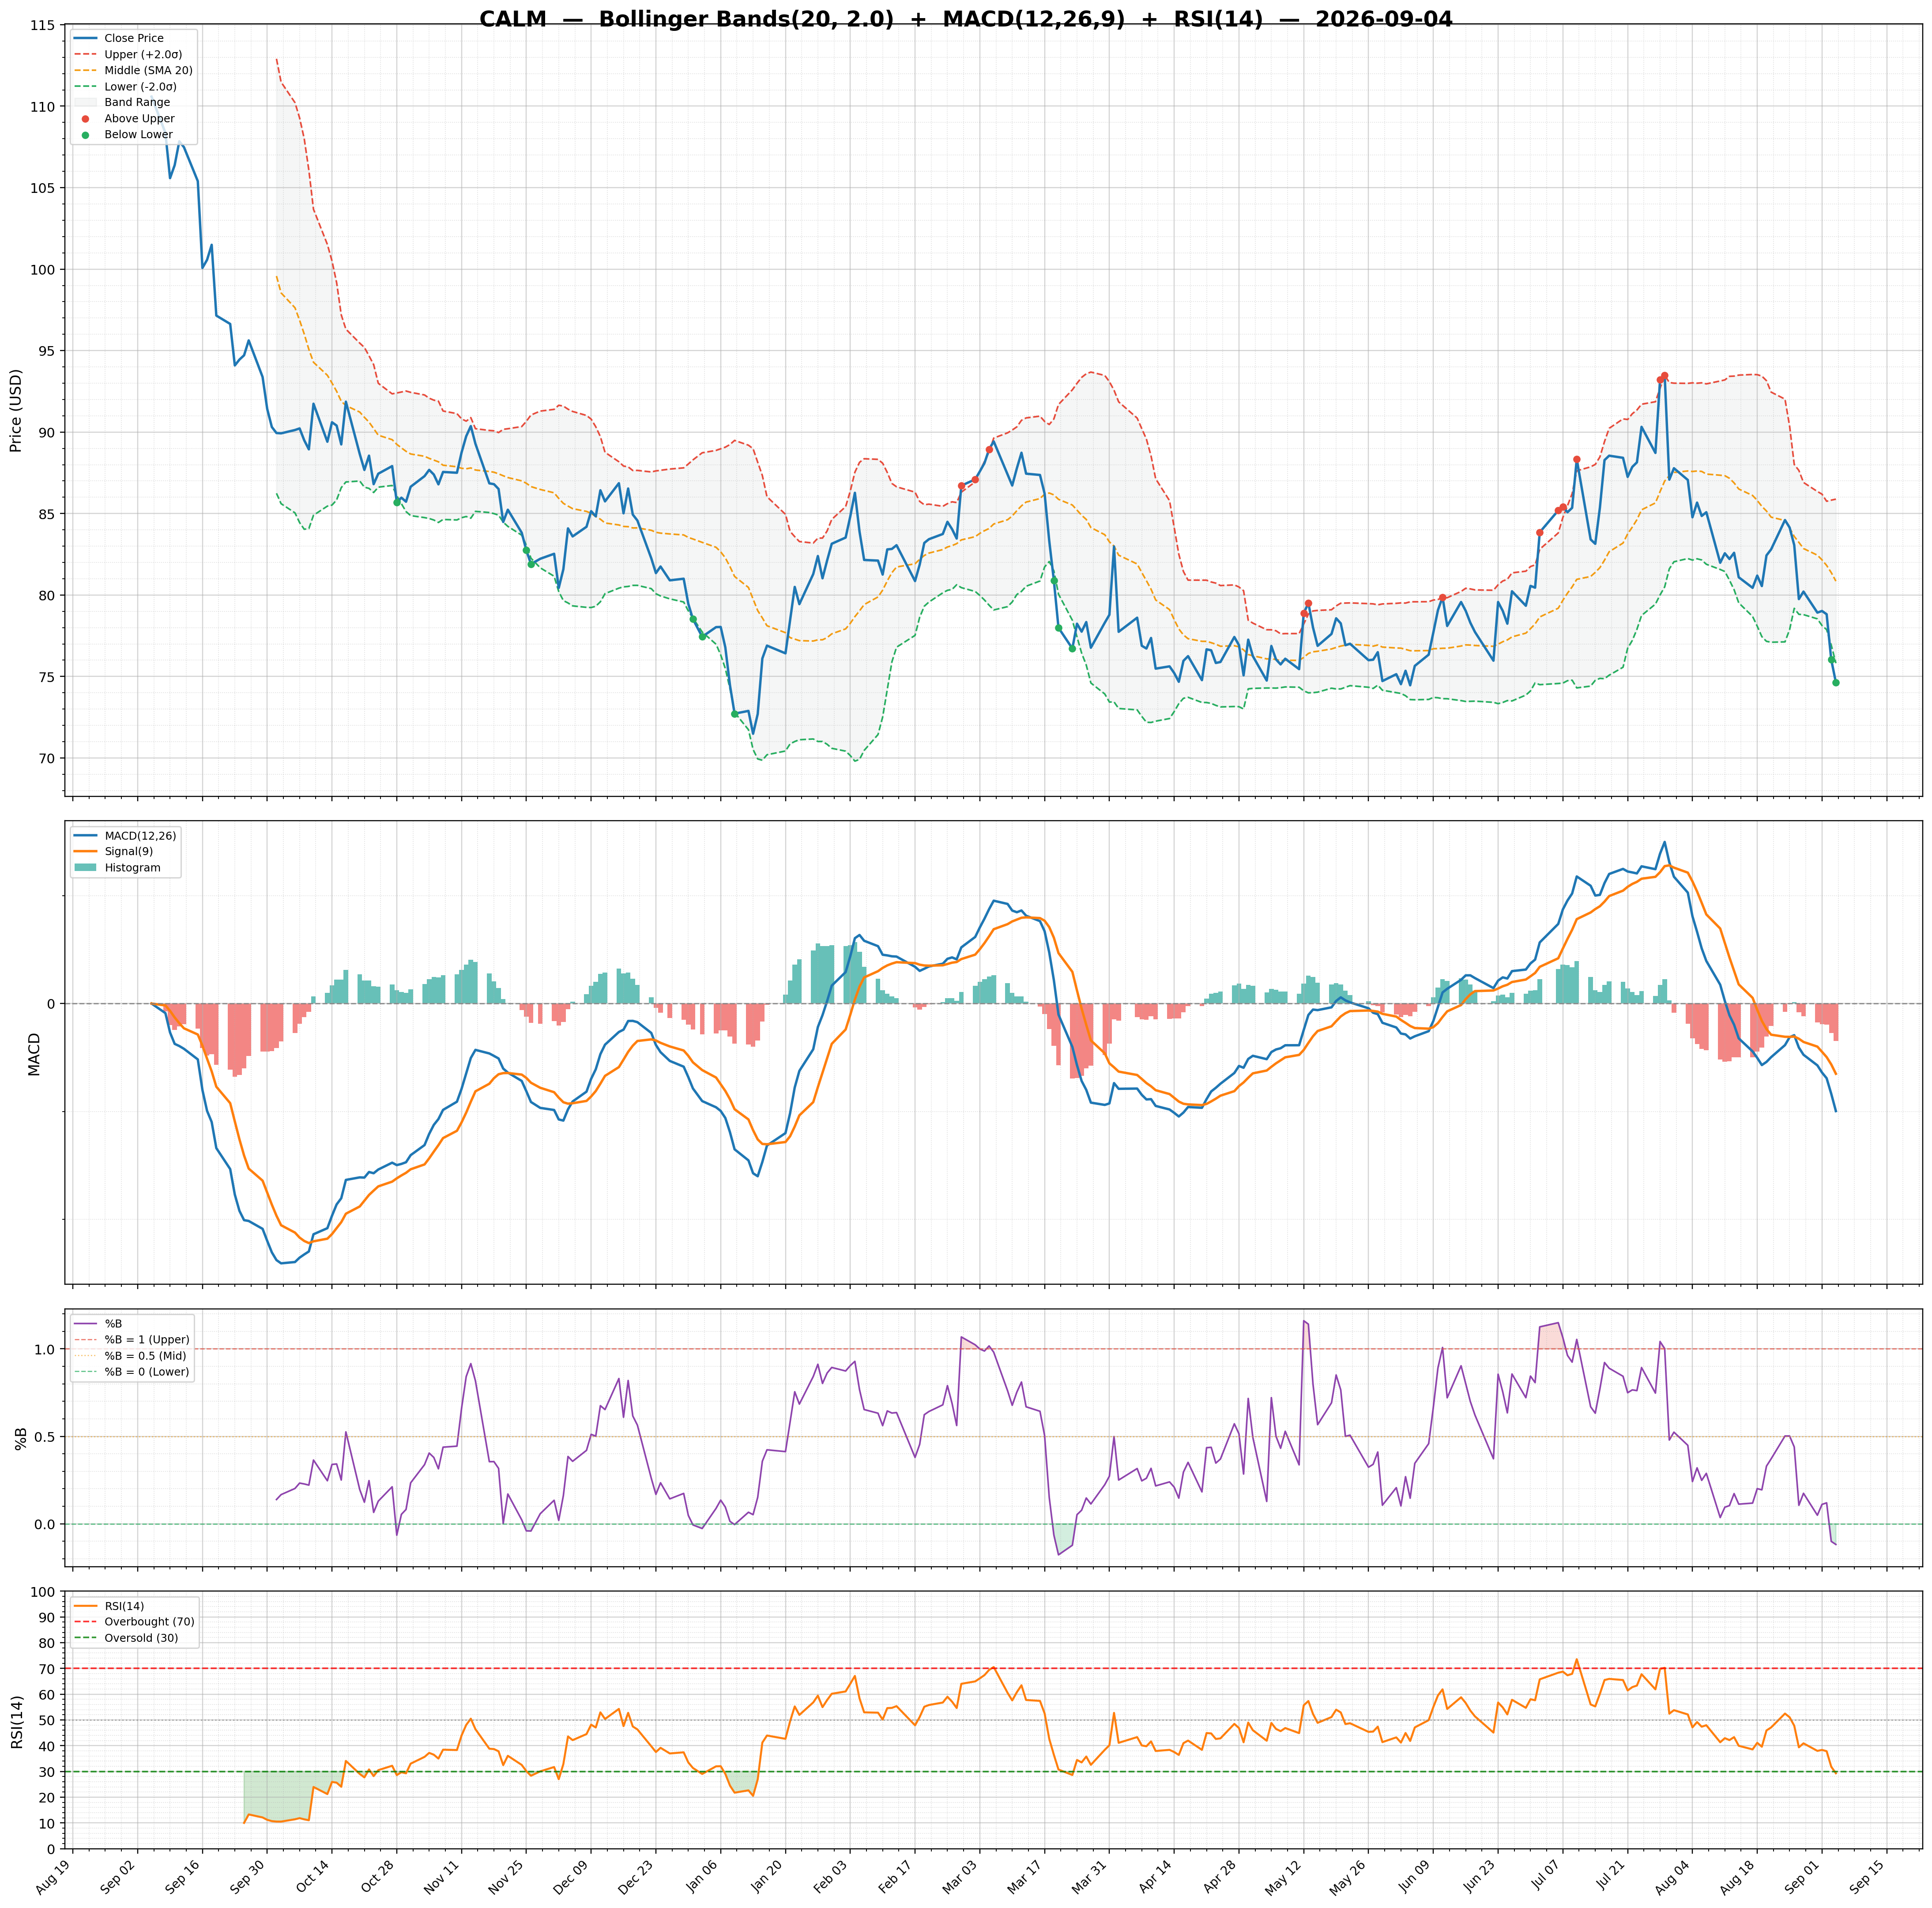
| RSI | 40.58 | Volume | 1.02M | Rating | none |
| Previous RSI | 25.01 | Avg Volume 20D | 1.5M | Target Mean | $68.33 |
| RSI Trend | Up | Relative Volume | 0.93 | Target High | $75.00 |
| MACD | -2.89 | Lower Band | 60.00 | Target Low | $60.00 |
| MACD Signal | -3.20 | Middle Band | 64.45 | Target Median | $70.00 |
| Histogram | 0.31 | Upper Band | 68.90 | Analysts | 3 |
| Previous Histogram | 0.12 | Bandwidth | 13.810 | Upside | 7.36% |
| Histogram Trend | Increasing | %B | 0.43 | ||