CECO Environmental Corp. (CECO)
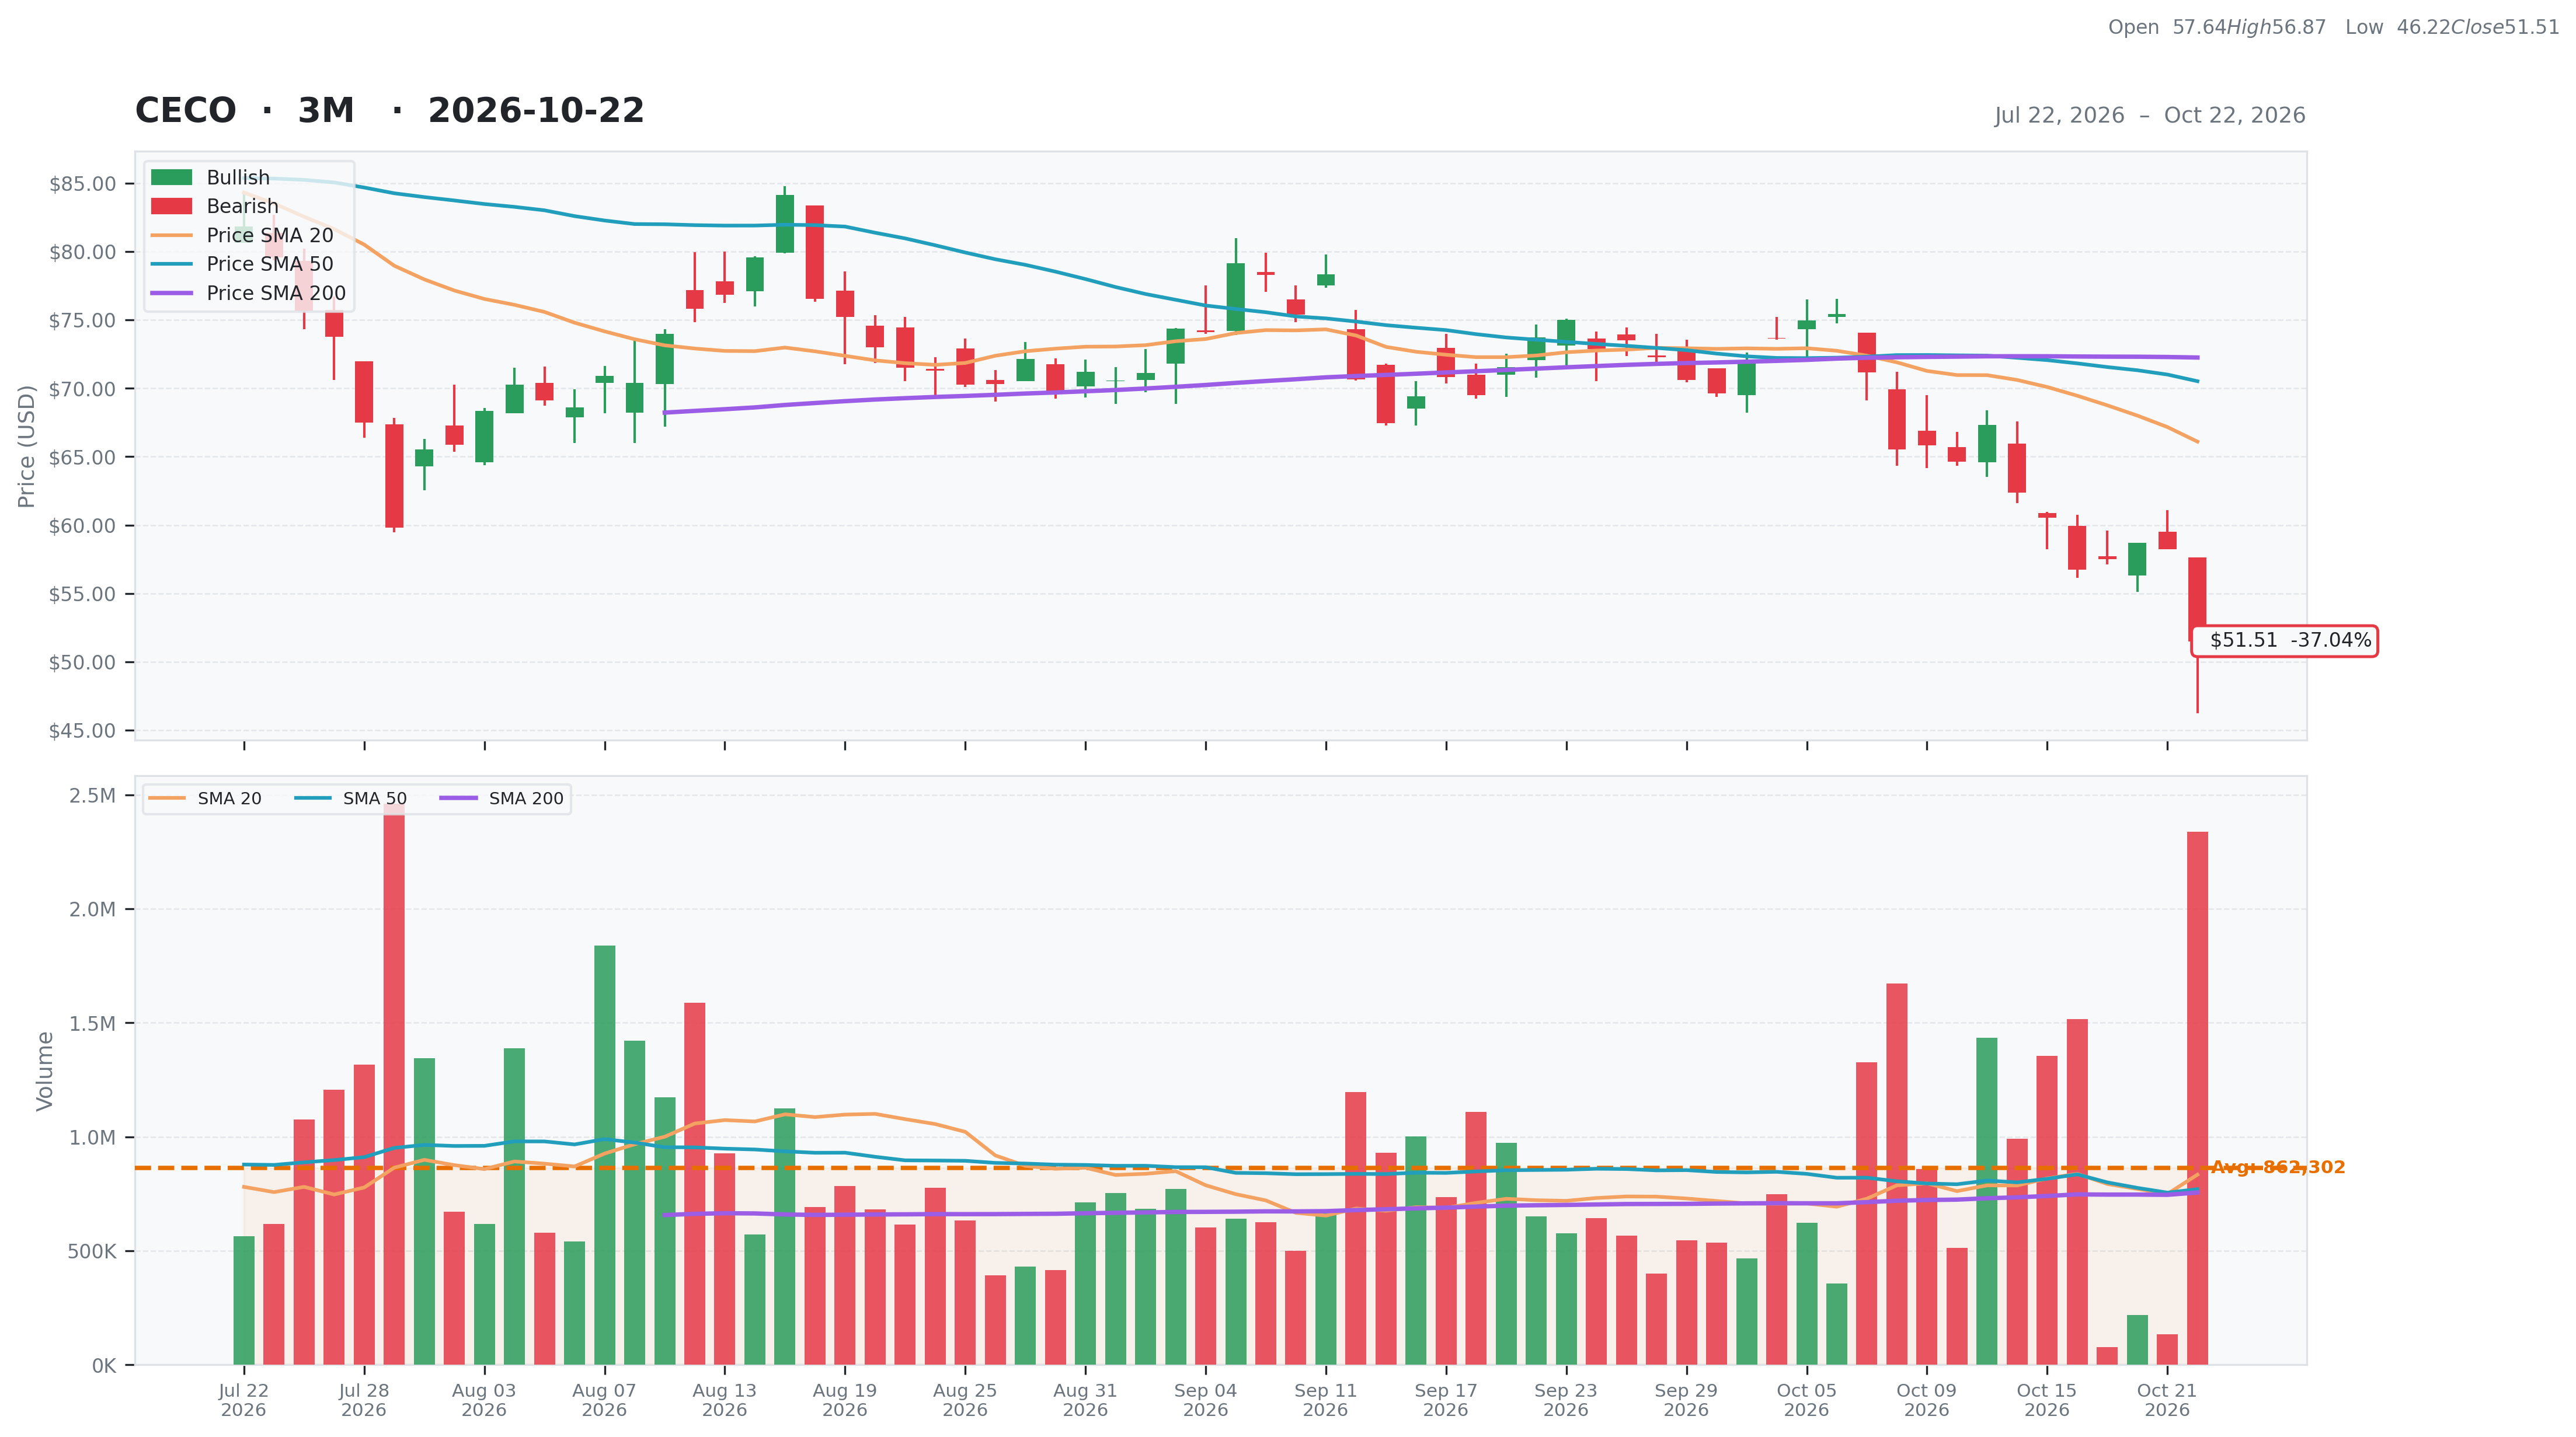
Industrials • Pollution & Treatment Controls • $51.51 • MCap: 3,322,081,024
https://www.cecoenviro.com • CECO Environmental Corp. provides critical solutions in industrial air quality, industrial water treatment, and energy transition solutions in the United States, the United Kingdom, the Netherlands, China, and internationally. It operates through Engineered Systems and Industrial Process Solutions segments. The company offers emissions management, fluid bed cyclones, thermal acoustics, and separation and filtration solutions; engineering services and environmental systems; and industrial exhaust air contamination treatment and control systems, solutions, and services, as well as intelligent control solutions. It also provides engineered and configured products and solutions, including dampers and diverters, expansion joints, selective catalytic reduction systems, severe-service and industrial cyclones, dust collectors, thermal oxidizers, filtration systems, wet and dry scrubbers, separators and coalescers, water treatment packages, metallic and non-metallic pumps, industrial silencers, and fluid handling equipment, as well as plant engineering services and engineered design build fabrication services. In addition, the company offers solutions for air pollution and contamination control, fluid handling, and process filtration in various applications, such as aluminum beverage can production, automobile production, food and beverage processing, semiconductor fabrication, electronics production, steel and aluminum mill processing, wood manufacturing, desalination, and aquaculture markets, as well as it provides engineered industrial process heating solutions for process industries. It markets its power generation, hydrocarbon processing, water/wastewater treatment, oily water separation and treatment, marine and naval vessels, and midstream oil and gas sectors. CECO Environmental Corp. was founded in 1869 and is headquartered in Addison, Texas.
Notes
07/15/2026
RS 62%, with earning growth etc... eye
| Score | Price | 52 Week & Averages | Relative Strength | Risk | |||||
|---|---|---|---|---|---|---|---|---|---|
| Total | 37 | Current | $51.51 | 52W High | $99.67 -48.32% | Relative Strength | -0.22 | Beta | 1.50 |
| Business Quality | 4 | Weekly | $60.54 -14.92% | 52W Low | $47.44 8.58% | 3M | -0.32 | Short % | 0.04 |
| Financial Strength | 12 | Monthly | $73.71 -30.12% | Above 50DMA | $70.52 -26.96% | 6M | -0.21 | Risk Score | 3 |
| Growth Outlook | 1 | Quarterly | $75.63 -31.89% | Above 200DMA | $72.25 -28.71% | 9M | -0.24 | ||
| Momentum | 3 | Yearly | $53.36 -3.47% | 12M | -0.01 | ||||
| Valuation | Financial Strength | Growth/Profitability | |||
|---|---|---|---|---|---|
| Trailing P/E | N/A | Cash | 61M | Revenue Growth | 0.54% |
| Forward P/E | 17.97 | Debt | 772M | Earnings Growth | N/A |
| PEG Ratio | 1.88 | Debt/Equity | 37.09 | Qtr Earnings Growth | N/A |
| Price/Sales | 3.68 | Current Ratio | 1.50 | Gross Margin | 0.32% |
| Price/Book | 1.60 | Quick Ratio | 1.01 | Operating Margin | 0.05% |
| EV/Revenue | 4.47 | Operating CF | -7M | Profit Margin | -0.03% |
| EV/EBITDA | 45.23 | Free CF | -163M | EBITDA Margin | 0.10% |
| Ent Value | 4,038M | Return on Assets | 0.02% | ||
| Return on Equity | -0.02% | ||||
| Technical | Volume & Bollinger Bands | Analyst | |||
|---|---|---|---|---|---|
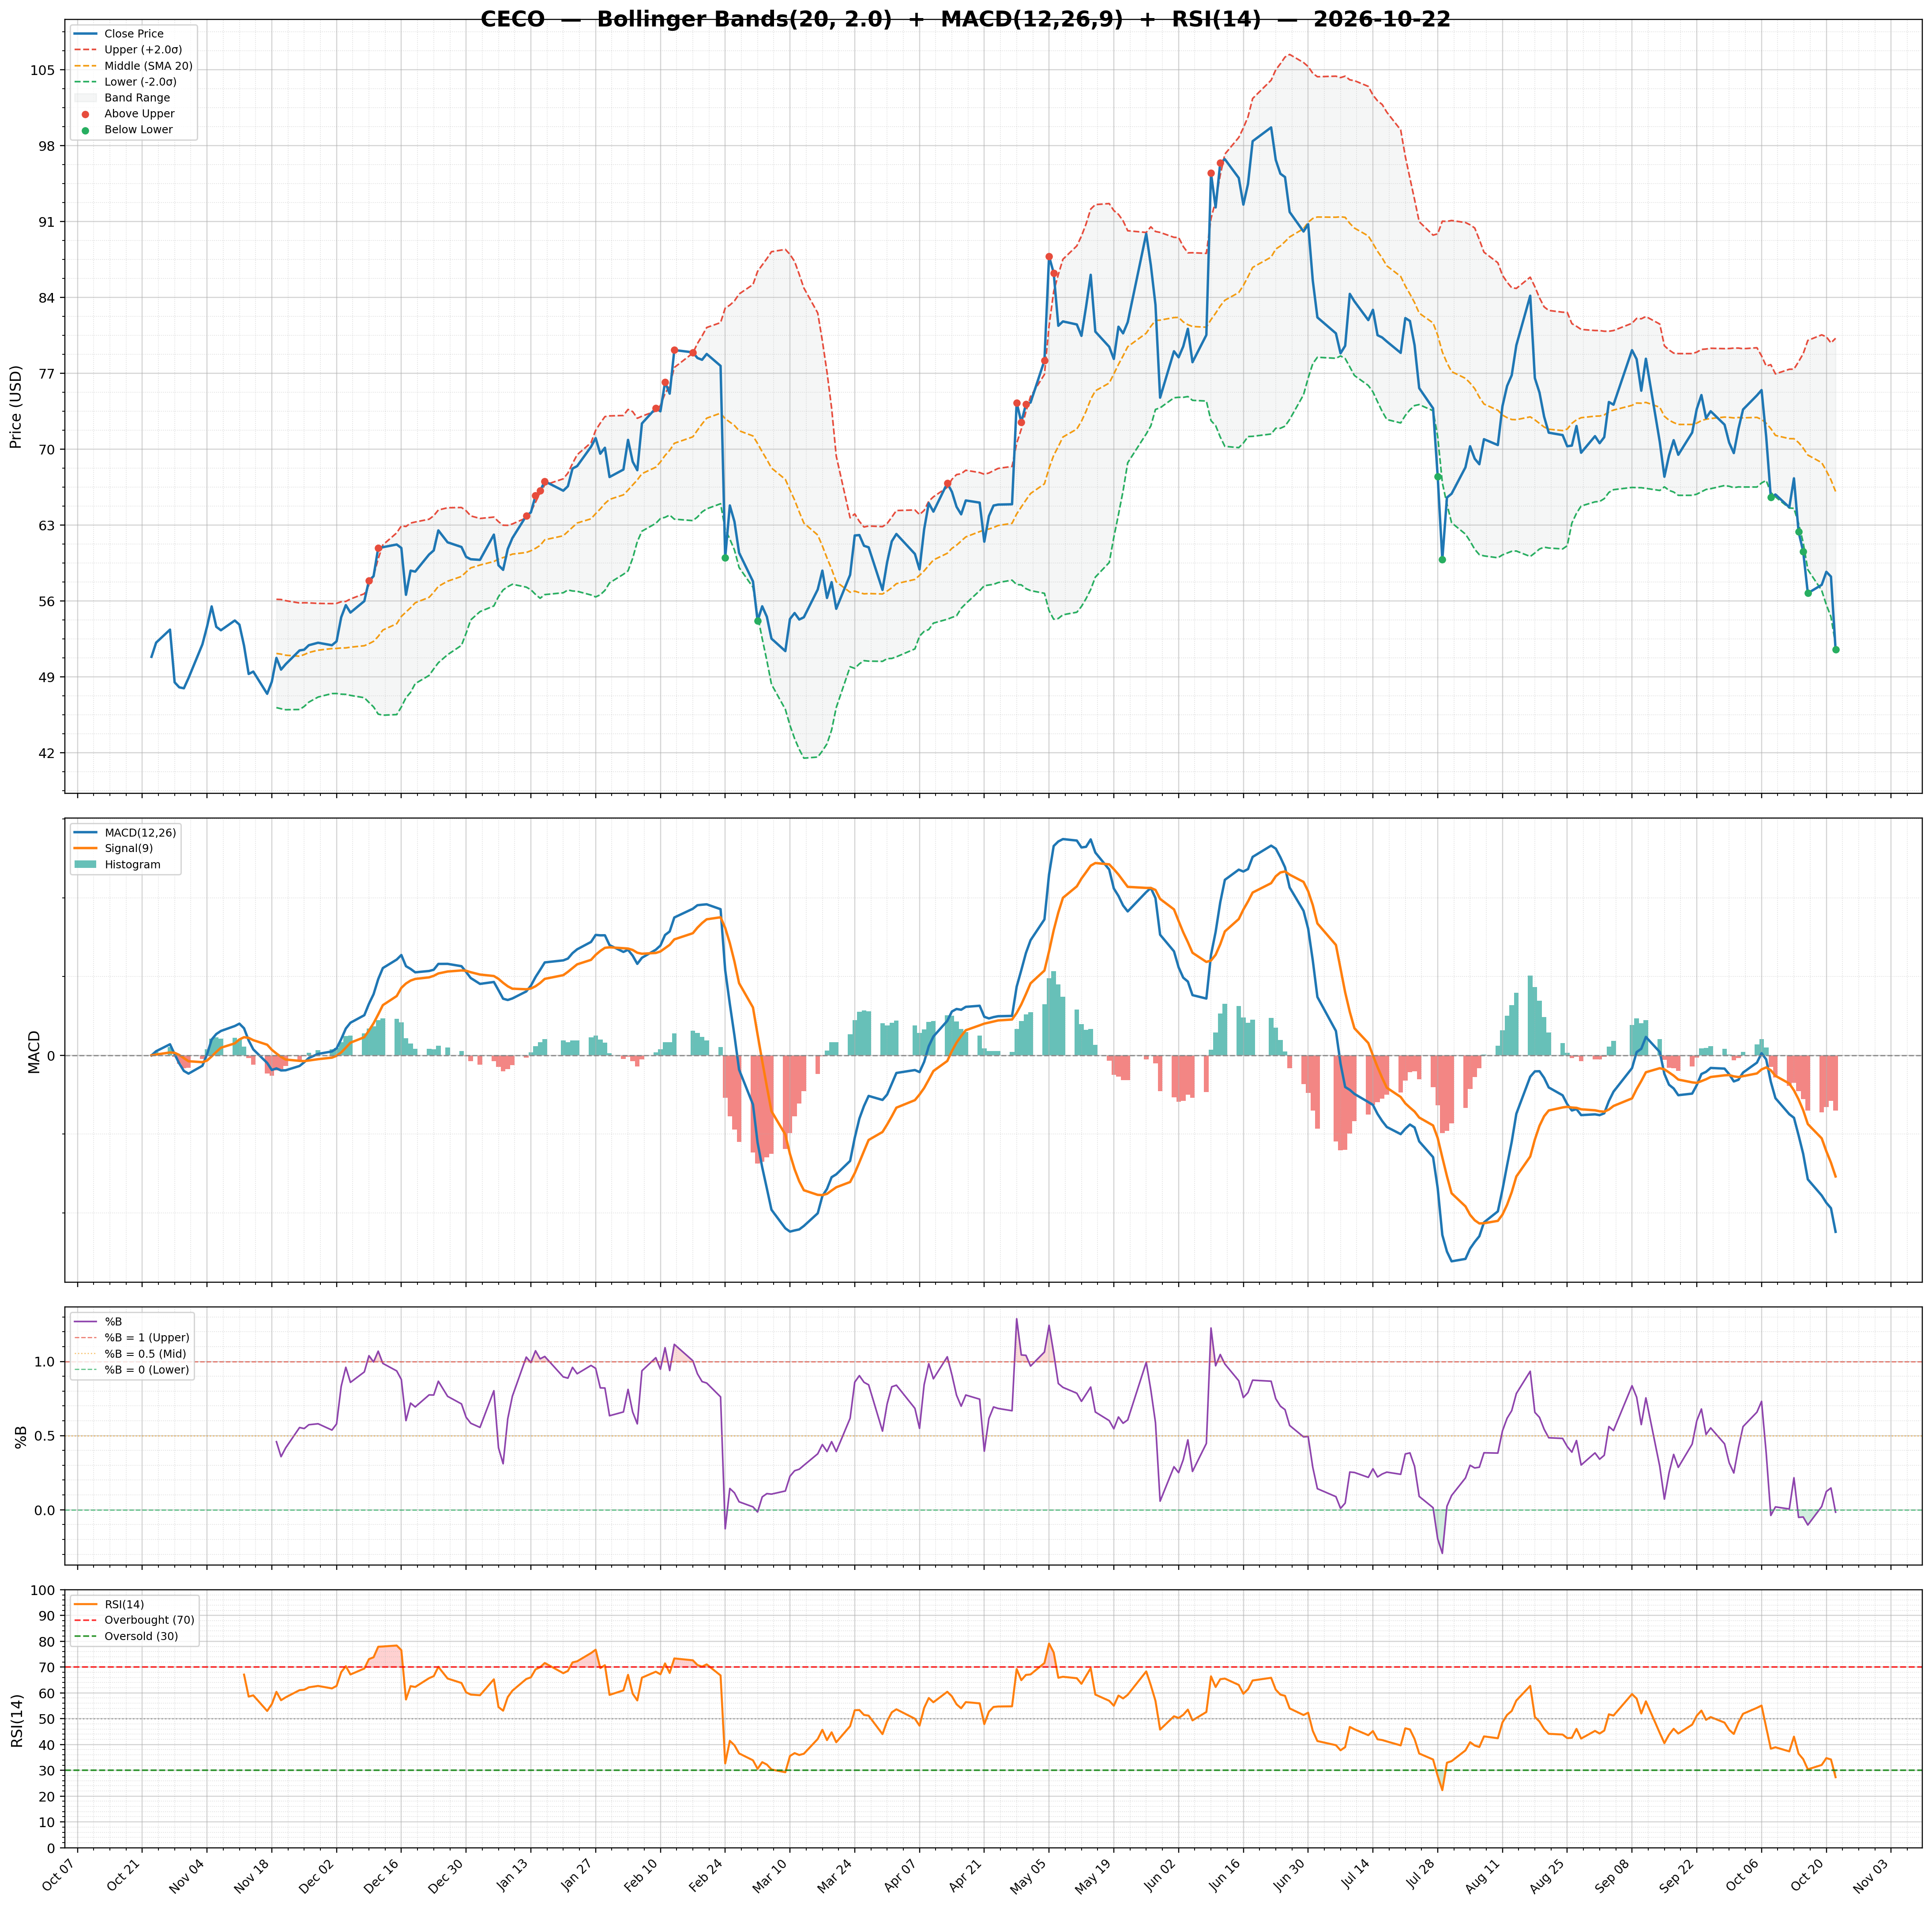
| RSI | 27.33 | Volume | 1.51M | Rating | strong_buy |
| Previous RSI | 34.21 | Avg Volume 20D | 0.83M | Target Mean | $109.00 |
| RSI Trend | Down | Relative Volume | 2.79 | Target High | $130.00 |
| MACD | -4.48 | Lower Band | 51.98 | Target Low | $85.00 |
| MACD Signal | -3.07 | Middle Band | 66.10 | Target Median | $110.00 |
| Histogram | -1.40 | Upper Band | 80.22 | Analysts | 7 |
| Previous Histogram | -1.16 | Bandwidth | 42.740 | Upside | 92.17% |
| Histogram Trend | Decreasing | %B | -0.02 | ||