Core Molding Technologies Inc (CMT)
Basic Materials • Specialty Chemicals • $24.24 • MCap: 202,731,360
https://www.coremt.com • Core Molding Technologies, Inc., together with its subsidiaries, operates as a molder of thermoplastic and thermoset structural products in the United States, Mexico, Canada, and internationally. The company offers a range of manufacturing processes, such as sheet molding compound compression molding, direct long fiber thermoplastic compression molding, vacuum resin transfer compression molding, structural foam and web injection molding, reaction injection molding, hand lay-up, and spray-up processes. It serves various markets, including medium and heavy-duty trucks, power sports, building products, industrial and utilities, and other commercial markets. The company was formerly known as Core Materials Corporation and changed its name to Core Molding Technologies, Inc. in August 2002. Core Molding Technologies, Inc. was incorporated in 1996 and is headquartered in Columbus, Ohio.
AAII
| Score | Price | 52 Week & Averages | Relative Strength | Risk | |||||
|---|---|---|---|---|---|---|---|---|---|
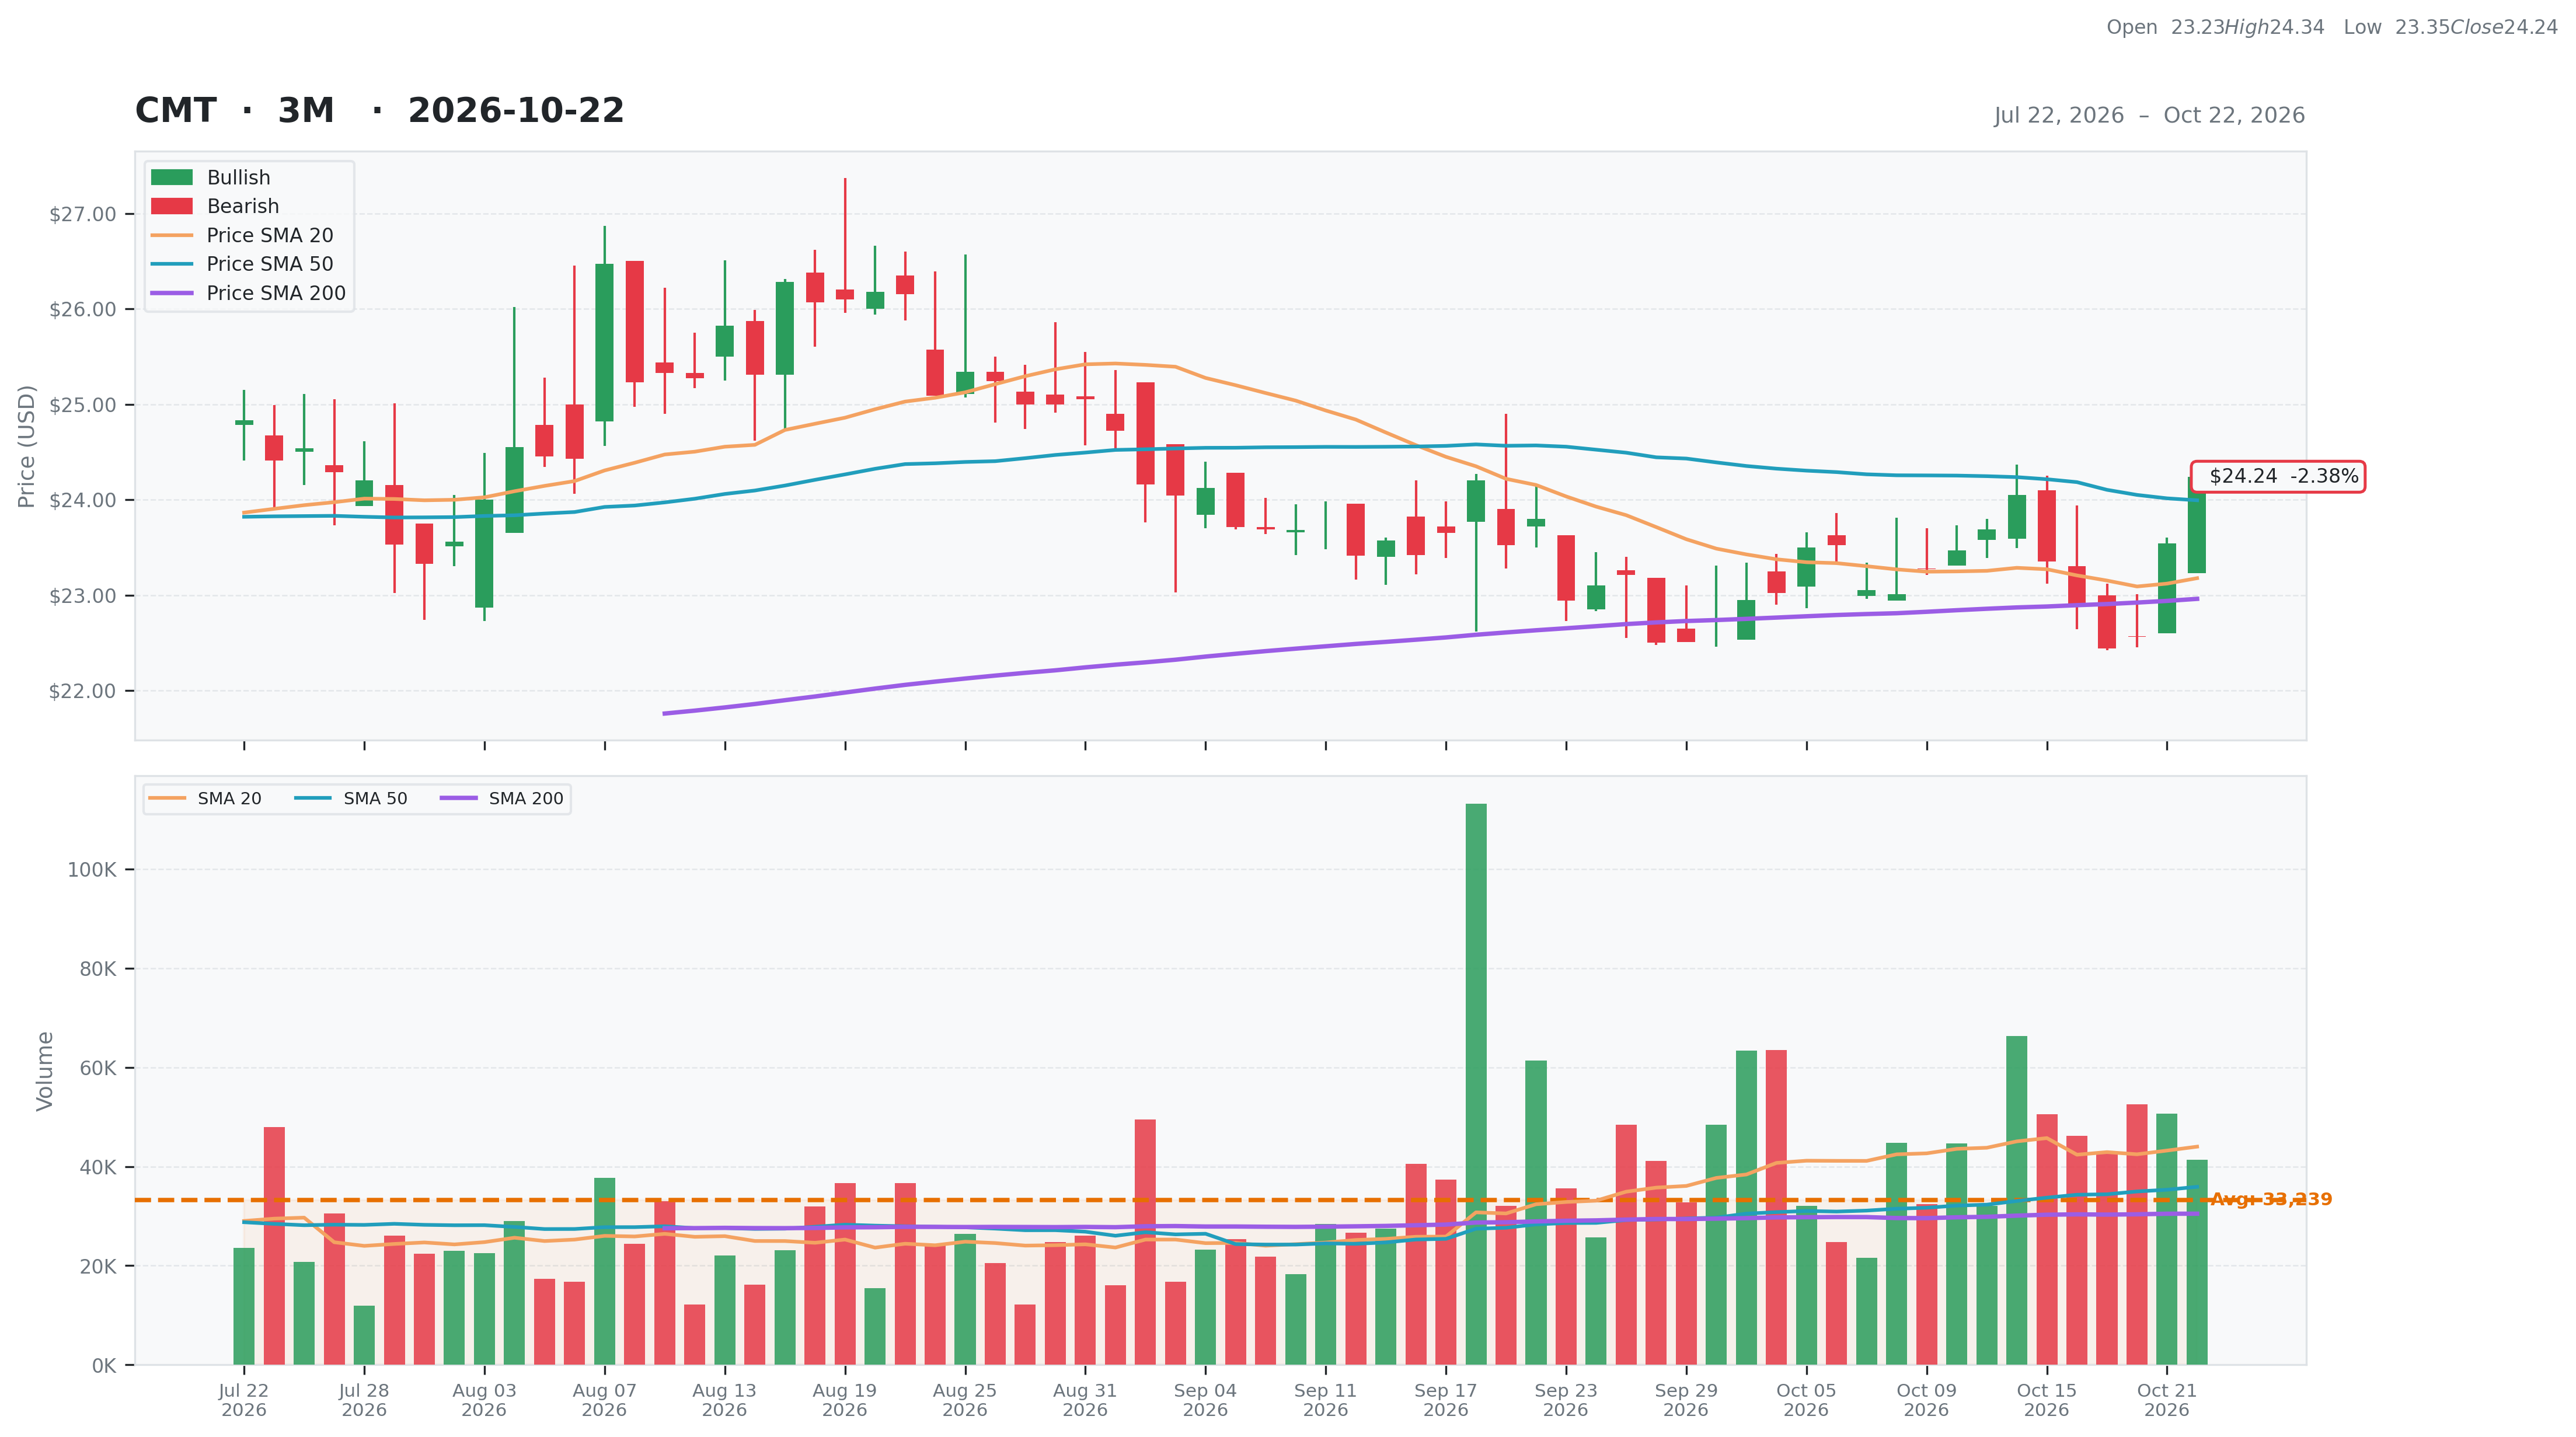
| Total | 43 | Current | $24.24 | 52W High | $28.35 -14.50% | Relative Strength | 0.08 | Beta | 0.39 |
| Business Quality | 1 | Weekly | $23.35 3.81% | 52W Low | $17.56 38.04% | 3M | -0.01 | Short % | 0.03 |
| Financial Strength | 8 | Monthly | $23.80 1.85% | Above 50DMA | $23.99 1.03% | 6M | -0.11 | Risk Score | 4 |
| Growth Outlook | 4 | Quarterly | $24.54 -1.22% | Above 200DMA | $22.96 5.57% | 9M | 0.25 | ||
| Momentum | 5 | Yearly | $18.13 33.70% | 12M | 0.27 | ||||
| Valuation | Financial Strength | Growth/Profitability | |||
|---|---|---|---|---|---|
| Trailing P/E | 26.95 | Cash | 12M | Revenue Growth | -0.21% |
| Forward P/E | 13.32 | Debt | 15M | Earnings Growth | -0.56% |
| PEG Ratio | 0.36 | Debt/Equity | 9.40 | Qtr Earnings Growth | -0.56% |
| Price/Sales | 0.80 | Current Ratio | 2.00 | Gross Margin | 0.18% |
| Price/Book | 1.18 | Quick Ratio | 1.21 | Operating Margin | 0.04% |
| EV/Revenue | 0.78 | Operating CF | 17M | Profit Margin | 0.03% |
| EV/EBITDA | 8.30 | Free CF | -9M | EBITDA Margin | 0.09% |
| Ent Value | 199M | Return on Assets | 0.03% | ||
| Return on Equity | 0.05% | ||||
| Technical | Volume & Bollinger Bands | Analyst | |||
|---|---|---|---|---|---|
| RSI | 58.13 | Volume | 0.05M | Rating | none |
| Previous RSI | 51.84 | Avg Volume 20D | 0.04M | Target Mean | $30.00 |
| RSI Trend | Up | Relative Volume | 0.95 | Target High | $30.00 |
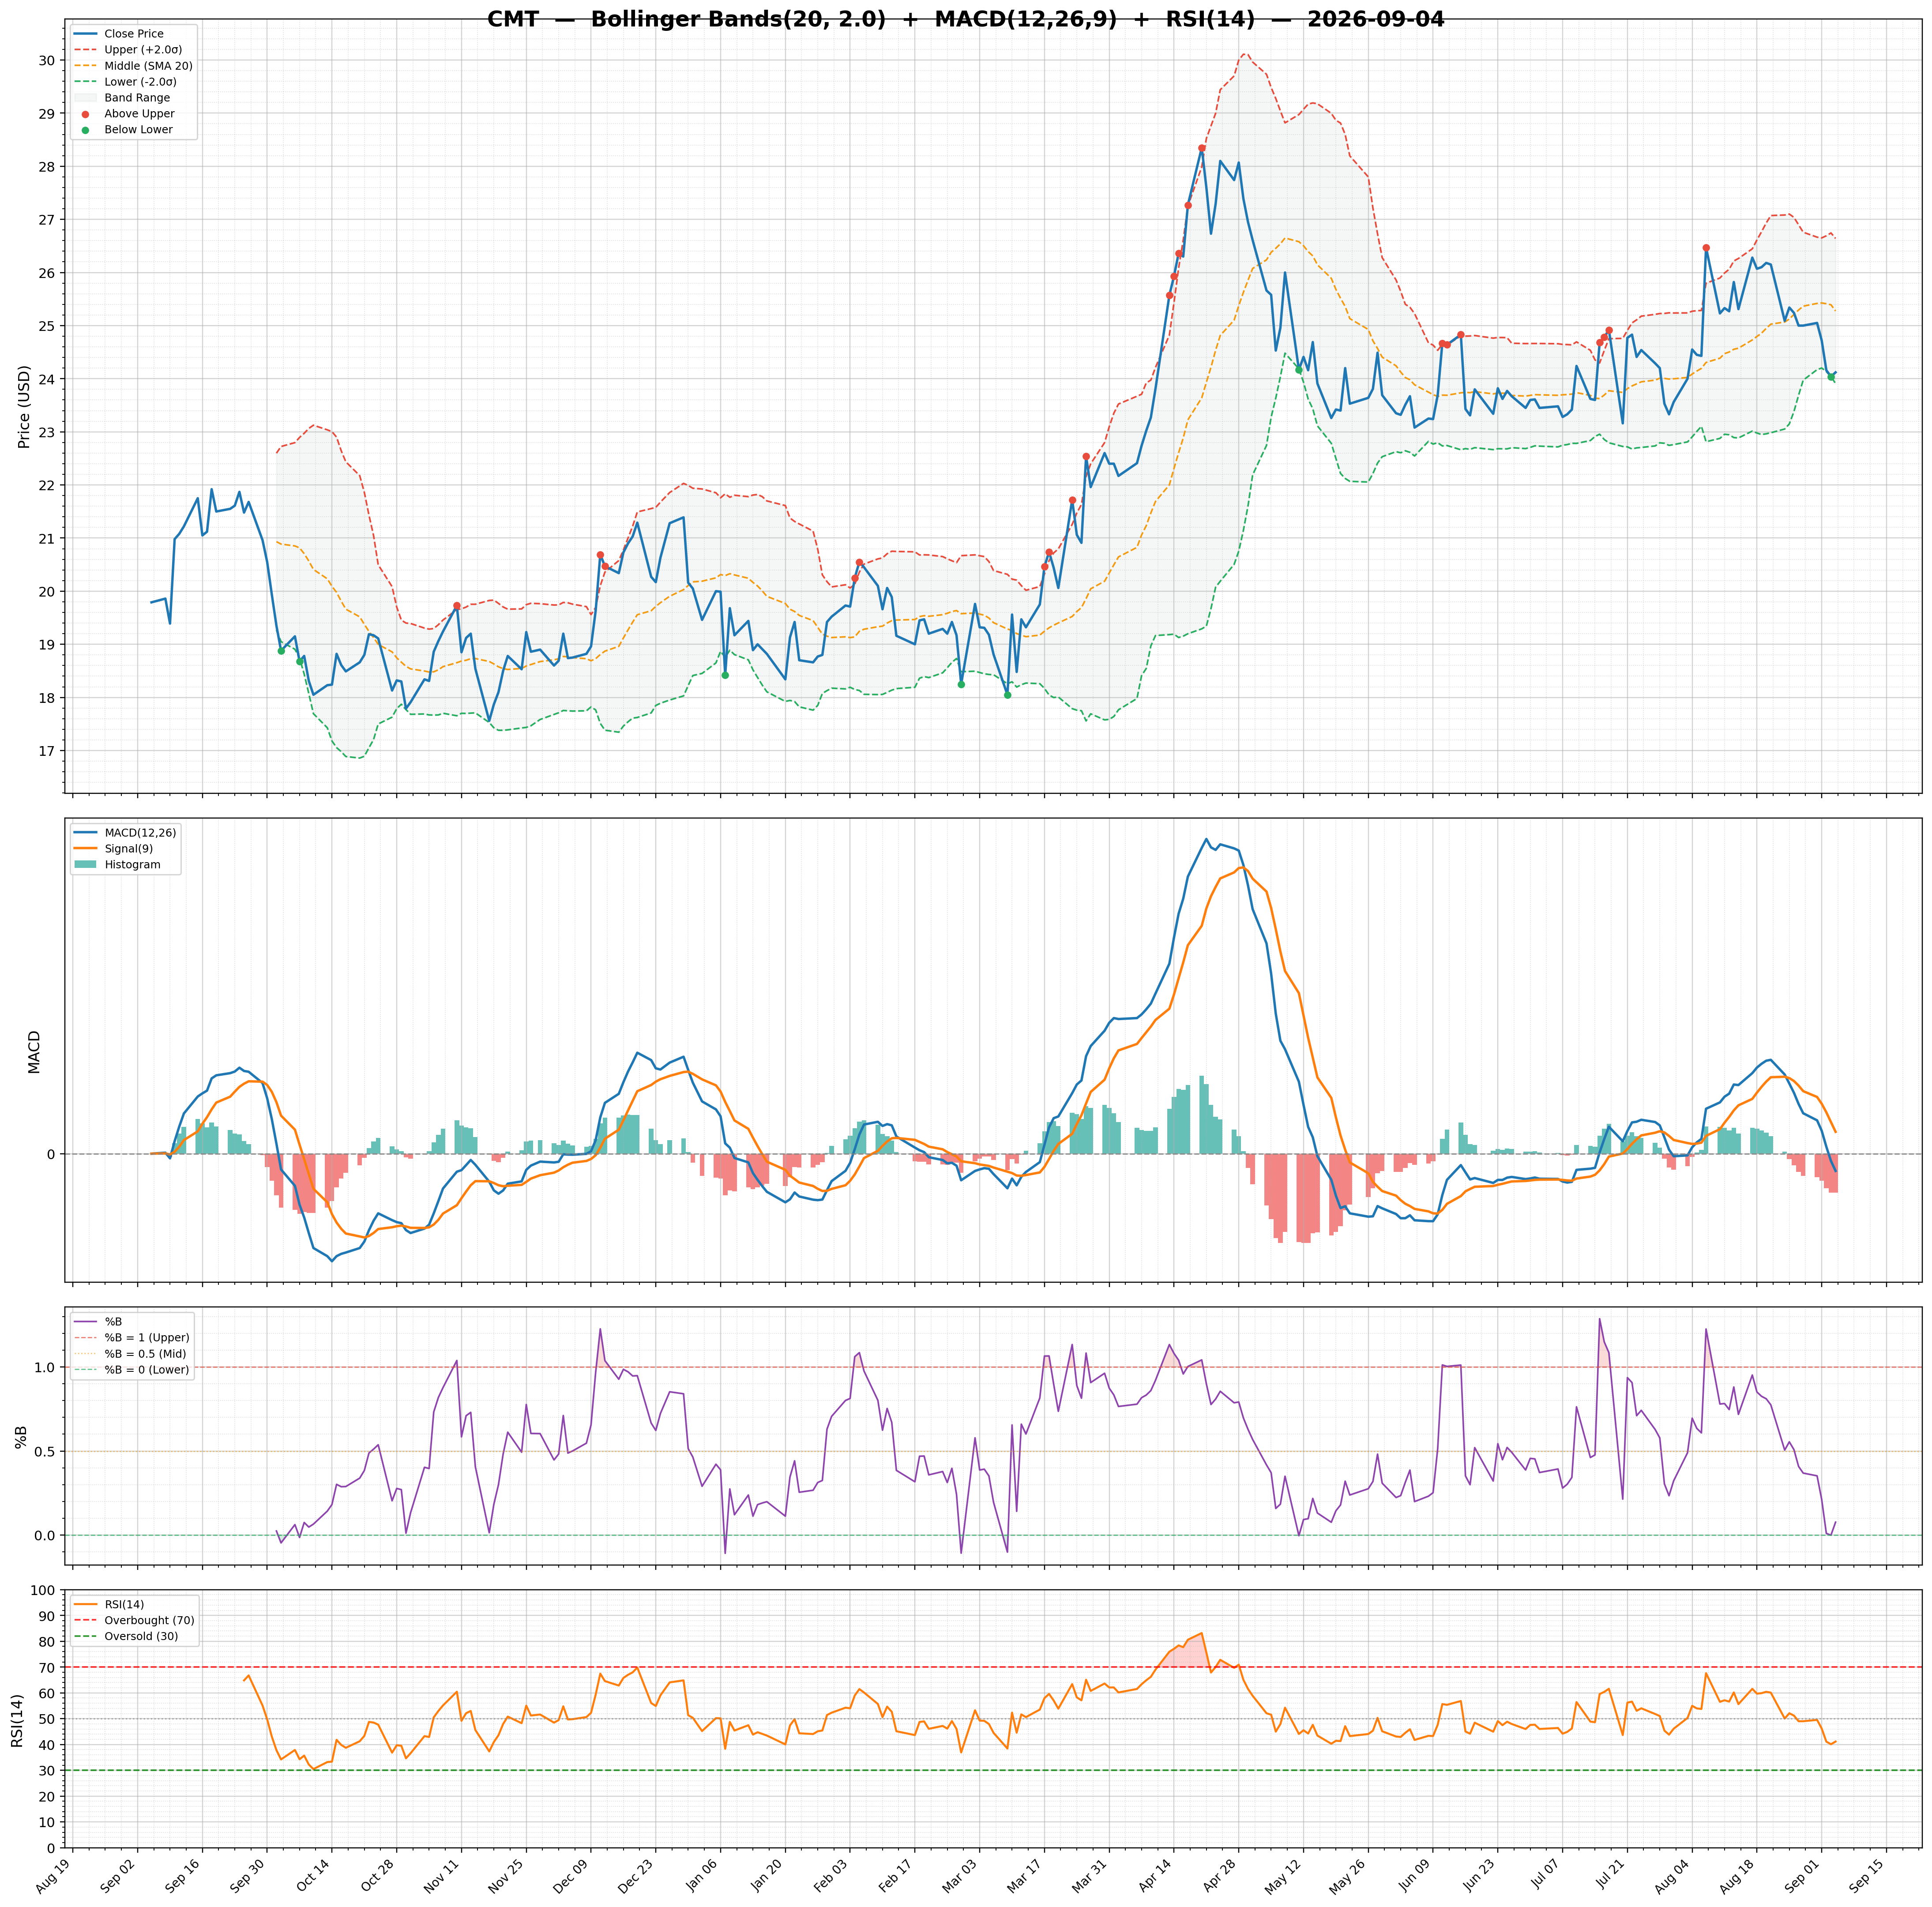
| MACD | -0.09 | Lower Band | 22.17 | Target Low | $30.00 |
| MACD Signal | -0.19 | Middle Band | 23.18 | Target Median | $30.00 |
| Histogram | 0.10 | Upper Band | 24.19 | Analysts | 1 |
| Previous Histogram | 0.03 | Bandwidth | 8.710 | Upside | 30.95% |
| Histogram Trend | Increasing | %B | 1.03 | ||