PC Connection, Inc. (CNXN)
Technology • Electronics & Computer Distribution • $88.51 • MCap: 2,254,267,136
https://www.connection.com • PC Connection, Inc., together with its subsidiaries, provides various information technology (IT) solutions worldwide. It operates in three segments: Connection Enterprise Solutions, Connection Business Solutions, and Connection Public Sector Solutions. The company offers IT solutions, including computer systems, data center solutions, and artificial intelligence; a portfolio of managed services and professional services; services related to the design, configuration, and implementation of IT solutions; and cybersecurity, digital workspace, modern infrastructure, multicloud, and supply chain and lifecycle solutions and services. It also distributes accessories, cable and adapters, computer parts, computers, conferencing and AV products, electronics, media and supplies, monitors and projectors, networking products, office equipment, power products, printers and supplies, servers and accessories, software, and storage products; hardware, including devices and peripherals; notebooks/mobility products, desktops, communication products, displays, and sound products; and cloud solutions. The company markets its products and services through its websites. It serves large enterprise customers; small to medium-sized businesses, including small office/home office customers; healthcare, manufacturing, and retail industries; federal, state, and local government; educational institutions, including K-12 and higher education; medium-to-large corporations through outbound inside and field sales, digital and web advertising, and targeted marketing programs to specific market segments. PC Connection, Inc. was founded in 1982 and is headquartered in Merrimack, New Hampshire.
Ex-AAII
| Score | Price | 52 Week & Averages | Relative Strength | Risk | |||||
|---|---|---|---|---|---|---|---|---|---|
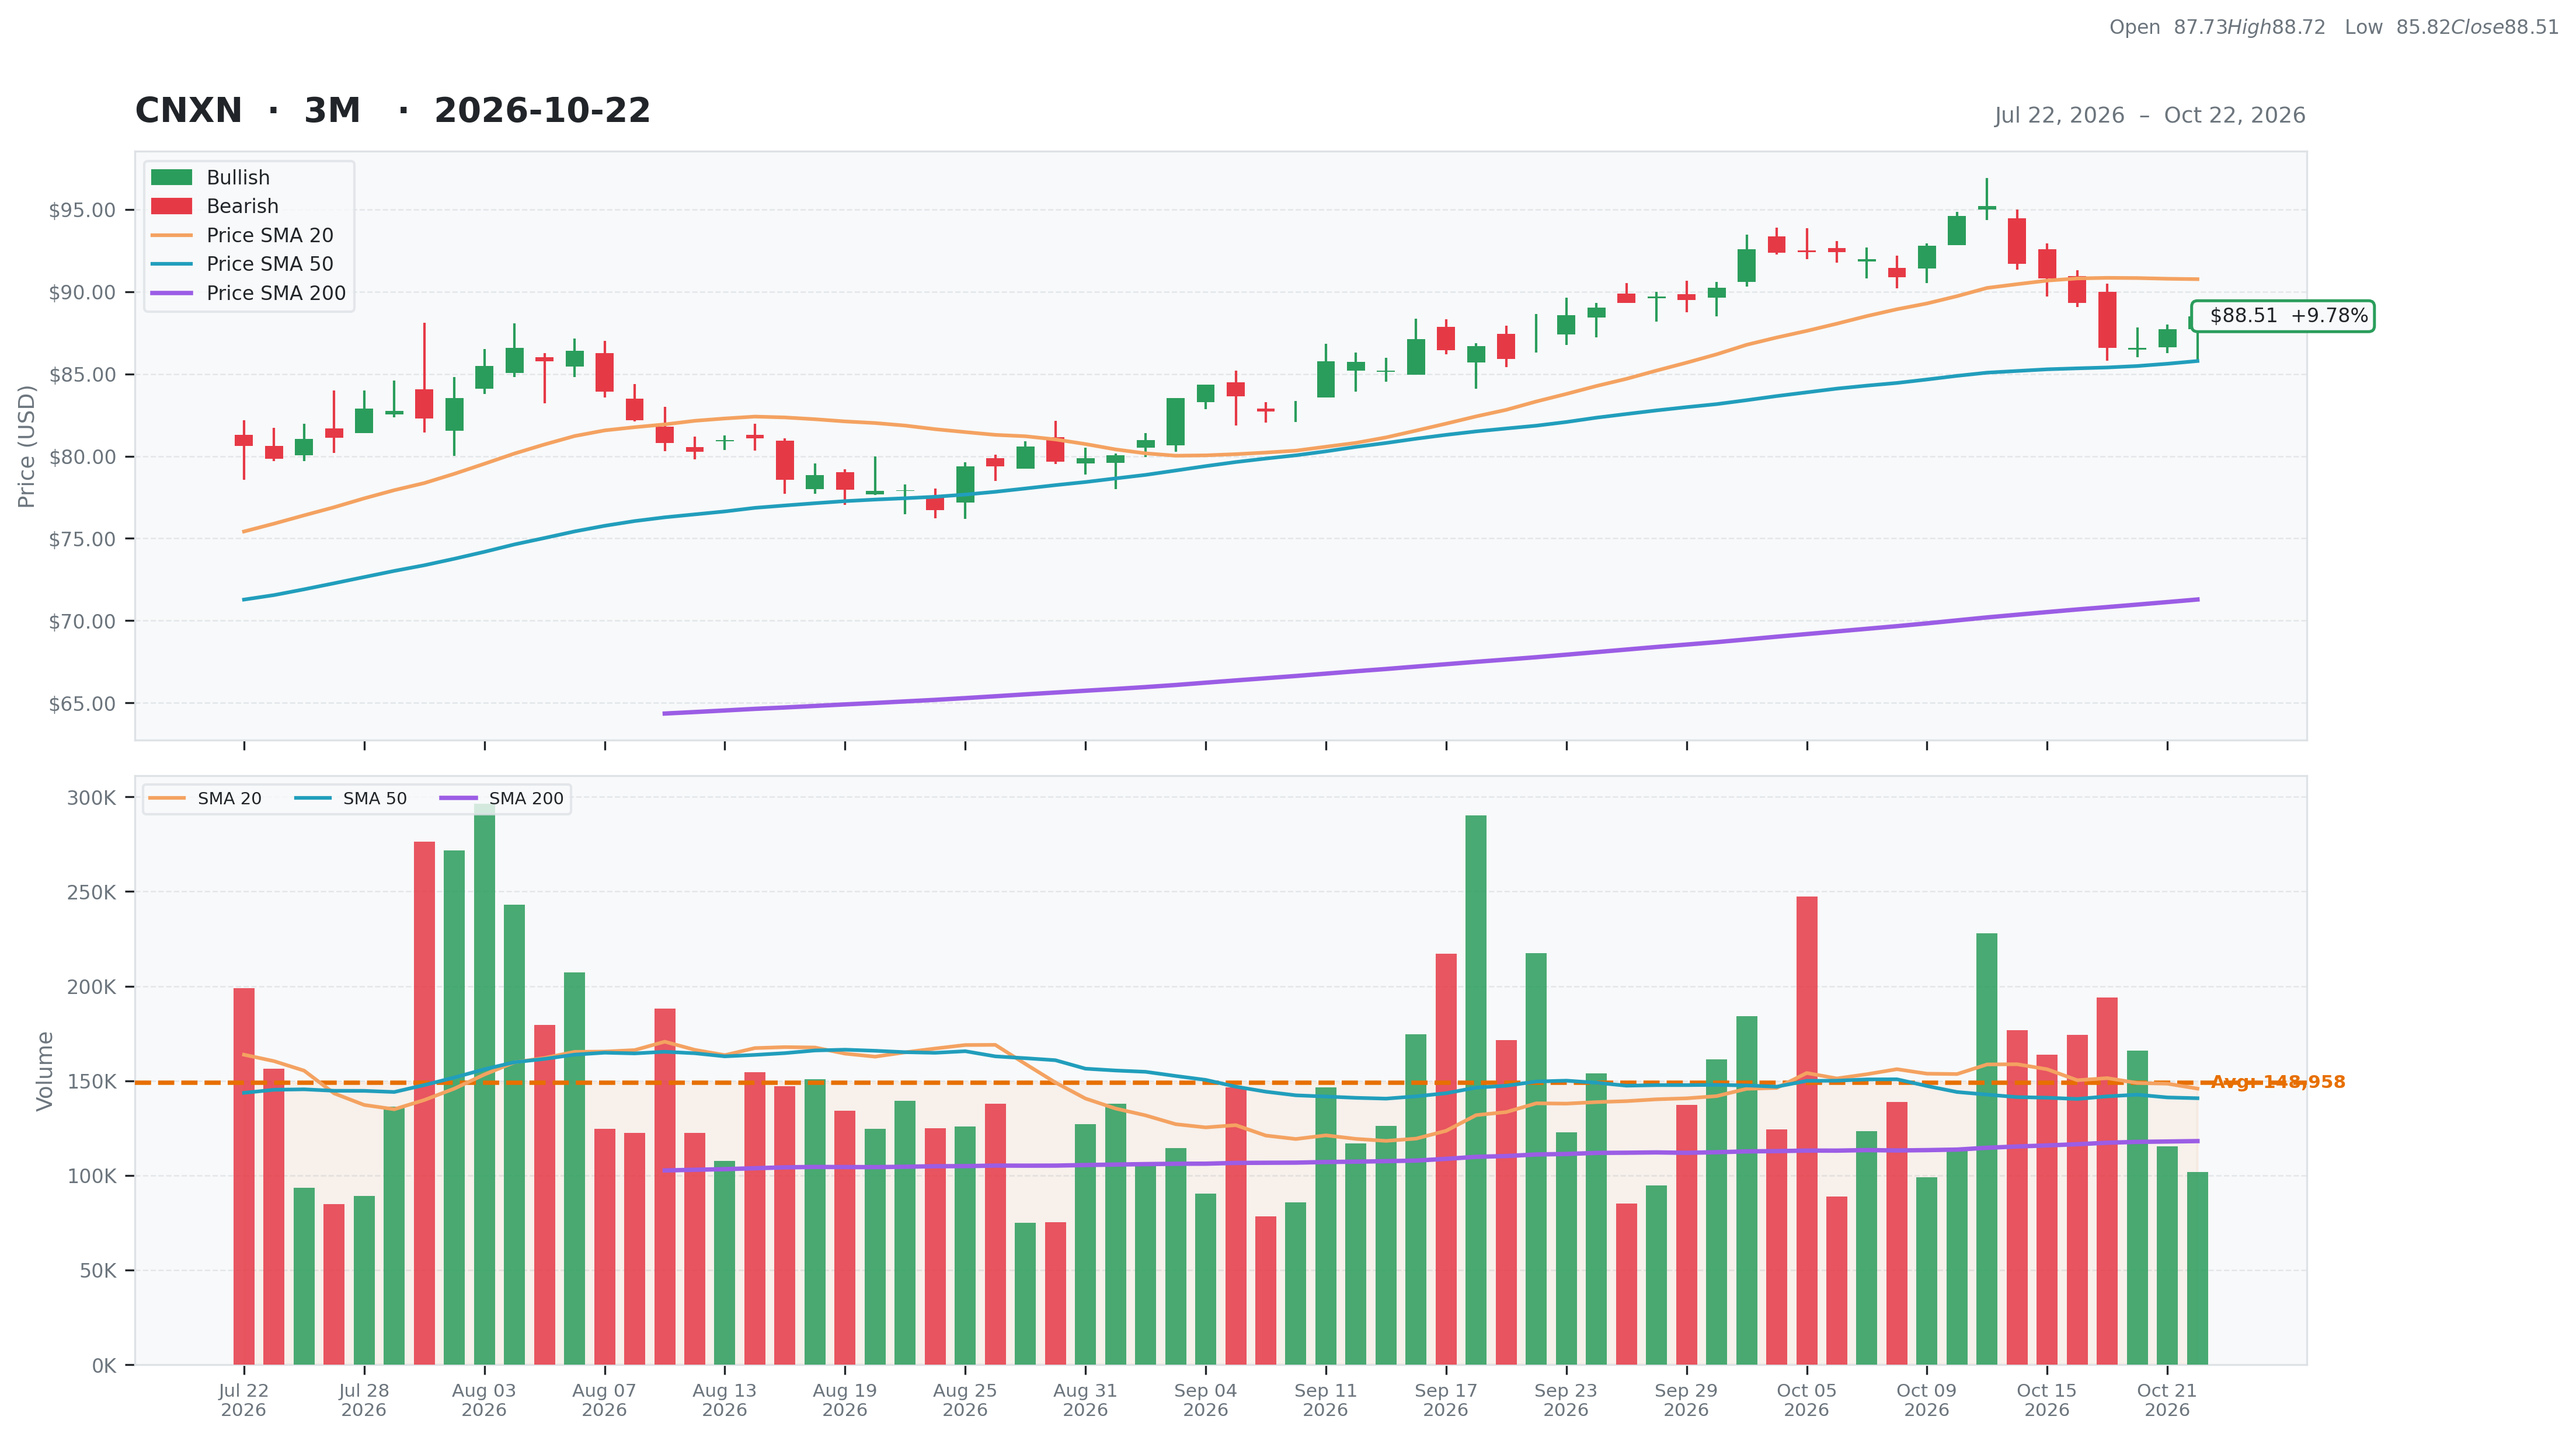
| Total | 61 | Current | $88.51 | 52W High | $95.22 -7.05% | Relative Strength | 0.31 | Beta | 0.82 |
| Business Quality | 3 | Weekly | $90.82 -2.54% | 52W Low | $55.35 59.90% | 3M | 0.09 | Short % | 0.05 |
| Financial Strength | 17 | Monthly | $86.84 1.92% | Above 50DMA | $85.78 3.18% | 6M | 0.38 | Risk Score | 6 |
| Growth Outlook | 15 | Quarterly | $81.03 9.23% | Above 200DMA | $71.29 24.16% | 9M | 0.53 | ||
| Momentum | 4 | Yearly | $61.38 44.20% | 12M | 0.43 | ||||
| Valuation | Financial Strength | Growth/Profitability | |||
|---|---|---|---|---|---|
| Trailing P/E | 23.63 | Cash | 341M | Revenue Growth | 0.12% |
| Forward P/E | 20.00 | Debt | 8M | Earnings Growth | 0.35% |
| PEG Ratio | 1.99 | Debt/Equity | 0.79 | Qtr Earnings Growth | 0.34% |
| Price/Sales | 0.75 | Current Ratio | 2.88 | Gross Margin | 0.19% |
| Price/Book | 2.37 | Quick Ratio | 2.38 | Operating Margin | 0.05% |
| EV/Revenue | 0.64 | Operating CF | 42M | Profit Margin | 0.03% |
| EV/EBITDA | 14.28 | Free CF | 12M | EBITDA Margin | 0.05% |
| Ent Value | 1,921M | Return on Assets | 0.06% | ||
| Return on Equity | 0.10% | ||||
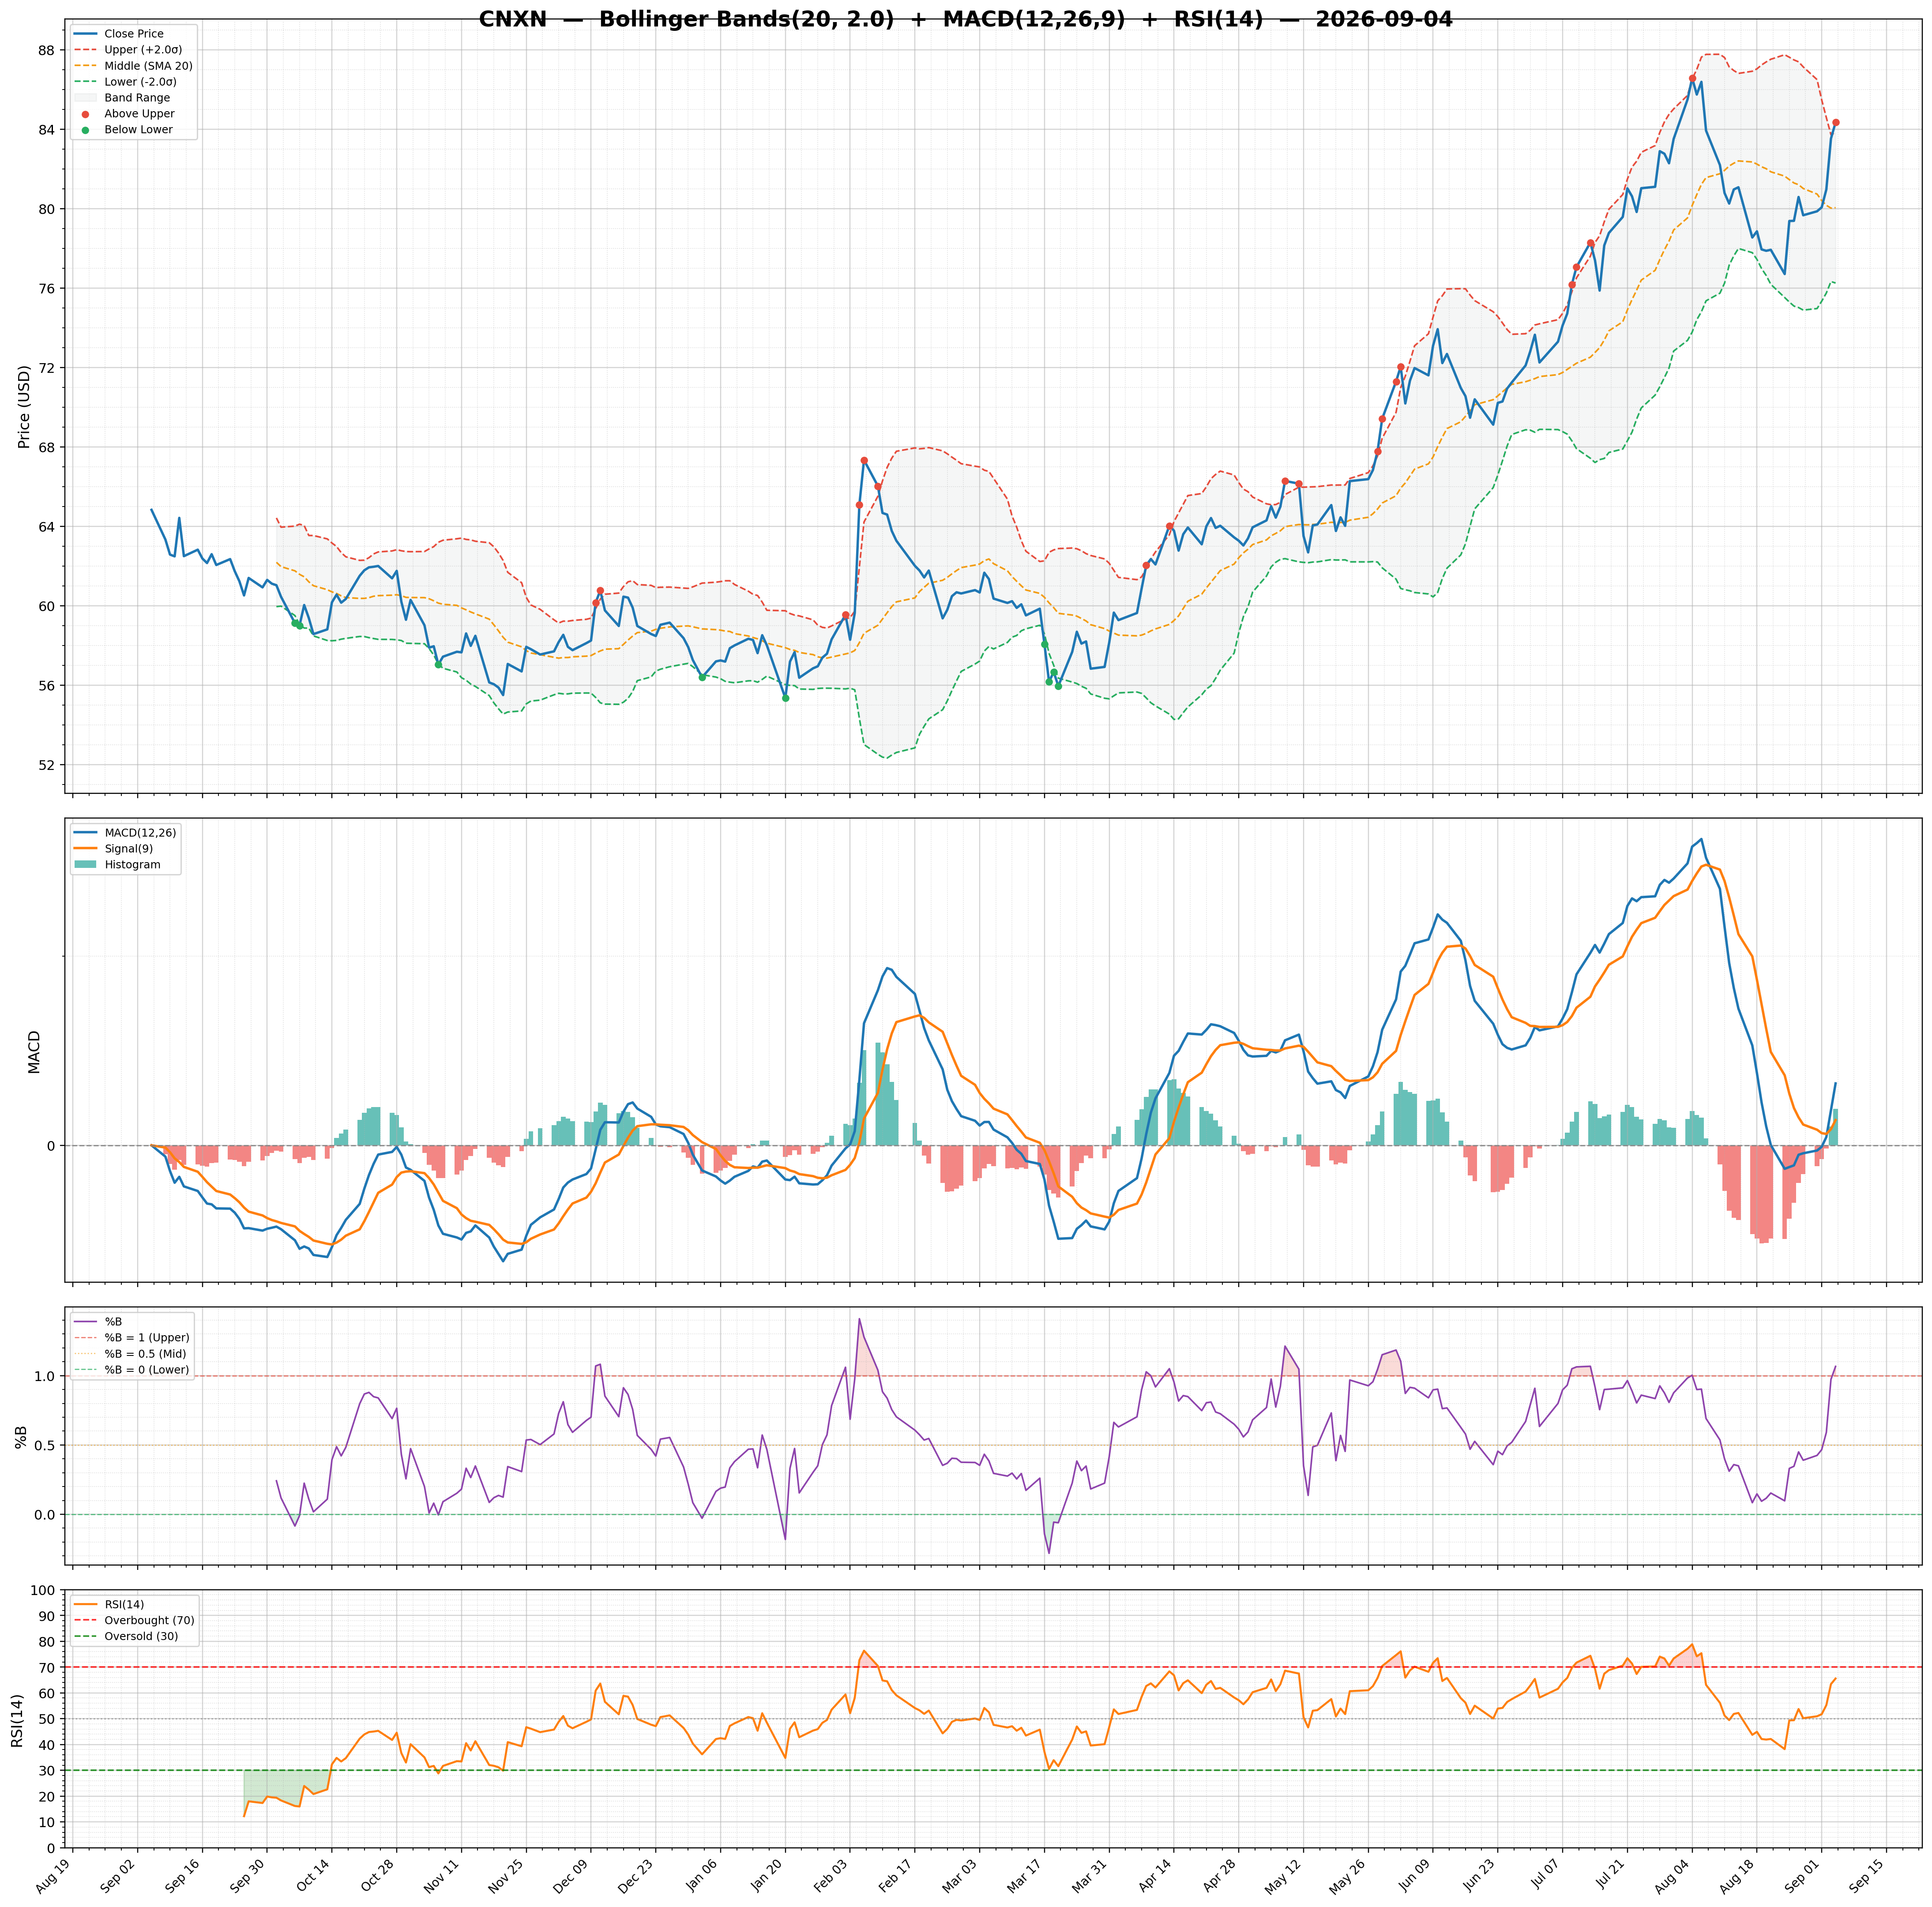
| Technical | Volume & Bollinger Bands | Analyst | |||
|---|---|---|---|---|---|
| RSI | 48.64 | Volume | 0.13M | Rating | none |
| Previous RSI | 45.90 | Avg Volume 20D | 0.15M | Target Mean | $83.00 |
| RSI Trend | Up | Relative Volume | 0.66 | Target High | $83.00 |
| MACD | 0.51 | Lower Band | 85.98 | Target Low | $83.00 |
| MACD Signal | 1.41 | Middle Band | 90.76 | Target Median | $83.00 |
| Histogram | -0.90 | Upper Band | 95.54 | Analysts | 1 |
| Previous Histogram | -0.98 | Bandwidth | 10.540 | Upside | -7.08% |
| Histogram Trend | Increasing | %B | 0.26 | ||