Coursera, Inc. (COUR)
Consumer Defensive • Education & Training Services • $5.07 • MCap: 1,414,611,584
https://www.coursera.org • Coursera, Inc. operates an online learning platform that provides education and skills training in the United States, Europe, the Middle East, Africa, the Asia Pacific, and internationally. It operates through Consumer and Enterprise segments. The company offers guided projects, courses, and specializations; online bachelor's and master's degrees; postgraduate diplomas; and certificates for entry-level professional, non-entry level professional, university, and MasterTrack programs in the domains of business, computer science, technology, and data science through Coursera.org for Individuals, Coursera Plus, Coursera for Enterprise, Coursera for Business, Coursera for Campus, and Coursera for Government; Helix, AI-native platform connecting skills discovery and personalized learning to verified capability and business outcomes. It offers its products to individuals, businesses, institutions, employers, colleges and universities, organizations, and governments. The company was formerly known as Dkandu, Inc. and changed its name to Coursera, Inc. in April 2012. Coursera, Inc. was incorporated in 2011 and is headquartered in Mountain View, California.
Reversal Strategy
Notes
10/23/2026
hold
| Score | Price | 52 Week & Averages | Relative Strength | Risk | |||||
|---|---|---|---|---|---|---|---|---|---|
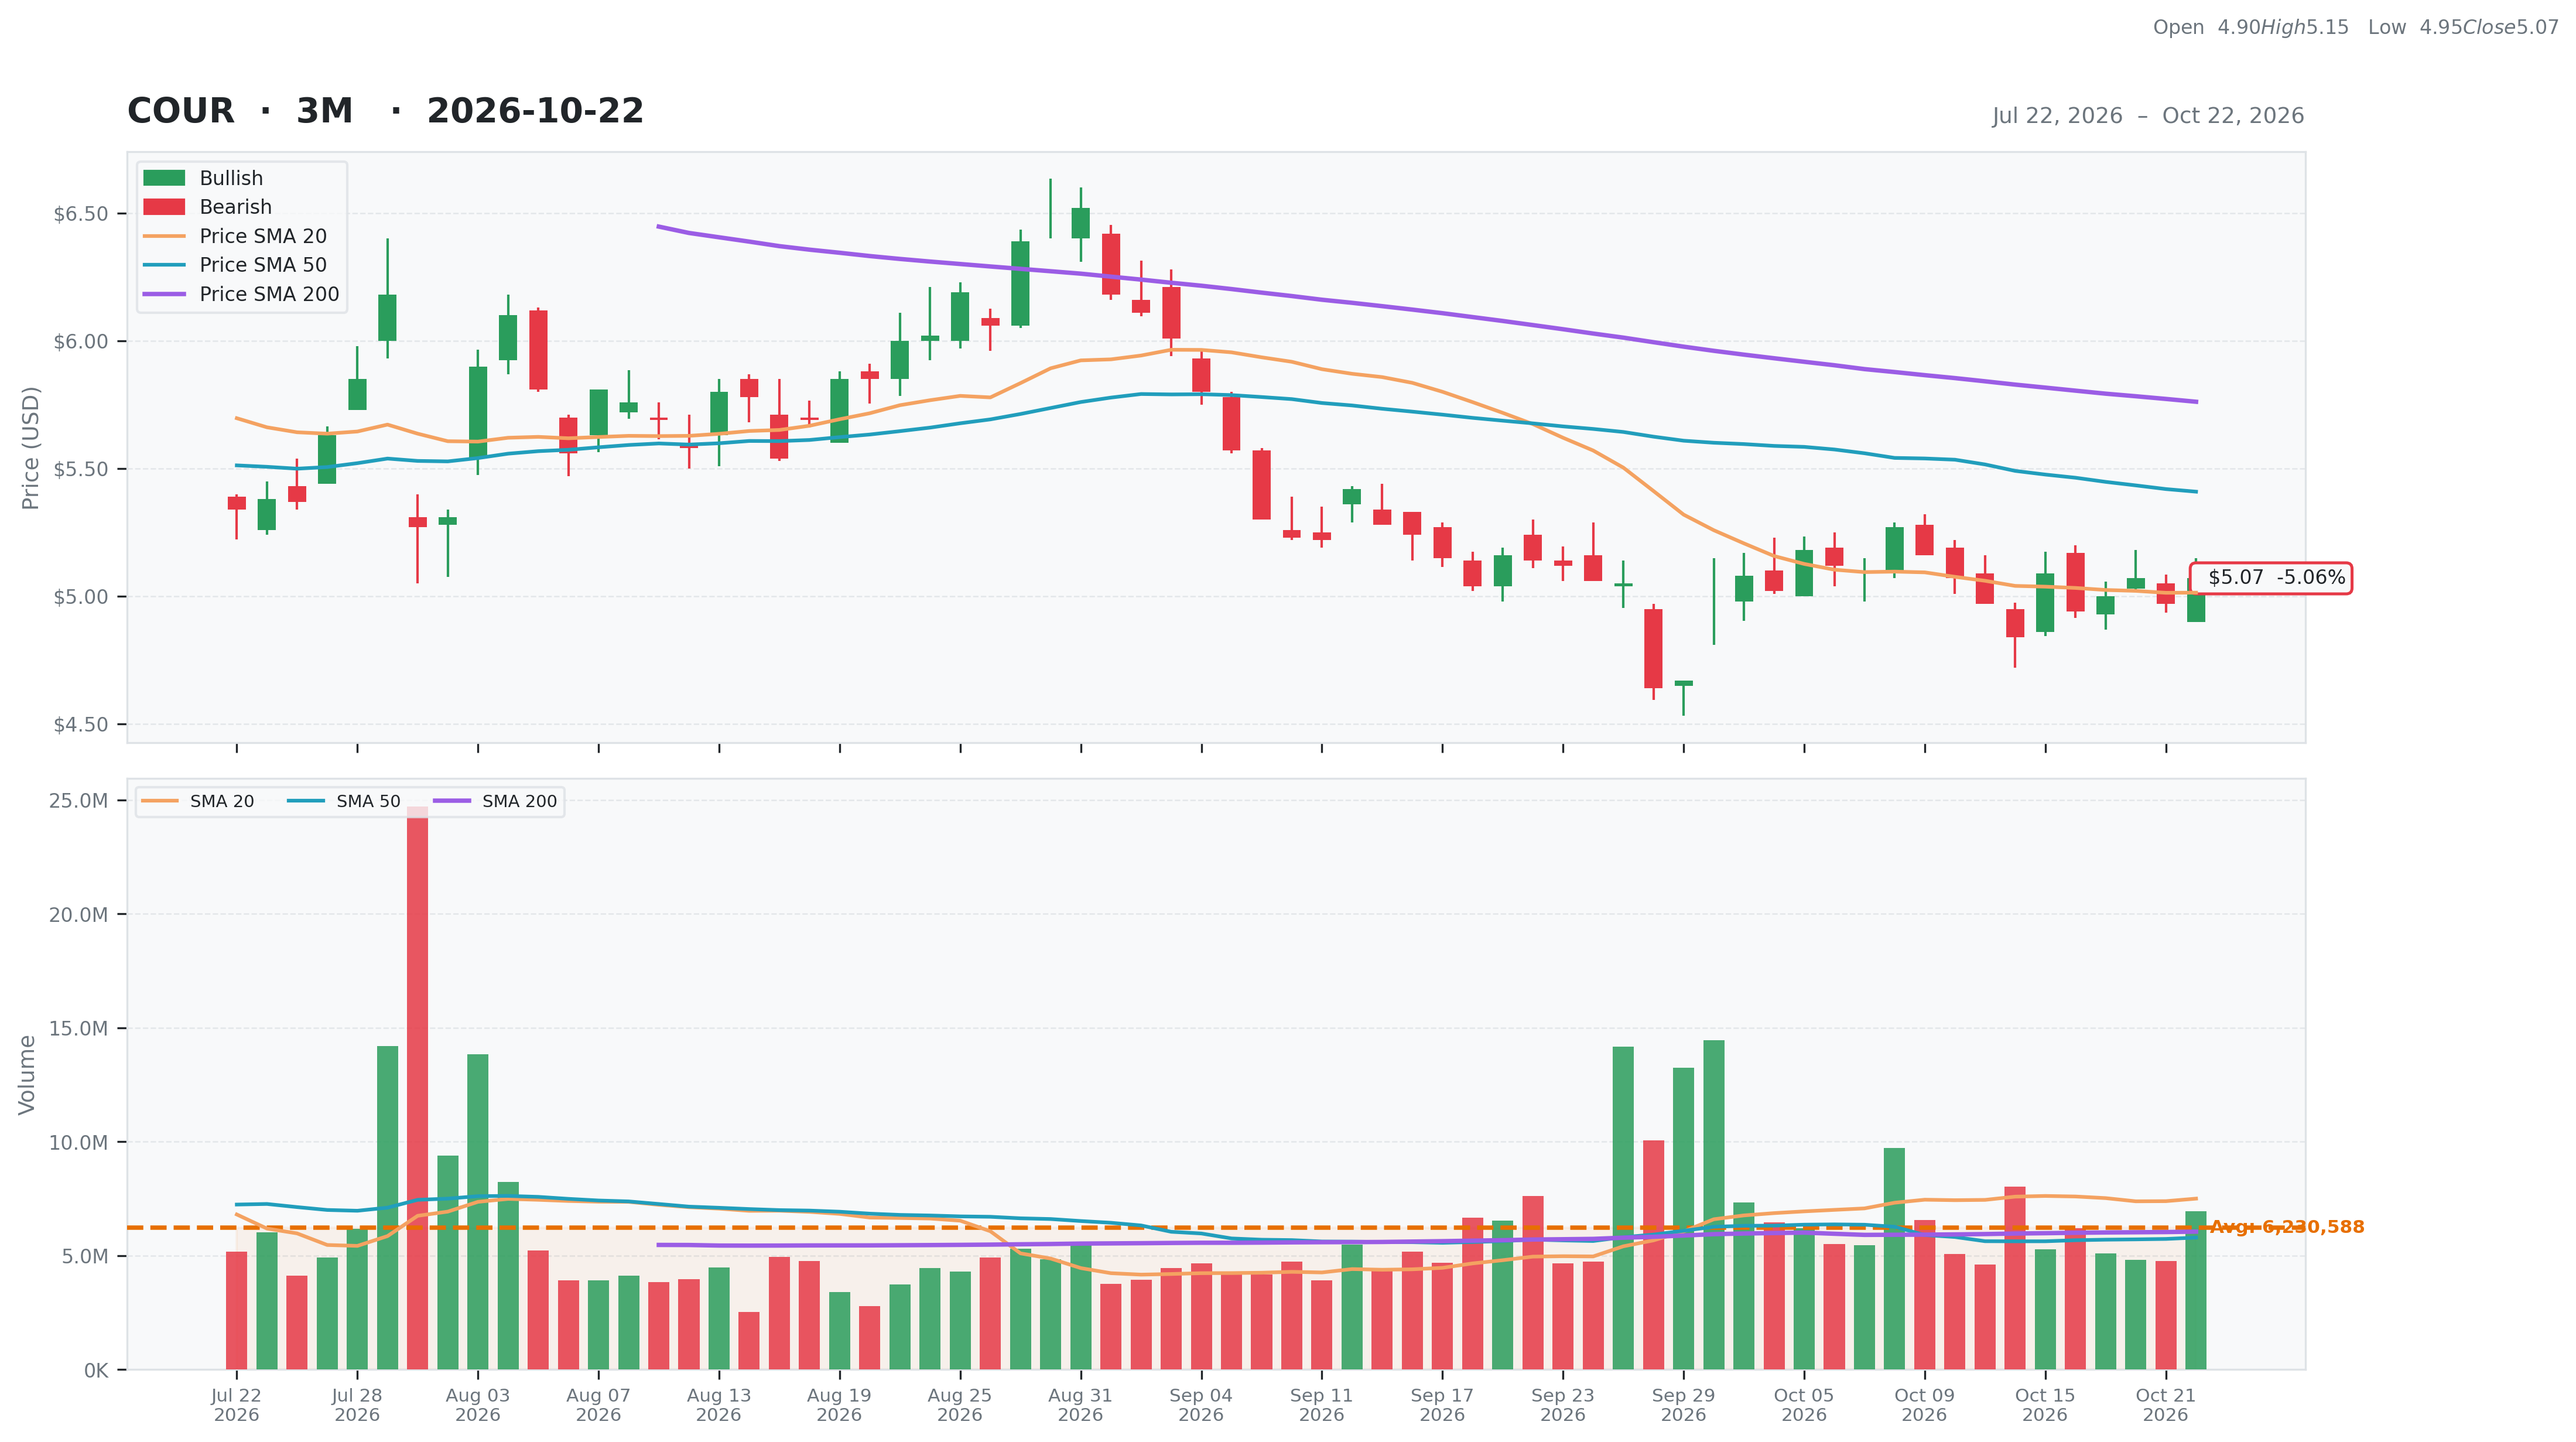
| Total | 51 | Current | $5.07 | 52W High | $10.56 -51.99% | Relative Strength | -0.19 | Beta | 1.25 |
| Business Quality | 10 | Weekly | $5.09 -0.39% | 52W Low | $4.64 9.27% | 3M | -0.06 | Short % | 0.1 |
| Financial Strength | 17 | Monthly | $5.14 -1.36% | Above 50DMA | $5.41 -6.27% | 6M | -0.15 | Risk Score | 8 |
| Growth Outlook | 1 | Quarterly | $5.37 -5.59% | Above 200DMA | $5.76 -12.00% | 9M | -0.22 | ||
| Momentum | 3 | Yearly | $9.16 -44.65% | 12M | -0.45 | ||||
| Valuation | Financial Strength | Growth/Profitability | |||
|---|---|---|---|---|---|
| Trailing P/E | N/A | Cash | 982M | Revenue Growth | 0.60% |
| Forward P/E | 6.00 | Debt | 10M | Earnings Growth | N/A |
| PEG Ratio | N/A | Debt/Equity | 0.83 | Qtr Earnings Growth | N/A |
| Price/Sales | 1.60 | Current Ratio | 1.59 | Gross Margin | 0.56% |
| Price/Book | 1.16 | Quick Ratio | 1.48 | Operating Margin | -0.02% |
| EV/Revenue | 0.38 | Operating CF | 35M | Profit Margin | -0.15% |
| EV/EBITDA | -9.07 | Free CF | 366M | EBITDA Margin | -0.04% |
| Ent Value | 334M | Return on Assets | -0.02% | ||
| Return on Equity | -0.15% | ||||
| Technical | Volume & Bollinger Bands | Analyst | |||
|---|---|---|---|---|---|
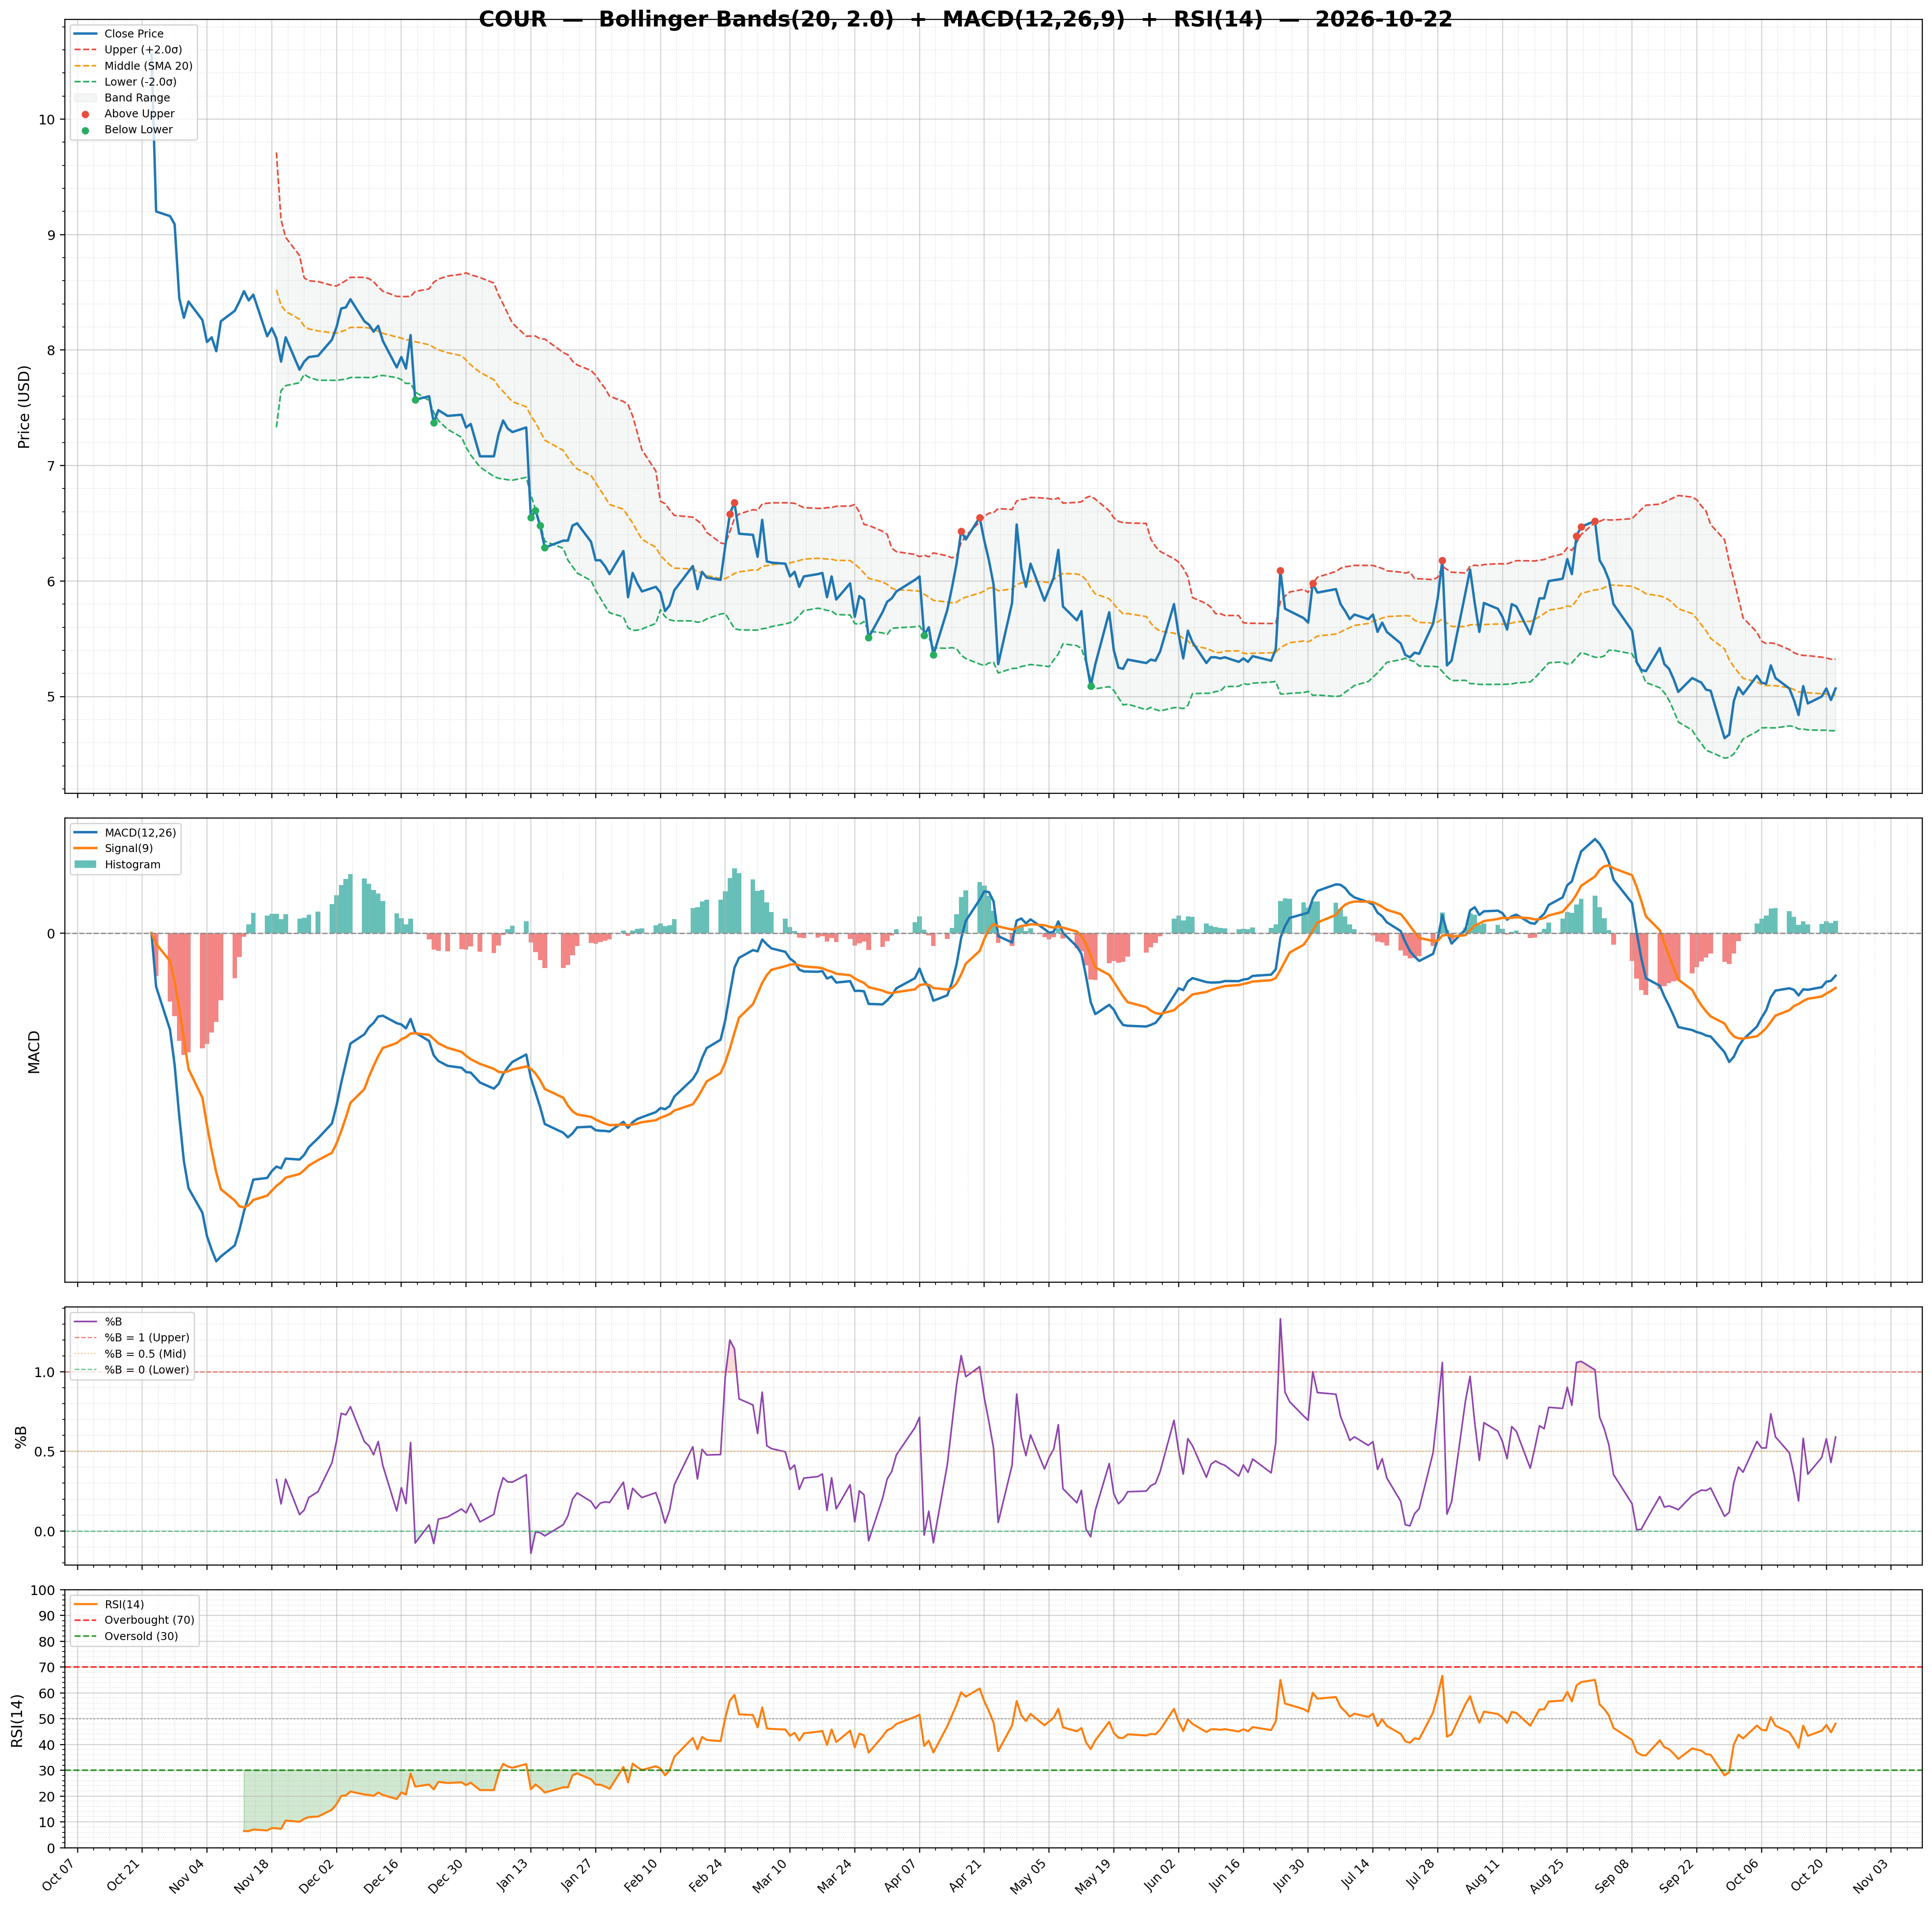
| RSI | 48.09 | Volume | 6.2M | Rating | buy |
| Previous RSI | 44.73 | Avg Volume 20D | 7.5M | Target Mean | $7.94 |
| RSI Trend | Up | Relative Volume | 1.02 | Target High | $10.00 |
| MACD | -0.09 | Lower Band | 4.70 | Target Low | $6.00 |
| MACD Signal | -0.11 | Middle Band | 5.01 | Target Median | $7.00 |
| Histogram | 0.02 | Upper Band | 5.32 | Analysts | 9 |
| Previous Histogram | 0.02 | Bandwidth | 12.370 | Upside | 60.82% |
| Histogram Trend | Increasing | %B | 0.59 | ||