The Campbell's Company (CPB)
Consumer Defensive • Packaged Foods • $21.26 • MCap: 5,925,923,328
https://www.thecampbellscompany.com • The Campbell's Company, together with its subsidiaries, engages in the manufacture and marketing of food and beverage products in the United States and internationally. It operates through Meals & Beverages, and Snacks segments. The Meals & Beverages segment engages in the retail and foodservice businesses in the United States and Canada. This segment provides Campbell's condensed and ready-to-serve soups; Swanson broth and stocks; pacific foods broth, soups and non-dairy beverages; Prego pasta sauces; Pace mexican sauces; Spaghettios pasta; Campbell's gravies, beans and dinner sauces; Swanson canned poultry; V8 Juices And Beverages; Campbell's Tomato Juice; Rao's Pasta sauces, dry pasta, frozen entrées, frozen pizza and soups; Michael Angelo's Frozen Entrées And Pasta Sauces; and Noosa Yogurts. The Snacks Segment Retails Pepperidge Farm Cookies, Crackers, Fresh Bakery and Frozen Products, including Goldfish Crackers, Snyder's of Hanover Pretzels, Lance sandwich crackers, Cape Cod potato chips, Kettle brand potato chips, late july snacks, Snack factory pretzel crisps, and other snacking products. This segment is also involved in the snacking, and meals and beverage retail business in Latin America. It sells its products through retail food chains, mass discounters, mass merchandisers, club stores, convenience stores, dollar stores, e-commerce and other retail, commercial and non-commercial establishments, and independent contractor distributors. The company was formerly known as Campbell Soup Company and changed its name to The Campbell's Company in November 2024. The Campbell's Company was founded in 1869 and is headquartered in Camden, New Jersey.
Watch List
ET
| Score | Price | 52 Week & Averages | Relative Strength | Risk | |||||
|---|---|---|---|---|---|---|---|---|---|
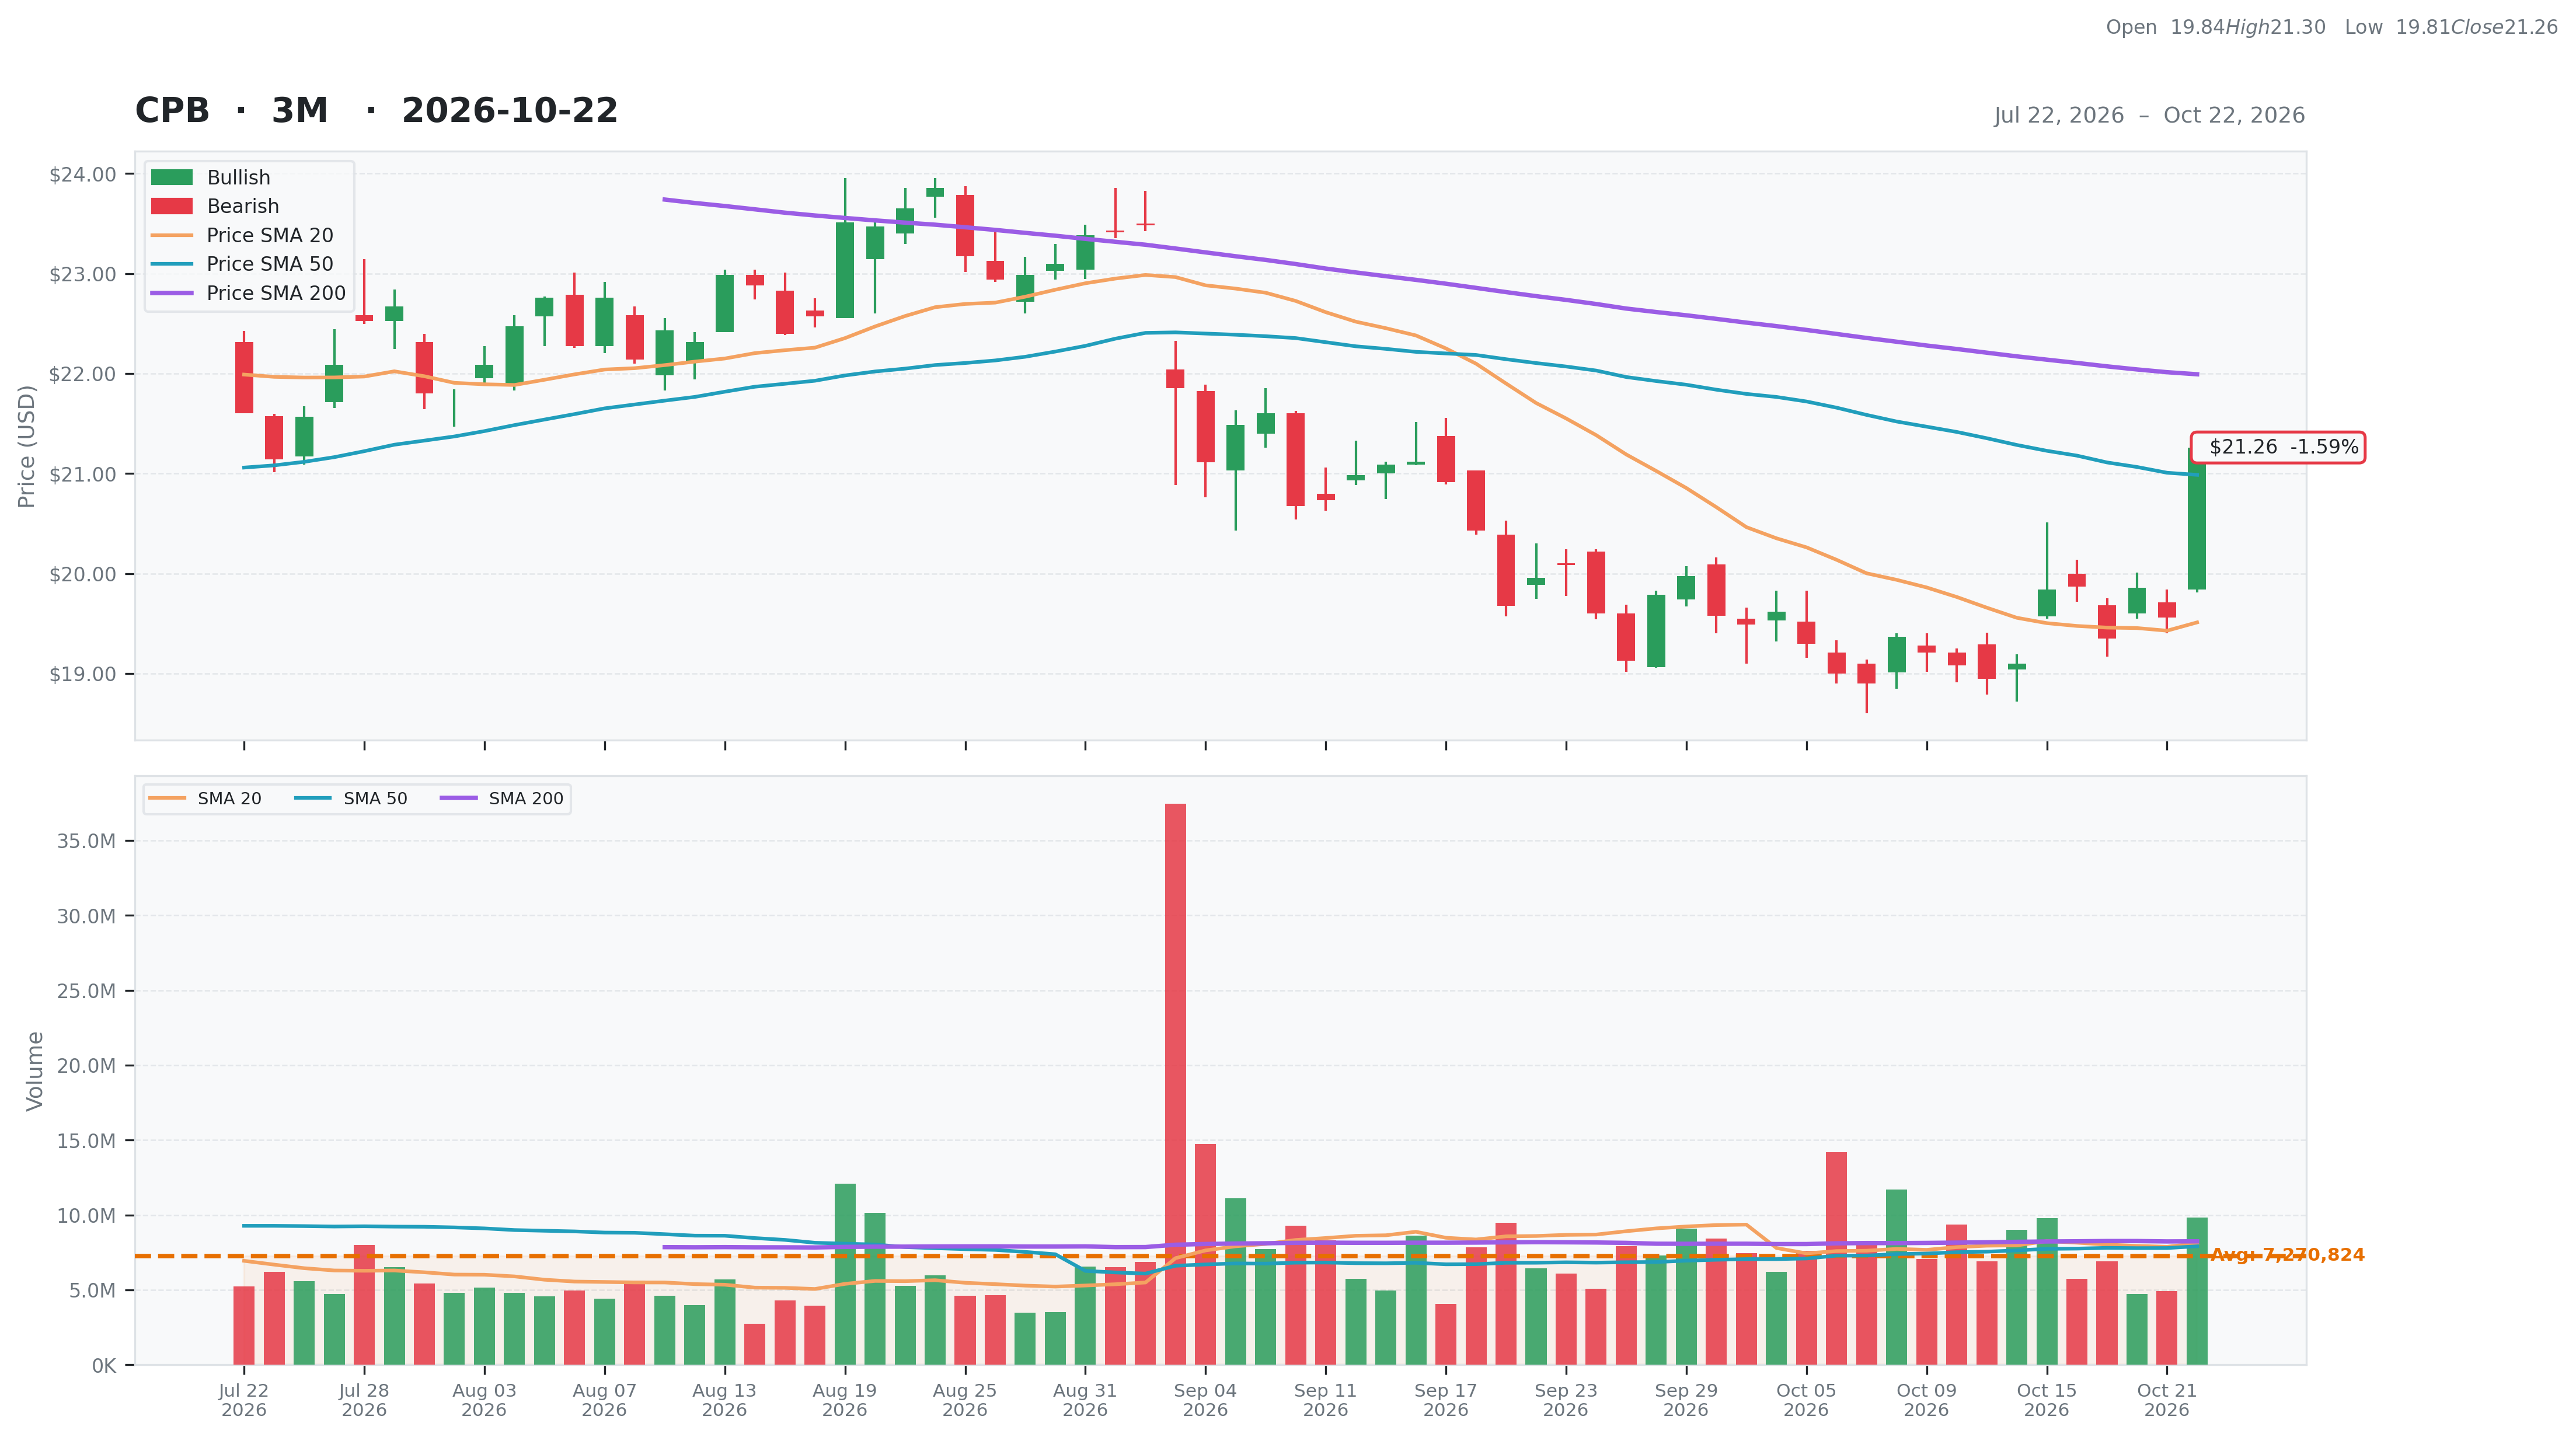
| Total | 41 | Current | $21.26 | 52W High | $29.76 -28.55% | Relative Strength | -0.08 | Beta | 0.04 |
| Business Quality | 9 | Weekly | $19.84 7.16% | 52W Low | $18.90 12.49% | 3M | -0.01 | Short % | 0.23 |
| Financial Strength | 4 | Monthly | $19.96 6.54% | Above 50DMA | $20.99 1.30% | 6M | 0.04 | Risk Score | 1 |
| Growth Outlook | 5 | Quarterly | $21.56 -1.41% | Above 200DMA | $21.99 -3.33% | 9M | -0.16 | ||
| Momentum | 0 | Yearly | $29.50 -27.94% | 12M | -0.27 | ||||
| Valuation | Financial Strength | Growth/Profitability | |||
|---|---|---|---|---|---|
| Trailing P/E | 15.17 | Cash | 394M | Revenue Growth | -0.08% |
| Forward P/E | 10.82 | Debt | 7,450M | Earnings Growth | N/A |
| PEG Ratio | 0.51 | Debt/Equity | 179.26 | Qtr Earnings Growth | N/A |
| Price/Sales | 0.61 | Current Ratio | 0.82 | Gross Margin | 0.29% |
| Price/Book | 1.54 | Quick Ratio | 0.29 | Operating Margin | 0.10% |
| EV/Revenue | 1.36 | Operating CF | 1,039M | Profit Margin | 0.04% |
| EV/EBITDA | 8.20 | Free CF | 634M | EBITDA Margin | 0.17% |
| Ent Value | 13,288M | Return on Assets | 0.05% | ||
| Return on Equity | 0.10% | ||||
| Technical | Volume & Bollinger Bands | Analyst | |||
|---|---|---|---|---|---|
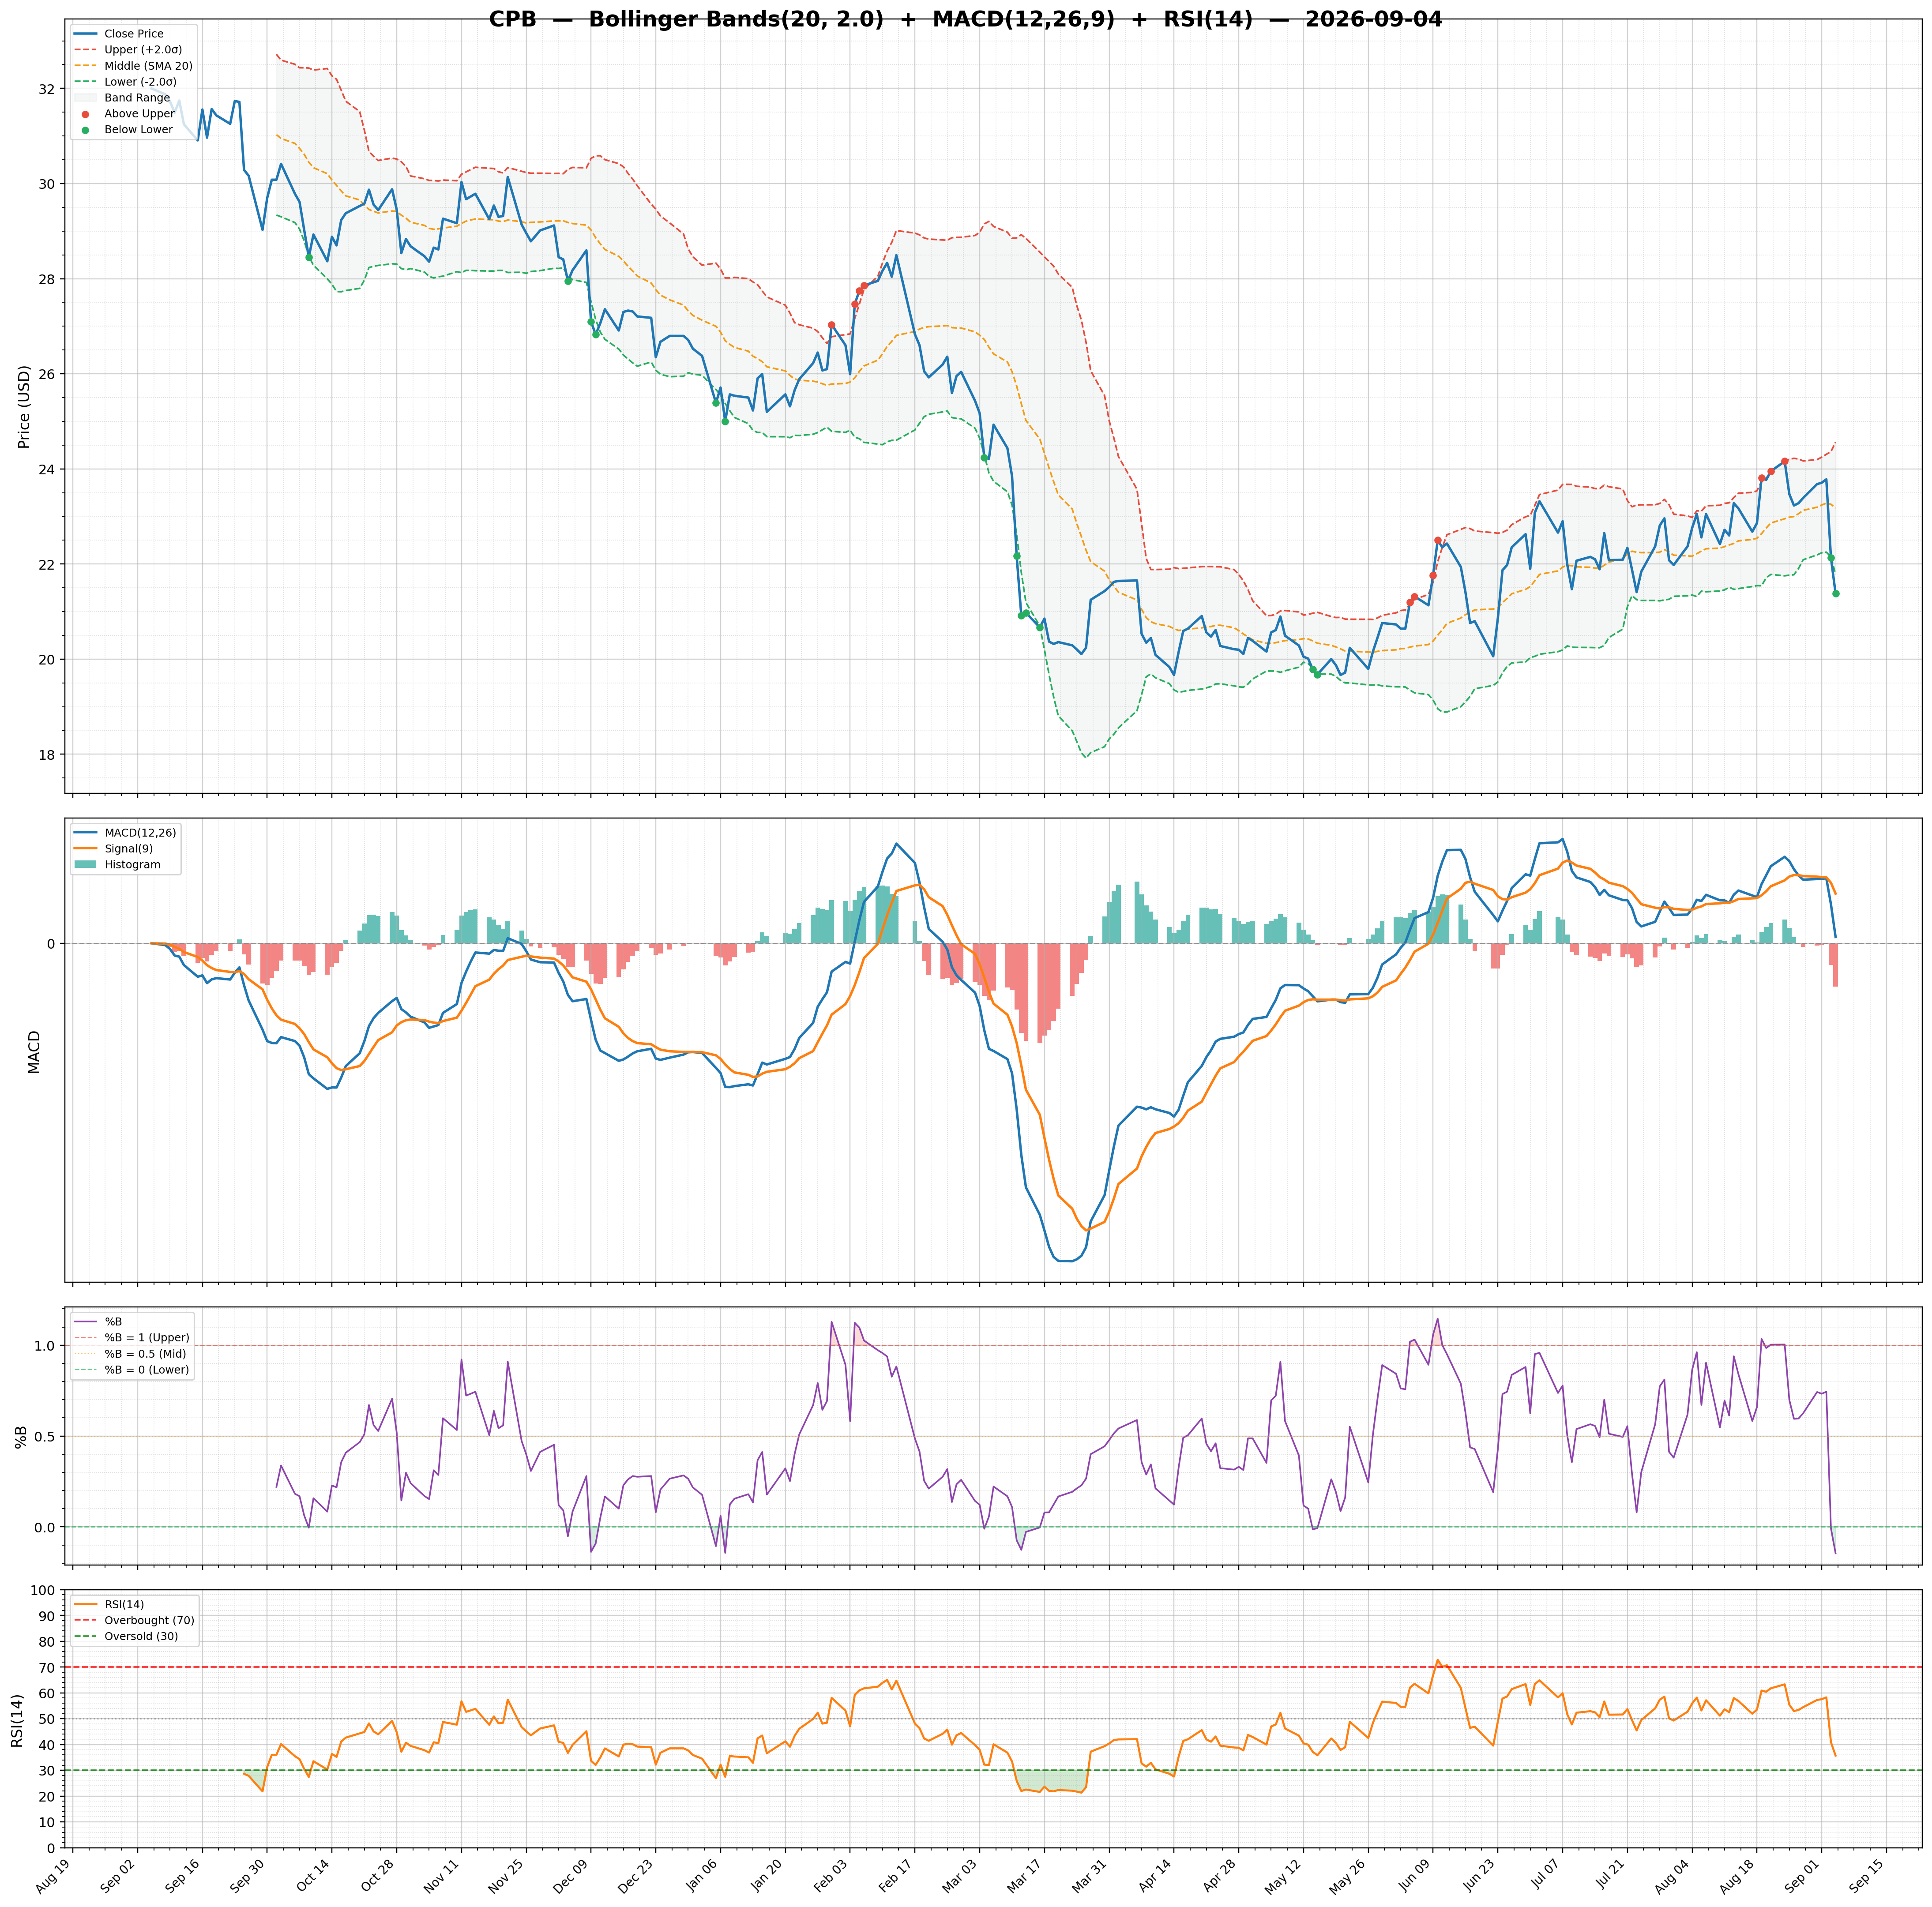
| RSI | 61.56 | Volume | 5.72M | Rating | hold |
| Previous RSI | 46.00 | Avg Volume 20D | 8.11M | Target Mean | $20.79 |
| RSI Trend | Up | Relative Volume | 1.29 | Target High | $41.50 |
| MACD | -0.18 | Lower Band | 18.45 | Target Low | $16.00 |
| MACD Signal | -0.43 | Middle Band | 19.51 | Target Median | $19.00 |
| Histogram | 0.25 | Upper Band | 20.57 | Analysts | 17 |
| Previous Histogram | 0.15 | Bandwidth | 10.890 | Upside | 4.65% |
| Histogram Trend | Increasing | %B | 1.32 | ||