Corvus Pharmaceuticals, Inc. (CRVS)
Healthcare • Biotechnology • $10.65 • MCap: 800,831,424
https://www.corvuspharma.com • Corvus Pharmaceuticals, Inc., a clinical stage biopharmaceutical company, engages in the development of product candidates that precisely target proteins that are critical to immune cell maturation and function in the United States. The company's lead product candidate is soquelitinib (CPI-818), a selective covalent inhibitor of interleukin 2 inducible T cell kinase (ITK), which is in a multi-center Phase 1b/2 clinical trial for the treatment of peripheral T cell lymphoma, atopic dermatitis, hidradenitis suppurativa, autoimmune lymphoproliferative syndrome, and solid tumors monotherapy, and asthma, diseases. It also developing ciforadenant (CPI-444), an oral small molecule antagonist of the A2A receptor that is in Phase 2 clinical trial for the treatment of first line renal cell cancer; and mupadolimab (CPI-006), a humanized monoclonal antibody, which is in Phase 1 clinical trial for the treatment of non-small cell lung cancer. It has a license agreement with Monash University to research, develop, and commercialize certain antibodies directed to CXCR2 for the treatment of human diseases; and Vernalis (R&D) Limited to develop, manufacture, and commercialize products containing certain adenosine receptor antagonists, including ciforadenant, as well as license agreement with Scripps for the development and commercialization of mupadolimab. Corvus Pharmaceuticals, Inc. was incorporated in 2014 and is based in South San Francisco, California.
Notes
10/05/2026
Aviod
| Score | Price | 52 Week & Averages | Relative Strength | Risk | |||||
|---|---|---|---|---|---|---|---|---|---|
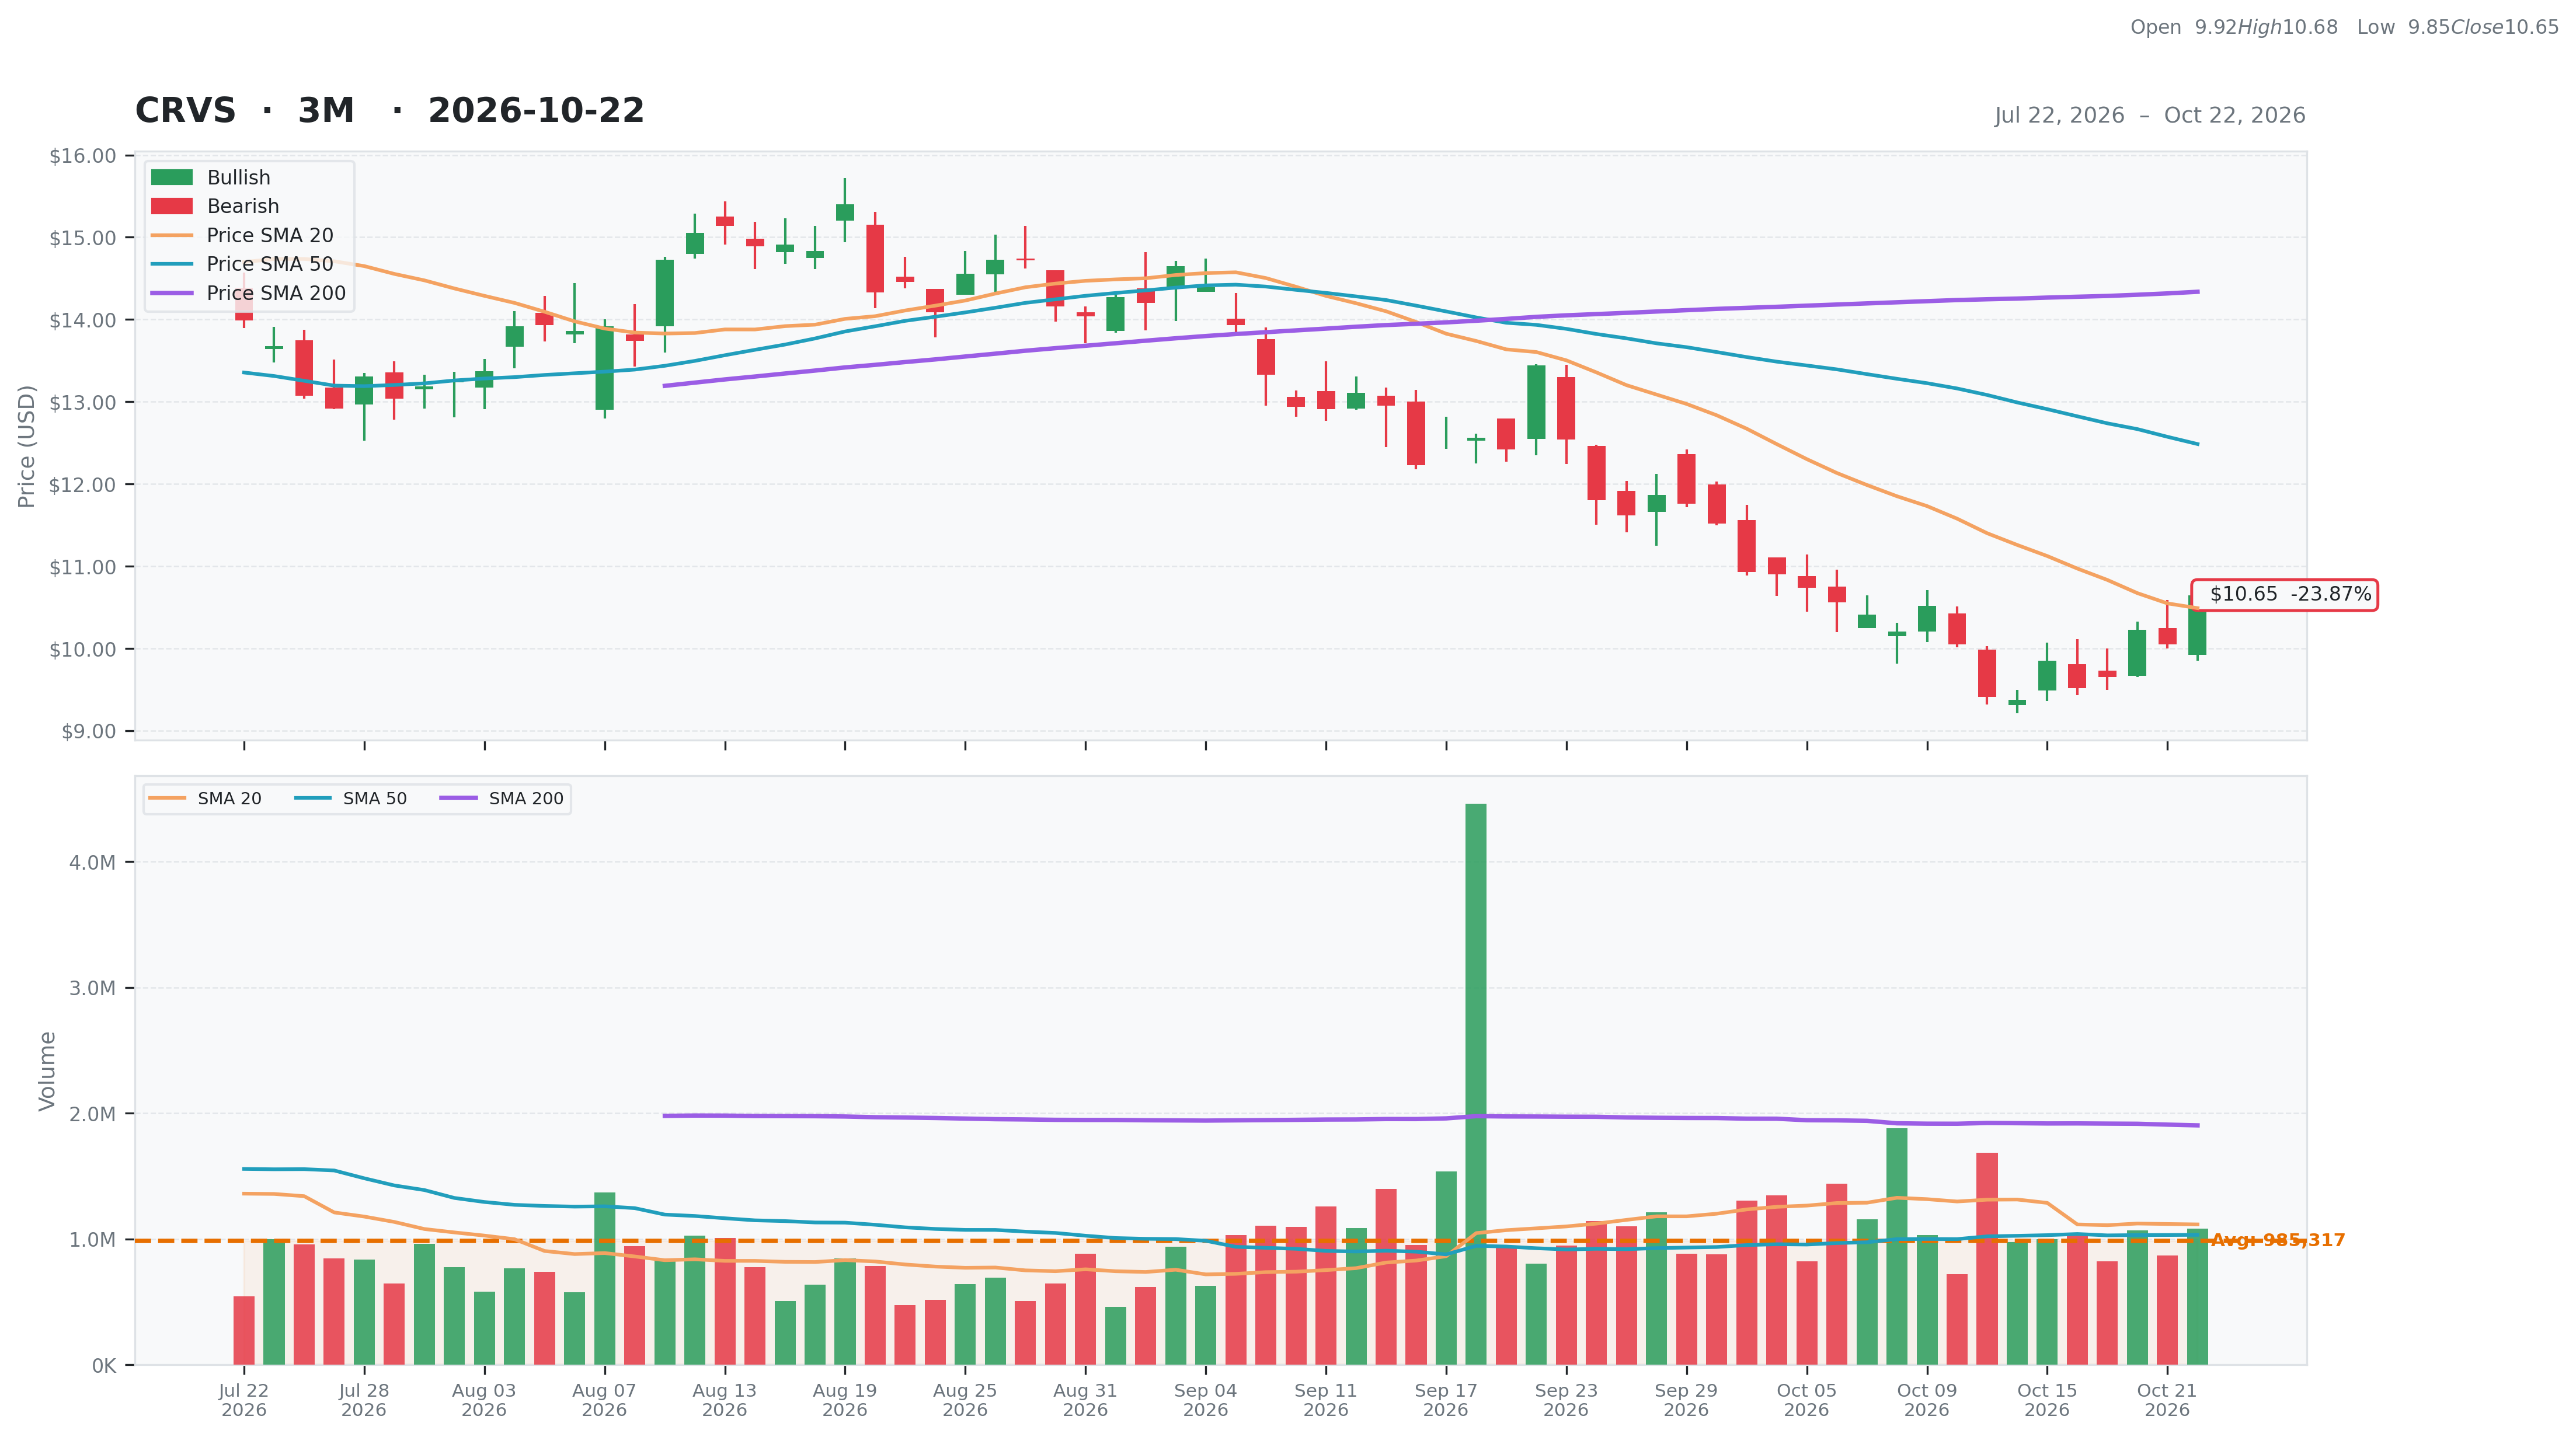
| Total | 31 | Current | $10.65 | 52W High | $25.52 -58.27% | Relative Strength | -0.17 | Beta | 1.43 |
| Business Quality | 1 | Weekly | $9.85 8.12% | 52W Low | $6.50 63.85% | 3M | -0.19 | Short % | 0.24 |
| Financial Strength | 10 | Monthly | $13.44 -20.76% | Above 50DMA | $12.49 -14.71% | 6M | -0.34 | Risk Score | 8 |
| Growth Outlook | 1 | Quarterly | $13.07 -18.52% | Above 200DMA | $14.34 -25.72% | 9M | -0.58 | ||
| Momentum | 3 | Yearly | $7.86 35.50% | 12M | 0.45 | ||||
| Valuation | Financial Strength | Growth/Profitability | |||
|---|---|---|---|---|---|
| Trailing P/E | N/A | Cash | 215M | Revenue Growth | N/A |
| Forward P/E | -8.92 | Debt | 1M | Earnings Growth | N/A |
| PEG Ratio | N/A | Debt/Equity | 0.32 | Qtr Earnings Growth | N/A |
| Price/Sales | N/A | Current Ratio | 16.16 | Gross Margin | 0.00% |
| Price/Book | 3.55 | Quick Ratio | 15.88 | Operating Margin | 0.00% |
| EV/Revenue | N/A | Operating CF | -45M | Profit Margin | 0.00% |
| EV/EBITDA | -10.31 | Free CF | -27M | EBITDA Margin | 0.00% |
| Ent Value | 586M | Return on Assets | -0.22% | ||
| Return on Equity | -0.35% | ||||
| Technical | Volume & Bollinger Bands | Analyst | |||
|---|---|---|---|---|---|
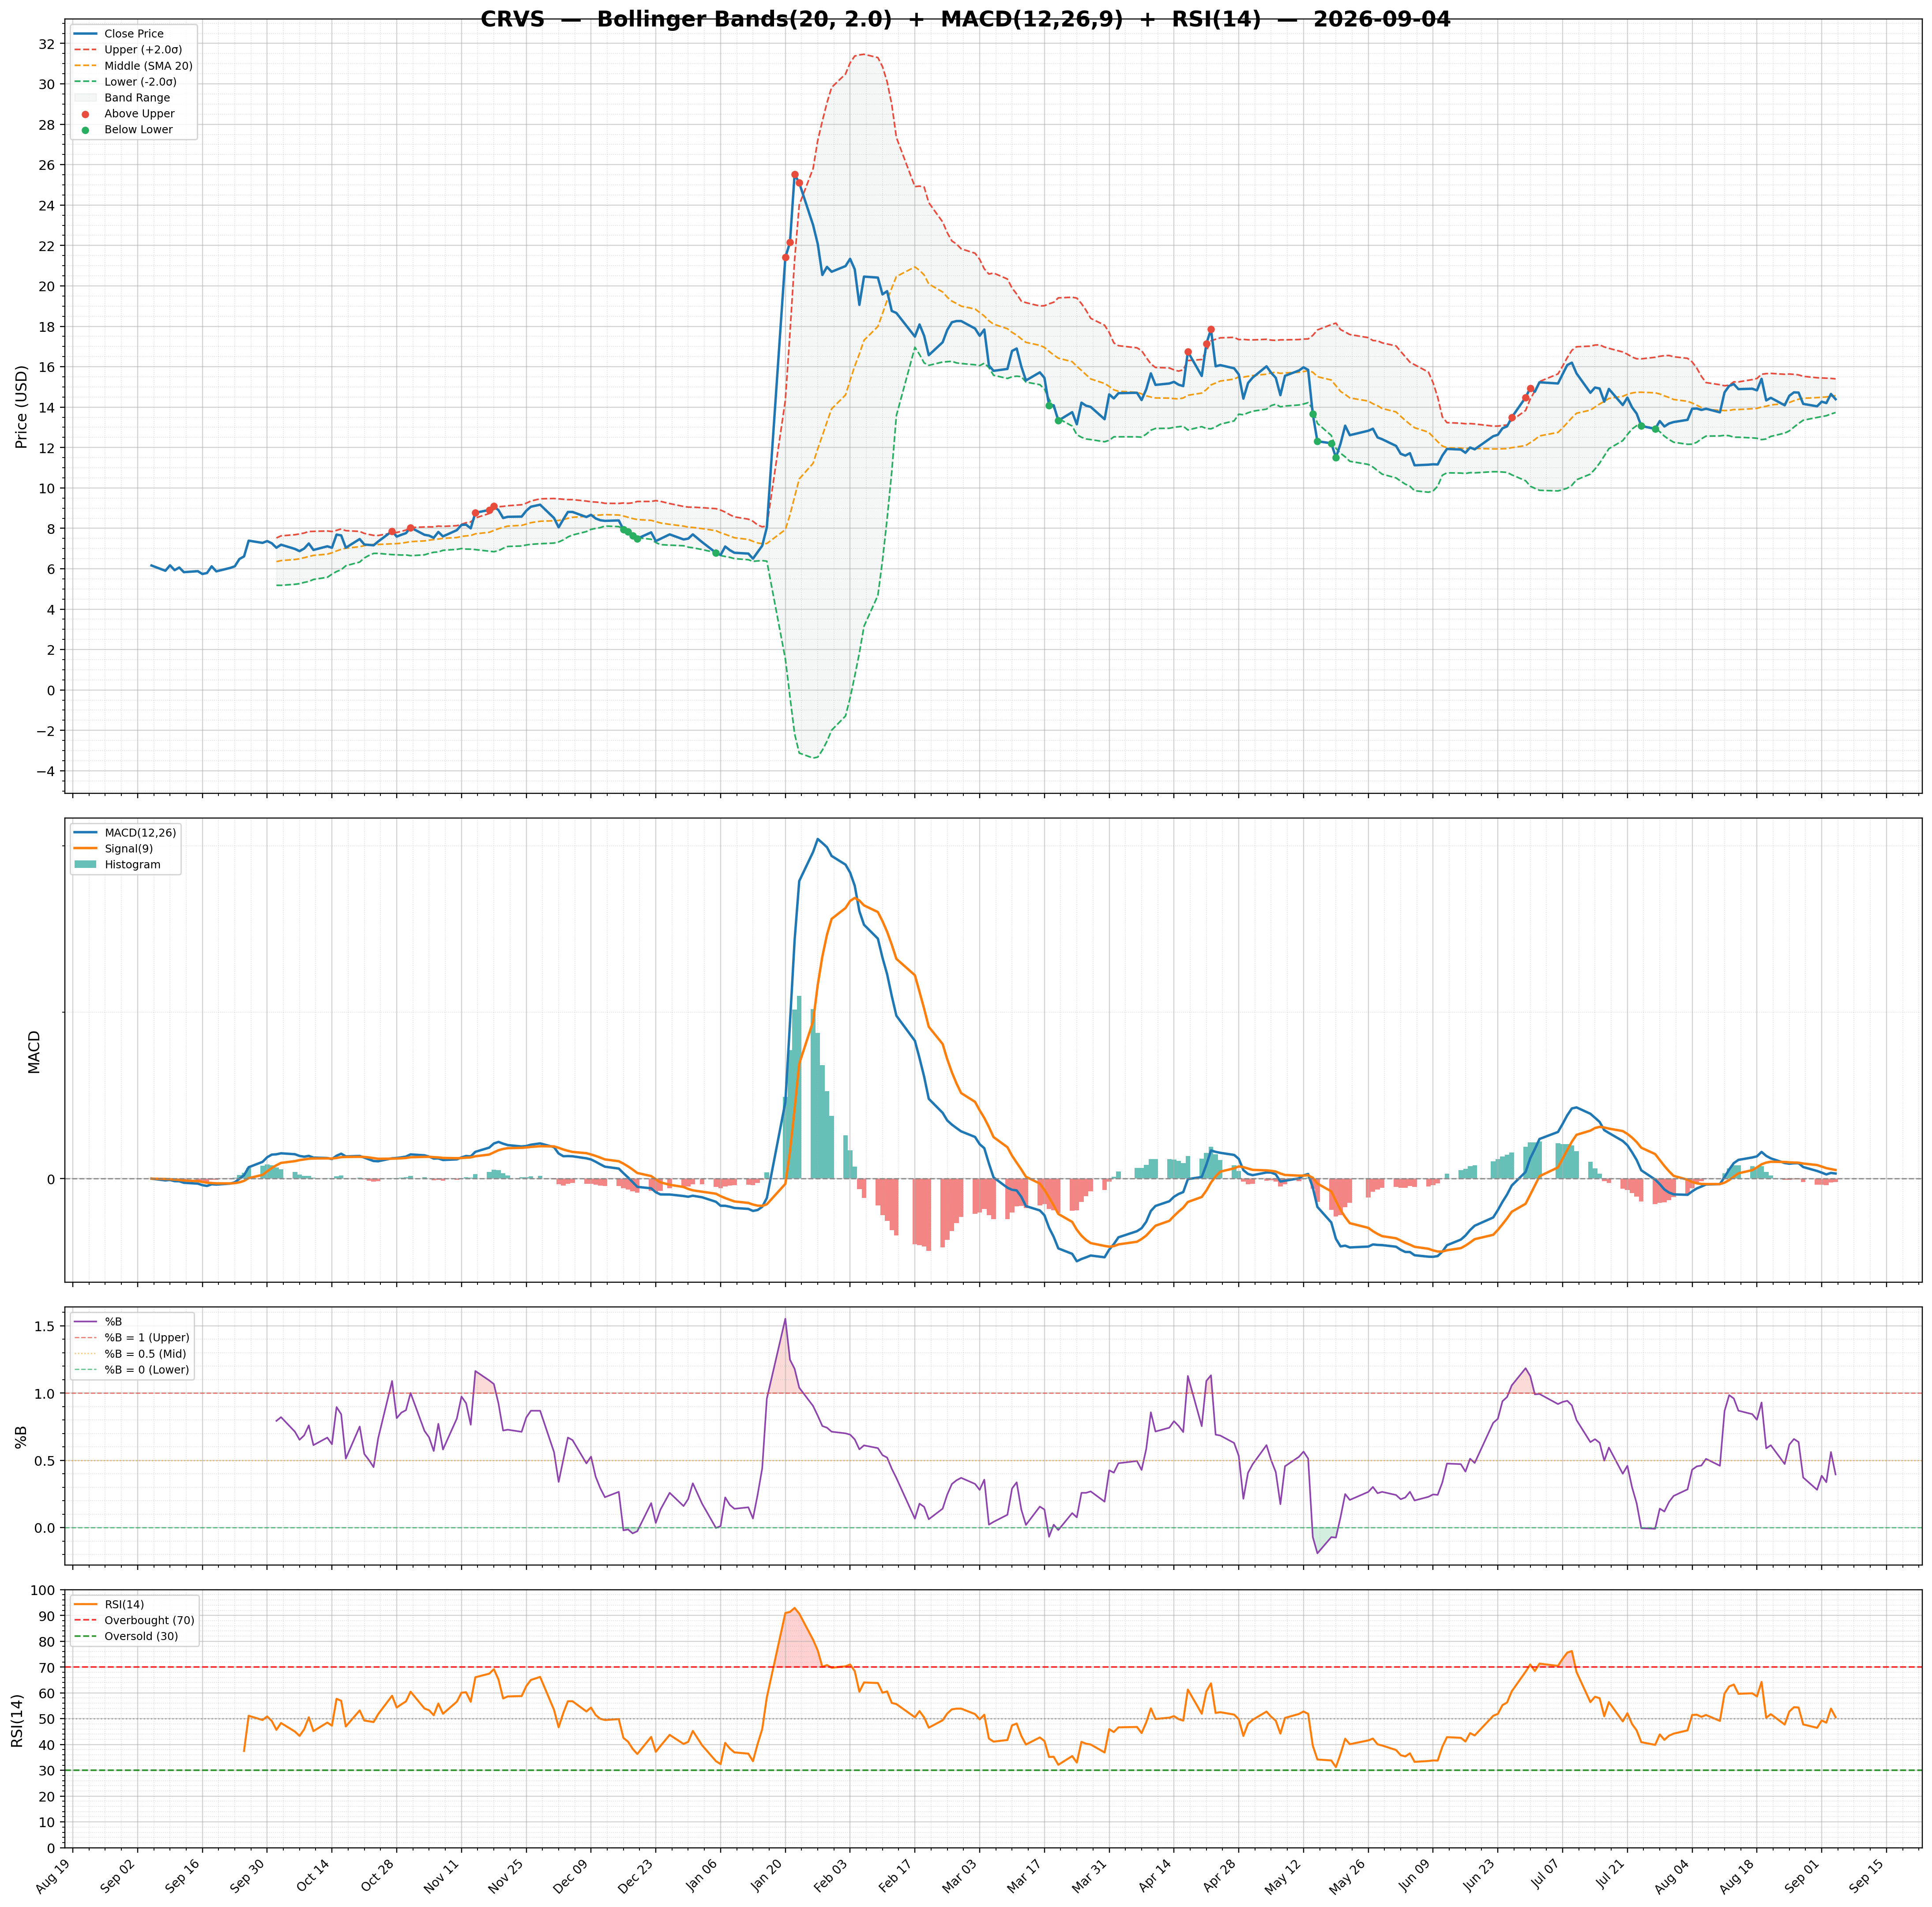
| RSI | 46.37 | Volume | 1.04M | Rating | strong_buy |
| Previous RSI | 38.67 | Avg Volume 20D | 1.12M | Target Mean | $33.14 |
| RSI Trend | Up | Relative Volume | 0.88 | Target High | $42.00 |
| MACD | -0.69 | Lower Band | 8.95 | Target Low | $27.00 |
| MACD Signal | -0.82 | Middle Band | 10.49 | Target Median | $32.00 |
| Histogram | 0.13 | Upper Band | 12.03 | Analysts | 7 |
| Previous Histogram | 0.06 | Bandwidth | 29.410 | Upside | 248.14% |
| Histogram Trend | Increasing | %B | 0.55 | ||