Claritev Corporation (CTEV)
Healthcare • Health Information Services • $23.5 • MCap: 374,877,920
https://www.claritev.com • Claritev Corporation, together with its subsidiaries, provides data analytics and technology-enabled end-to-end cost management, payment, and revenue integrity solutions to the healthcare industry in the United States. The company offers claims intelligence solutions, including reference-based pricing, negotiation services, surprise bill services, and Vistara; network solutions, such as primary networks, complementary networks, and network build and network management services; and payment and revenue integrity solutions comprising clinical negotiation, pre-payment integrity, post-payment integrity, and revenue integrity services. It also provides data and analytics solutions consists of PlanOptix, CompleteVue, BenInsights, risk scores, and supplemental carrier services. The company provides solutions to commercial healthcare payers, third party administrators, employers, brokers/consultants, providers, government healthcare payers and system integrators. It serves national and regional insurance companies, Blue Cross and Blue Shield plans, provider-sponsored and independent health plans, TPAs, property and casualty insurers, bill review companies and other companies involved in the claims adjudication process. The company was formerly known as MultiPlan Corporation and changed its name to Claritev Corporation in February 2025. Claritev Corporation was founded in 1980 and is headquartered in McLean, Virginia.
Watch List
| Score | Price | 52 Week & Averages | Relative Strength | Risk | |||||
|---|---|---|---|---|---|---|---|---|---|
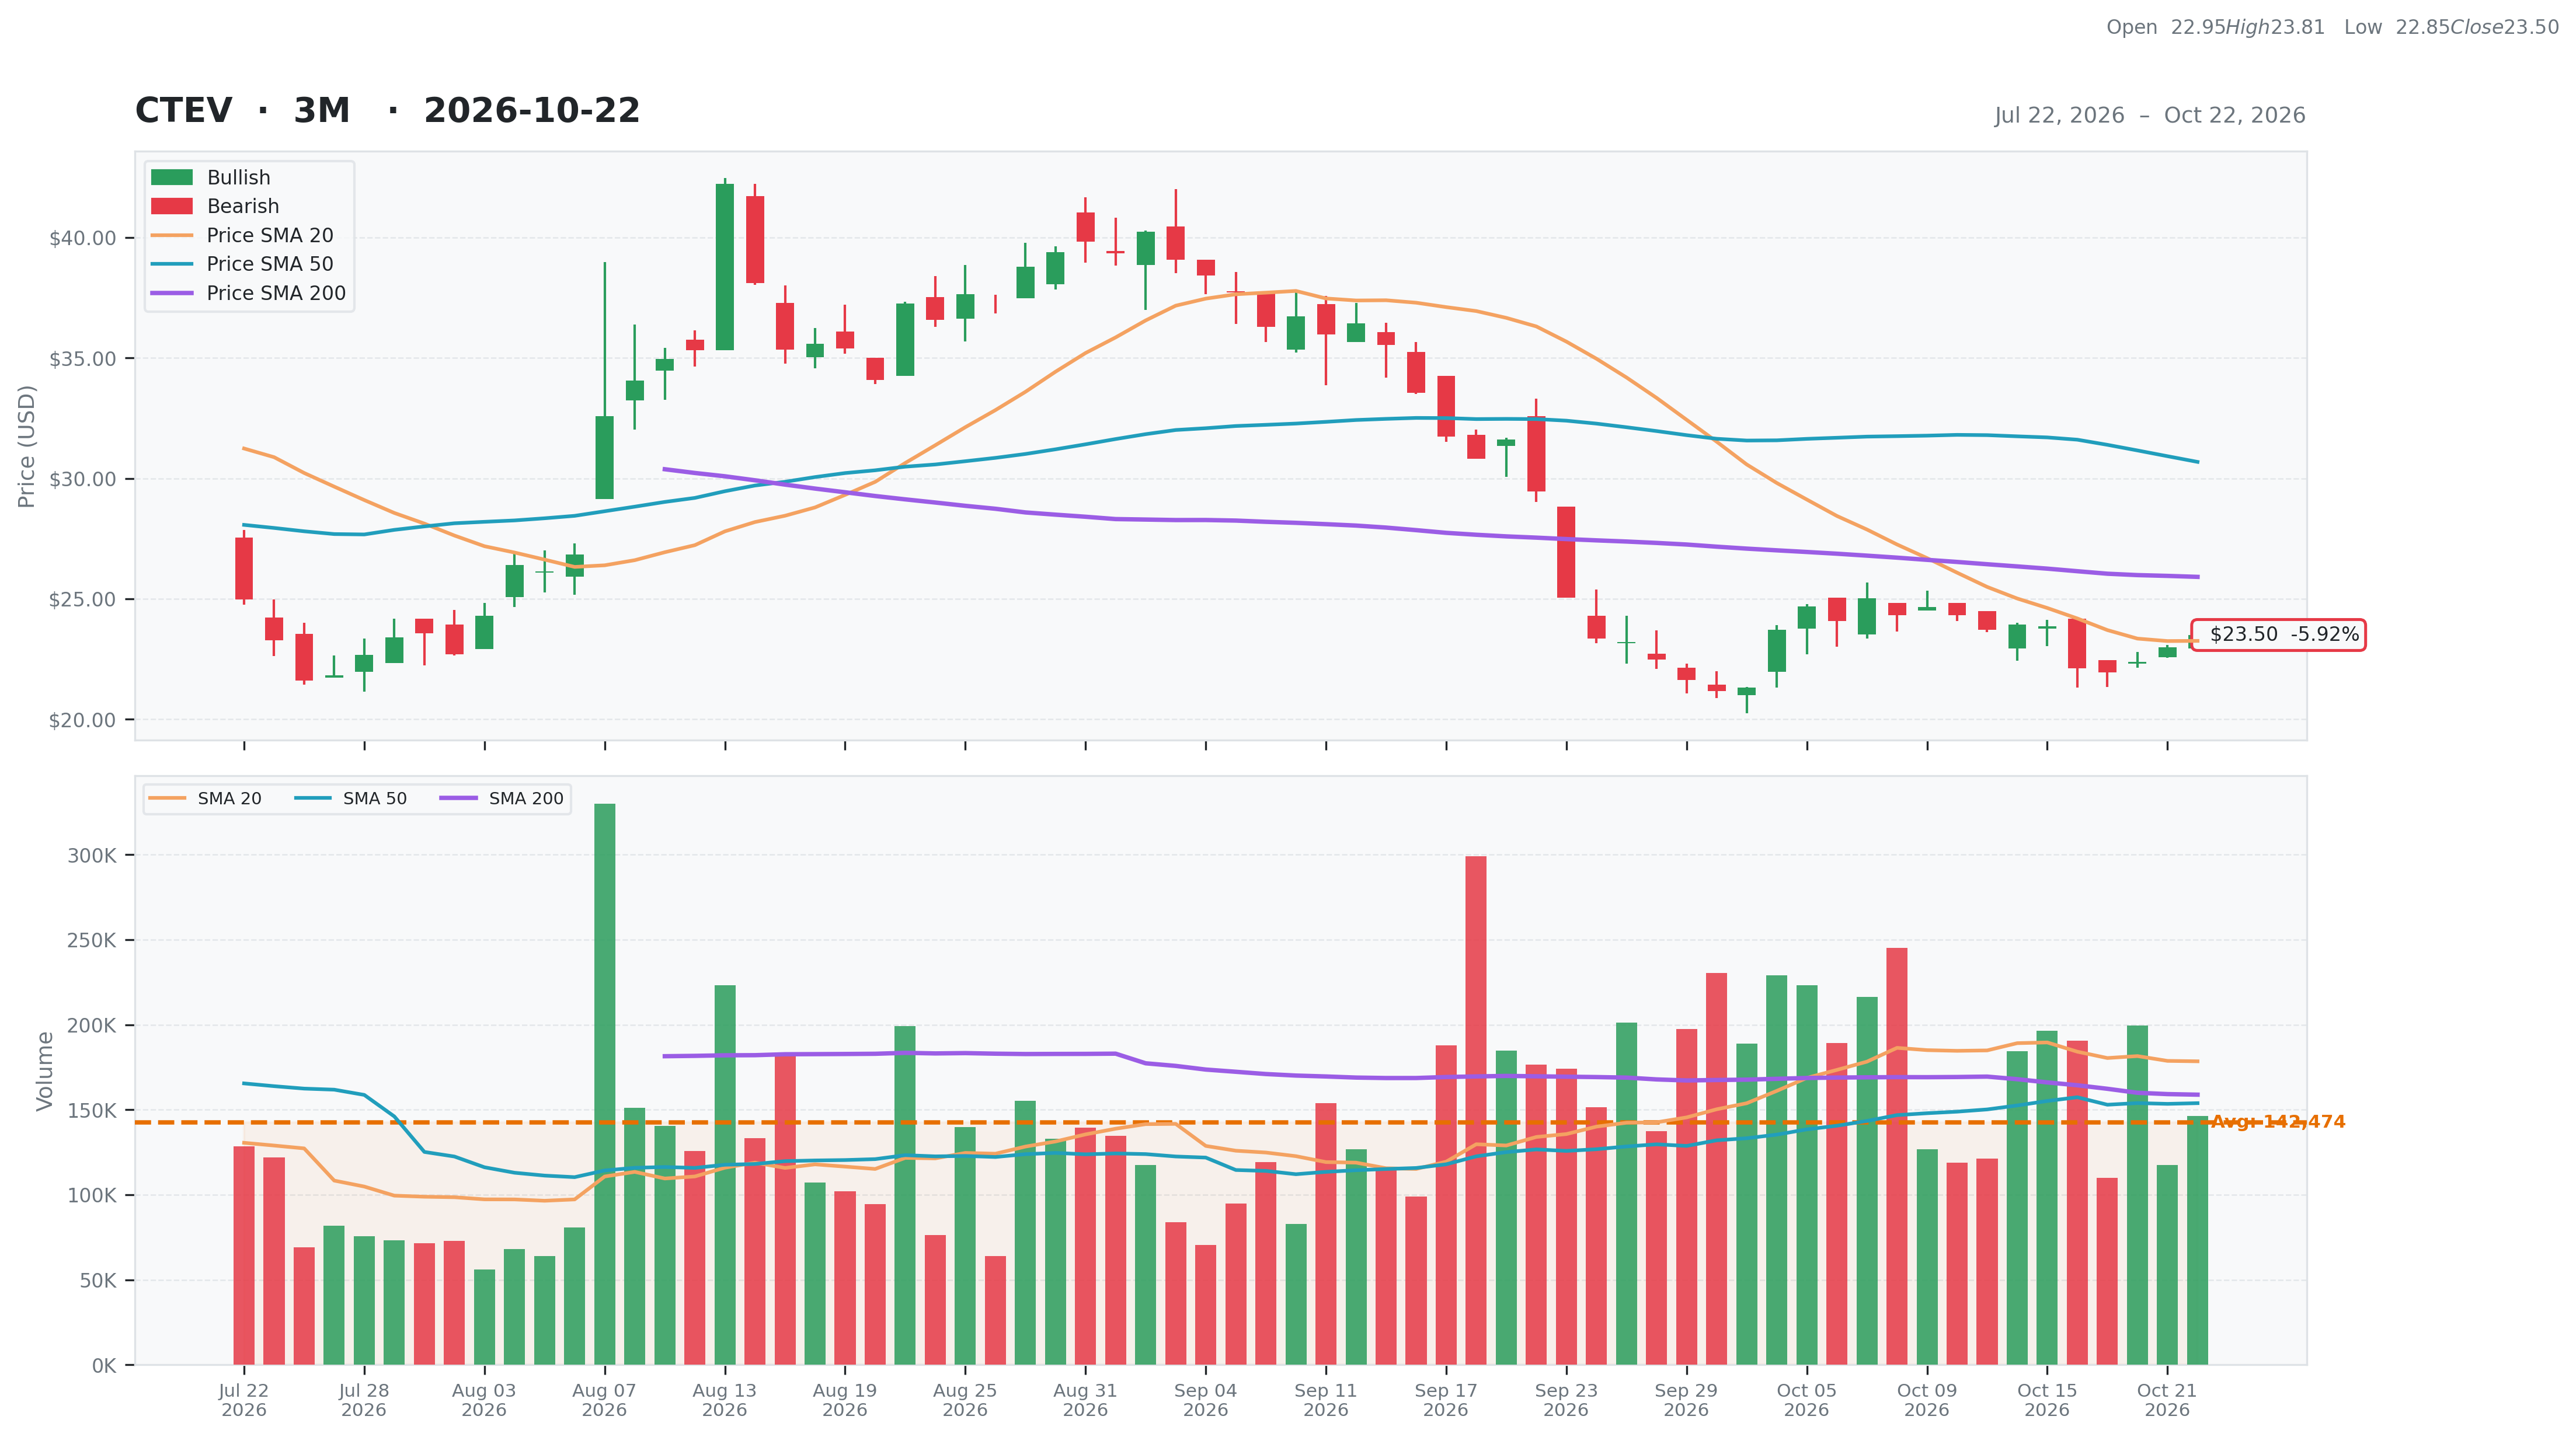
| Total | 49 | Current | $23.50 | 52W High | $71.36 -67.07% | Relative Strength | -0.11 | Beta | 0.94 |
| Business Quality | 15 | Weekly | $23.86 -1.51% | 52W Low | $13.47 74.46% | 3M | 0.09 | Short % | 0.1 |
| Financial Strength | 10 | Monthly | $29.45 -20.20% | Above 50DMA | $30.69 -23.42% | 6M | 0.16 | Risk Score | 9 |
| Growth Outlook | 1 | Quarterly | $21.61 8.75% | Above 200DMA | $25.91 -9.31% | 9M | -0.22 | ||
| Momentum | 2 | Yearly | $71.36 -67.07% | 12M | -0.66 | ||||
| Valuation | Financial Strength | Growth/Profitability | |||
|---|---|---|---|---|---|
| Trailing P/E | N/A | Cash | 14M | Revenue Growth | 0.07% |
| Forward P/E | 3.02 | Debt | 4,694M | Earnings Growth | N/A |
| PEG Ratio | N/A | Debt/Equity | N/A | Qtr Earnings Growth | N/A |
| Price/Sales | 0.38 | Current Ratio | 1.00 | Gross Margin | 0.73% |
| Price/Book | -1.27 | Quick Ratio | 0.69 | Operating Margin | 0.13% |
| EV/Revenue | 5.09 | Operating CF | 133M | Profit Margin | -0.28% |
| EV/EBITDA | 9.38 | Free CF | 103M | EBITDA Margin | 0.54% |
| Ent Value | 5,061M | Return on Assets | 0.01% | ||
| Return on Equity | N/A | ||||
| Technical | Volume & Bollinger Bands | Analyst | |||
|---|---|---|---|---|---|
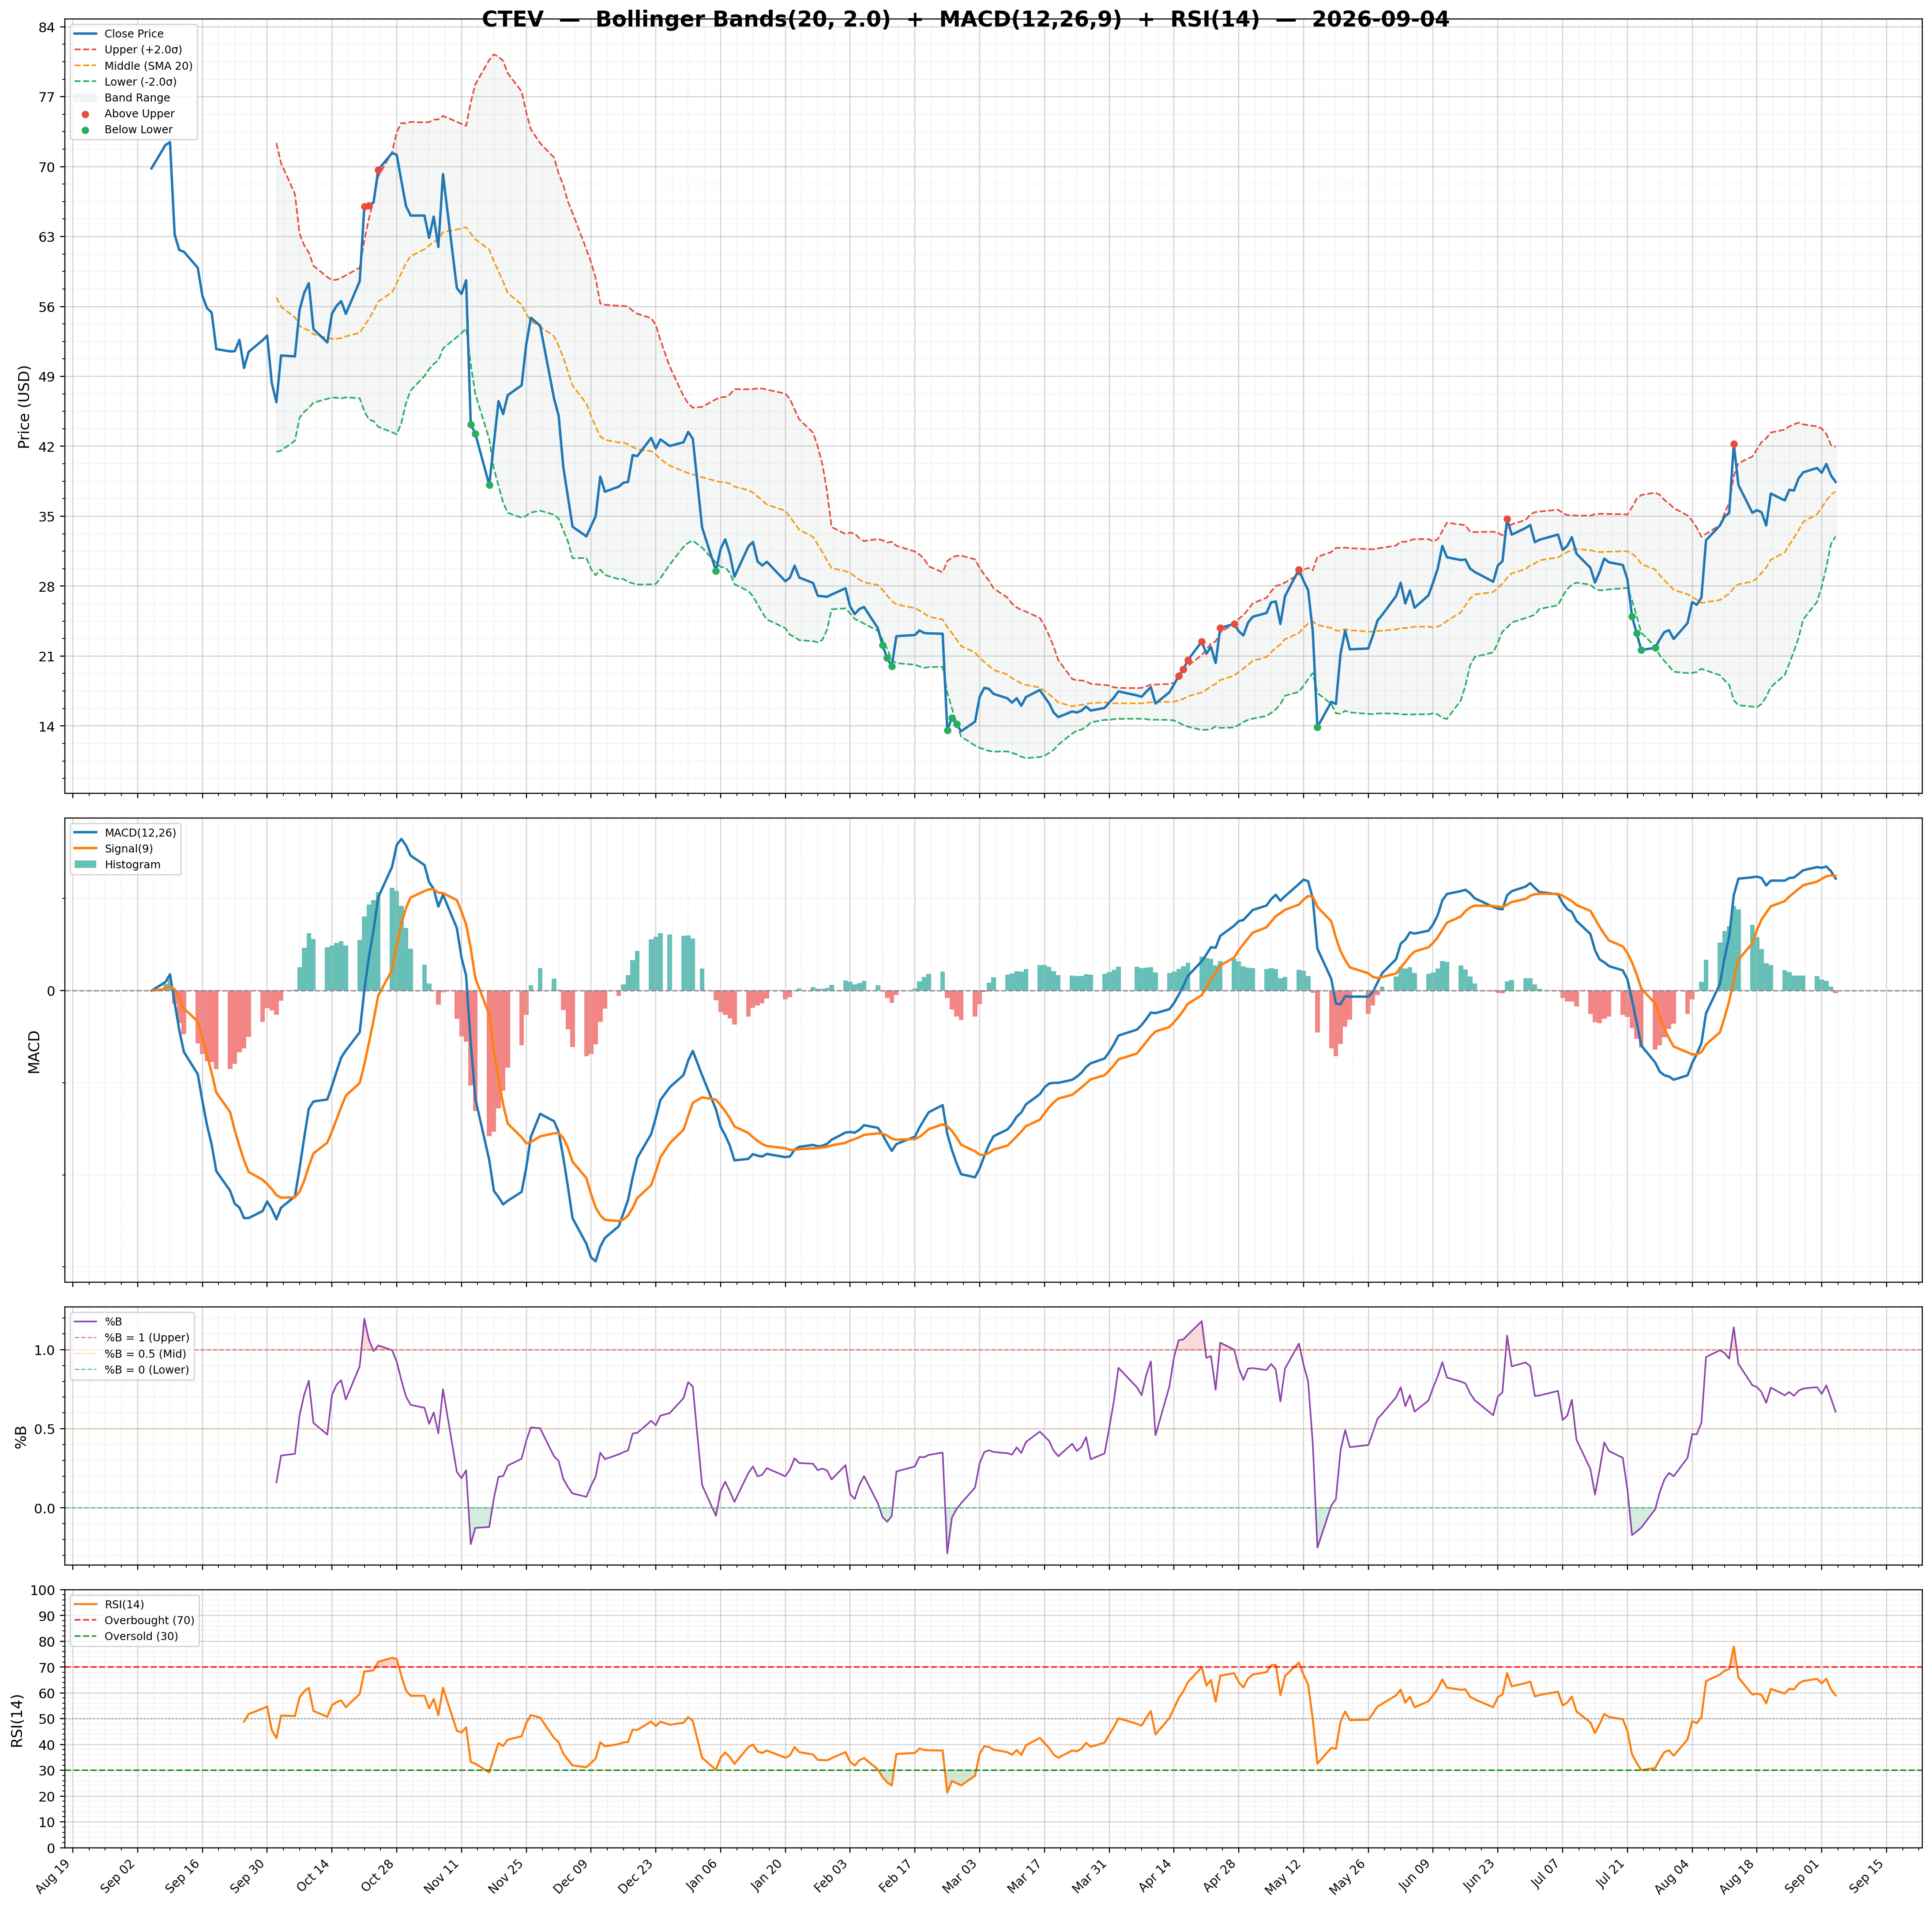
| RSI | 40.52 | Volume | 0.19M | Rating | none |
| Previous RSI | 37.76 | Avg Volume 20D | 0.18M | Target Mean | $46.00 |
| RSI Trend | Up | Relative Volume | 0.84 | Target High | $73.00 |
| MACD | -1.88 | Lower Band | 20.89 | Target Low | $30.00 |
| MACD Signal | -2.20 | Middle Band | 23.26 | Target Median | $43.00 |
| Histogram | 0.32 | Upper Band | 25.62 | Analysts | 5 |
| Previous Histogram | 0.25 | Bandwidth | 20.360 | Upside | 107.96% |
| Histogram Trend | Increasing | %B | 0.55 | ||