Castor Maritime Inc. (CTRM)
Industrials • Marine Shipping • $1.59 • MCap: 15,846,260
https://www.castormaritime.com • Castor Maritime Inc. operates as a shipping and energy company worldwide. The company operates through Dry Bulk, Containership, and Asset Management segments. It offers seaborne transportation services for dry bulk and containership cargoes; and transportation of commodities, such as iron ore, coal, and soybeans. The company also provides technical and commercial ship management and energy infrastructure project services. As of December 31, 2025, the company owned and operated a fleet of 9 vessels primarily consisting of four Kamsarmax, three Panamax, and one Ultramax dry bulk vessels, as well as one 1,850 TEU containerships. Castor Maritime Inc. was incorporated in 2017 and is based in Limassol, Cyprus.
AAII
Ani
NEW AAII Inv on Indicators
Joie
Notes
10/05/2026
Sold on 10/5/2026
| Score | Price | 52 Week & Averages | Relative Strength | Risk | |||||
|---|---|---|---|---|---|---|---|---|---|
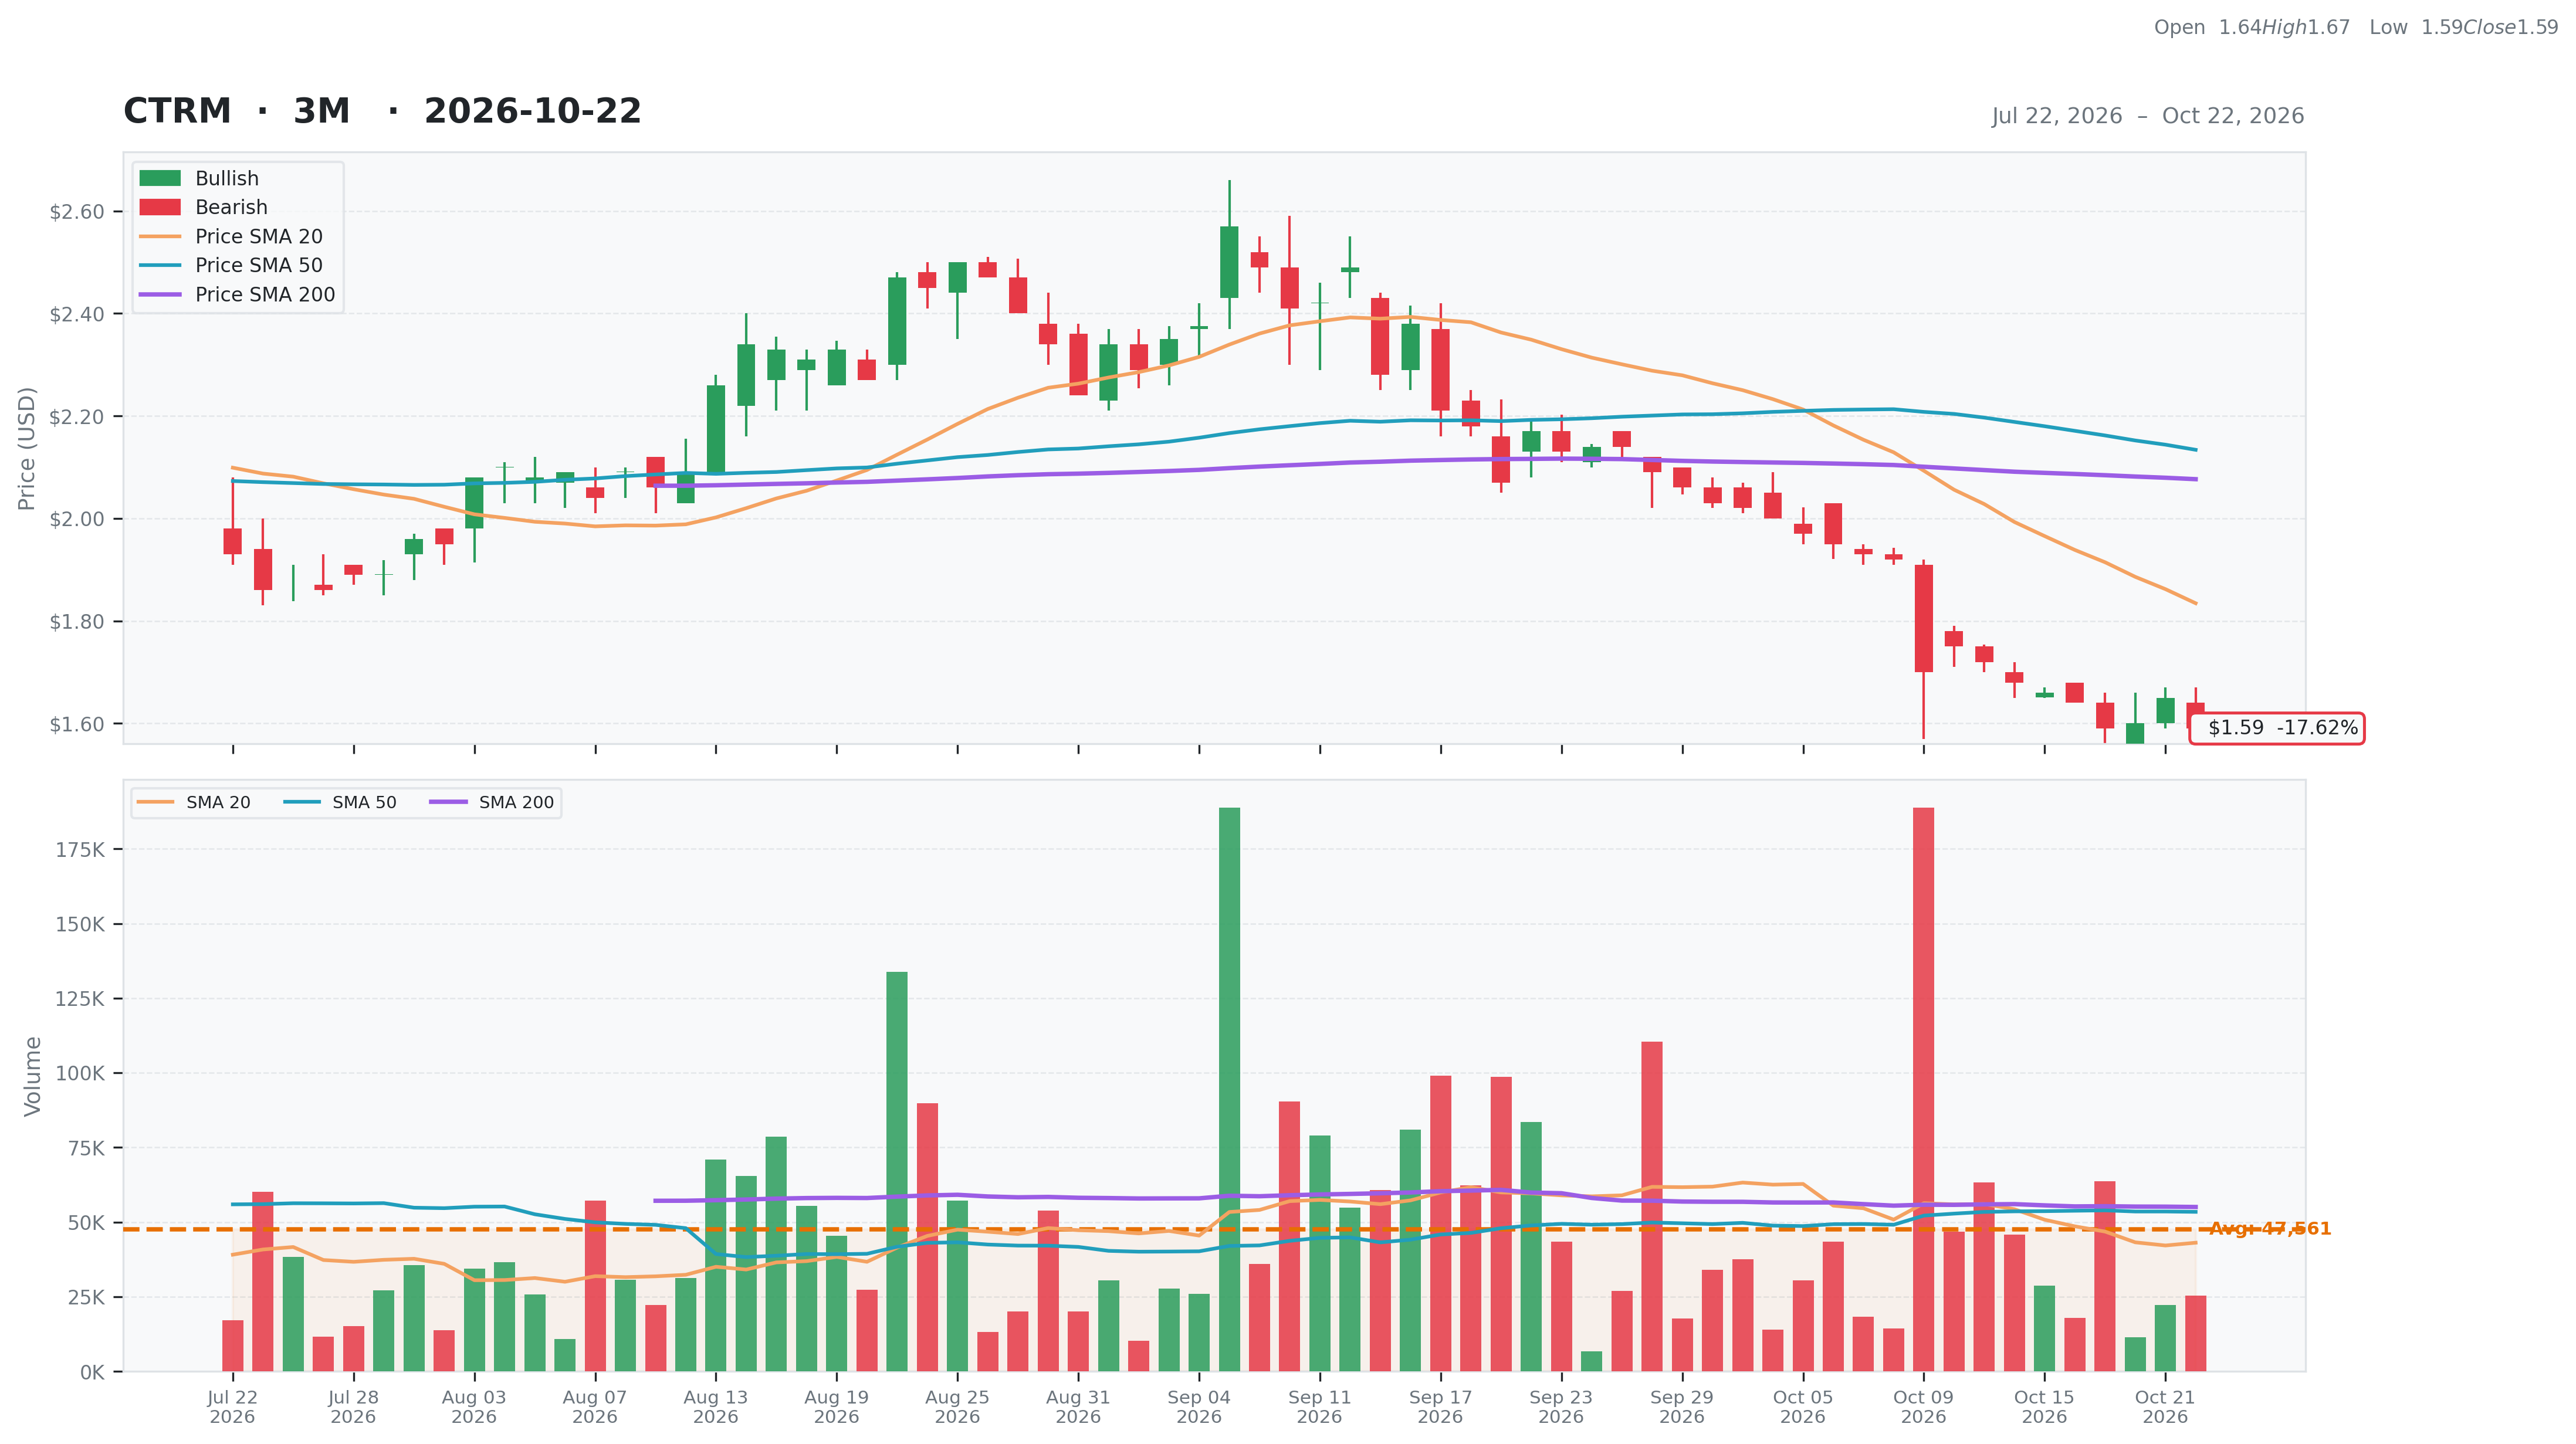
| Total | 57 | Current | $1.59 | 52W High | $2.64 -39.77% | Relative Strength | -0.19 | Beta | 1.30 |
| Business Quality | 16 | Weekly | $1.66 -4.22% | 52W Low | $1.59 0.00% | 3M | -0.15 | Short % | 0 |
| Financial Strength | 17 | Monthly | $2.17 -26.73% | Above 50DMA | $2.13 -25.49% | 6M | -0.17 | Risk Score | |
| Growth Outlook | 5 | Quarterly | $1.87 -14.97% | Above 200DMA | $2.08 -23.43% | 9M | -0.25 | ||
| Momentum | 0 | Yearly | $2.07 -23.19% | 12M | -0.24 | ||||
| Valuation | Financial Strength | Growth/Profitability | |||
|---|---|---|---|---|---|
| Trailing P/E | 0.92 | Cash | 113M | Revenue Growth | 0.42% |
| Forward P/E | N/A | Debt | 79M | Earnings Growth | -0.10% |
| PEG Ratio | N/A | Debt/Equity | 10.22 | Qtr Earnings Growth | 2.51% |
| Price/Sales | 0.18 | Current Ratio | 4.68 | Gross Margin | 0.50% |
| Price/Book | 0.03 | Quick Ratio | 4.53 | Operating Margin | 0.08% |
| EV/Revenue | 1.97 | Operating CF | 31M | Profit Margin | 1.09% |
| EV/EBITDA | 8.88 | Free CF | -51M | EBITDA Margin | 0.22% |
| Ent Value | 178M | Return on Assets | 0.01% | ||
| Return on Equity | 0.19% | ||||
| Technical | Volume & Bollinger Bands | Analyst | |||
|---|---|---|---|---|---|
| RSI | 27.46 | Volume | 0.02M | Rating | none |
| Previous RSI | 30.11 | Avg Volume 20D | 0.04M | Target Mean | N/A |
| RSI Trend | Down | Relative Volume | 0.50 | Target High | N/A |
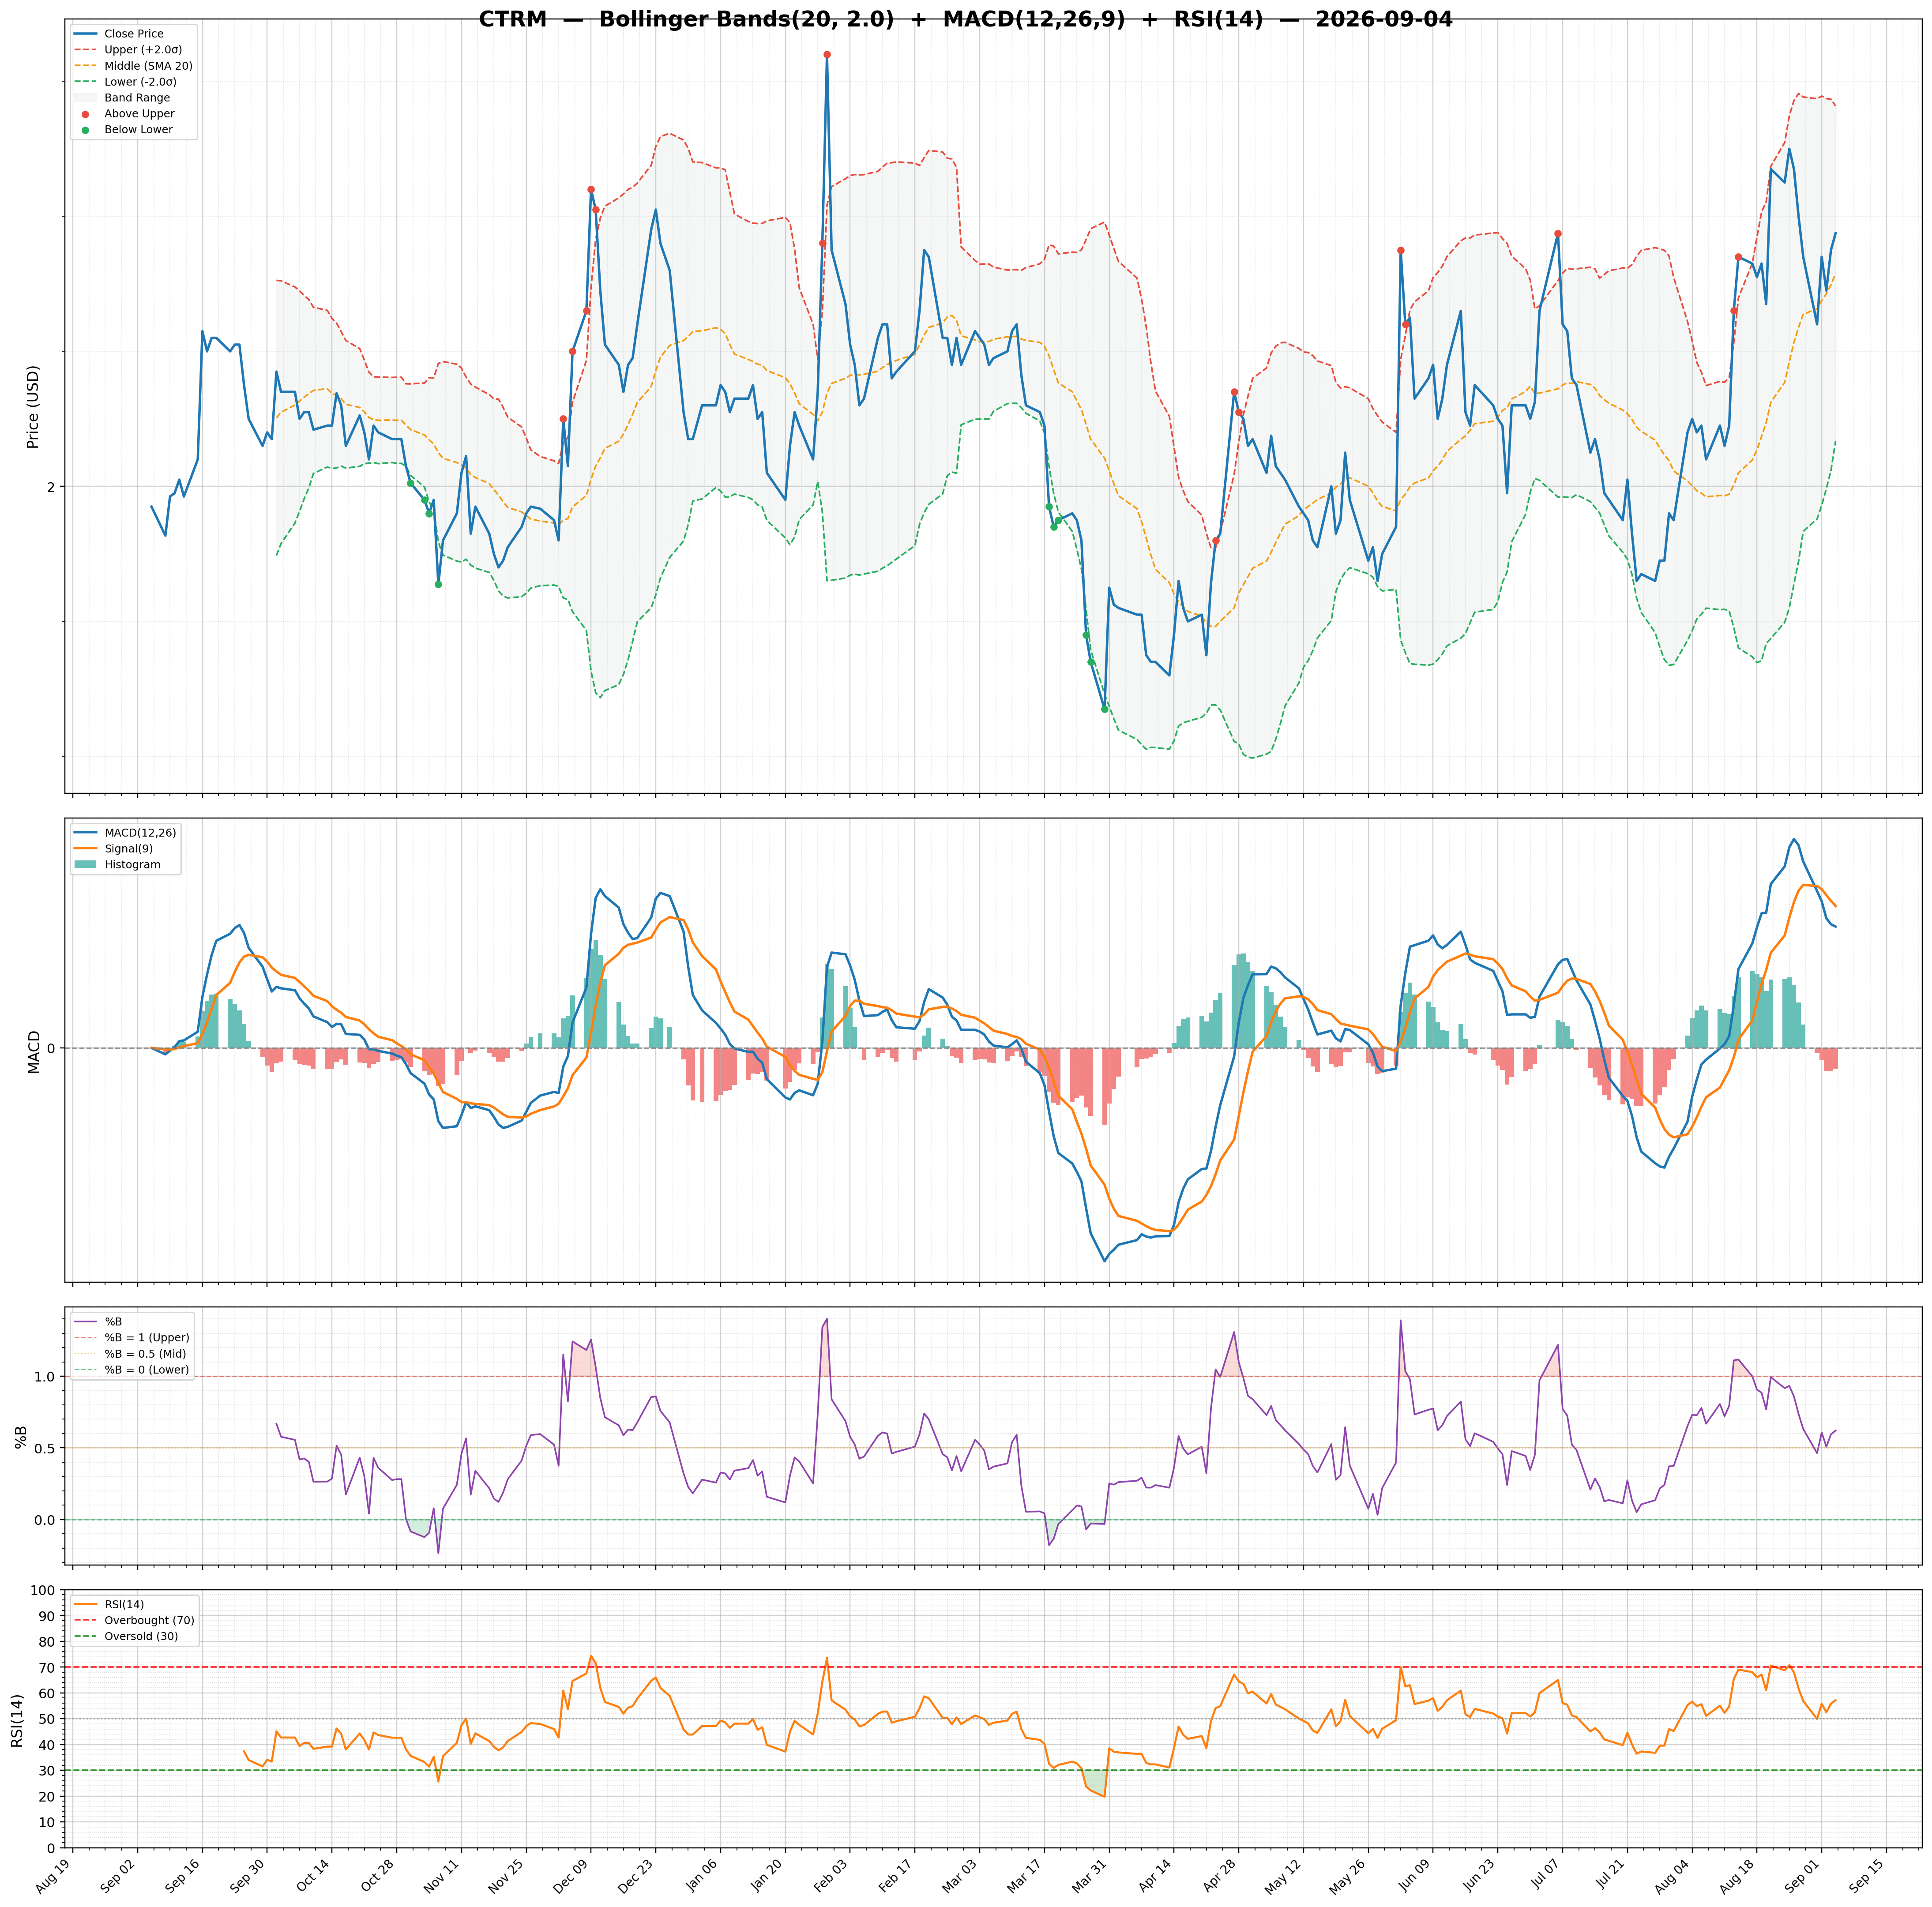
| MACD | -0.16 | Lower Band | 1.45 | Target Low | N/A |
| MACD Signal | -0.14 | Middle Band | 1.83 | Target Median | N/A |
| Histogram | -0.01 | Upper Band | 2.22 | Analysts | N/A |
| Previous Histogram | -0.02 | Bandwidth | 41.750 | Upside | N/A |
| Histogram Trend | Increasing | %B | 0.18 | ||