Carvana Co. (CVNA)
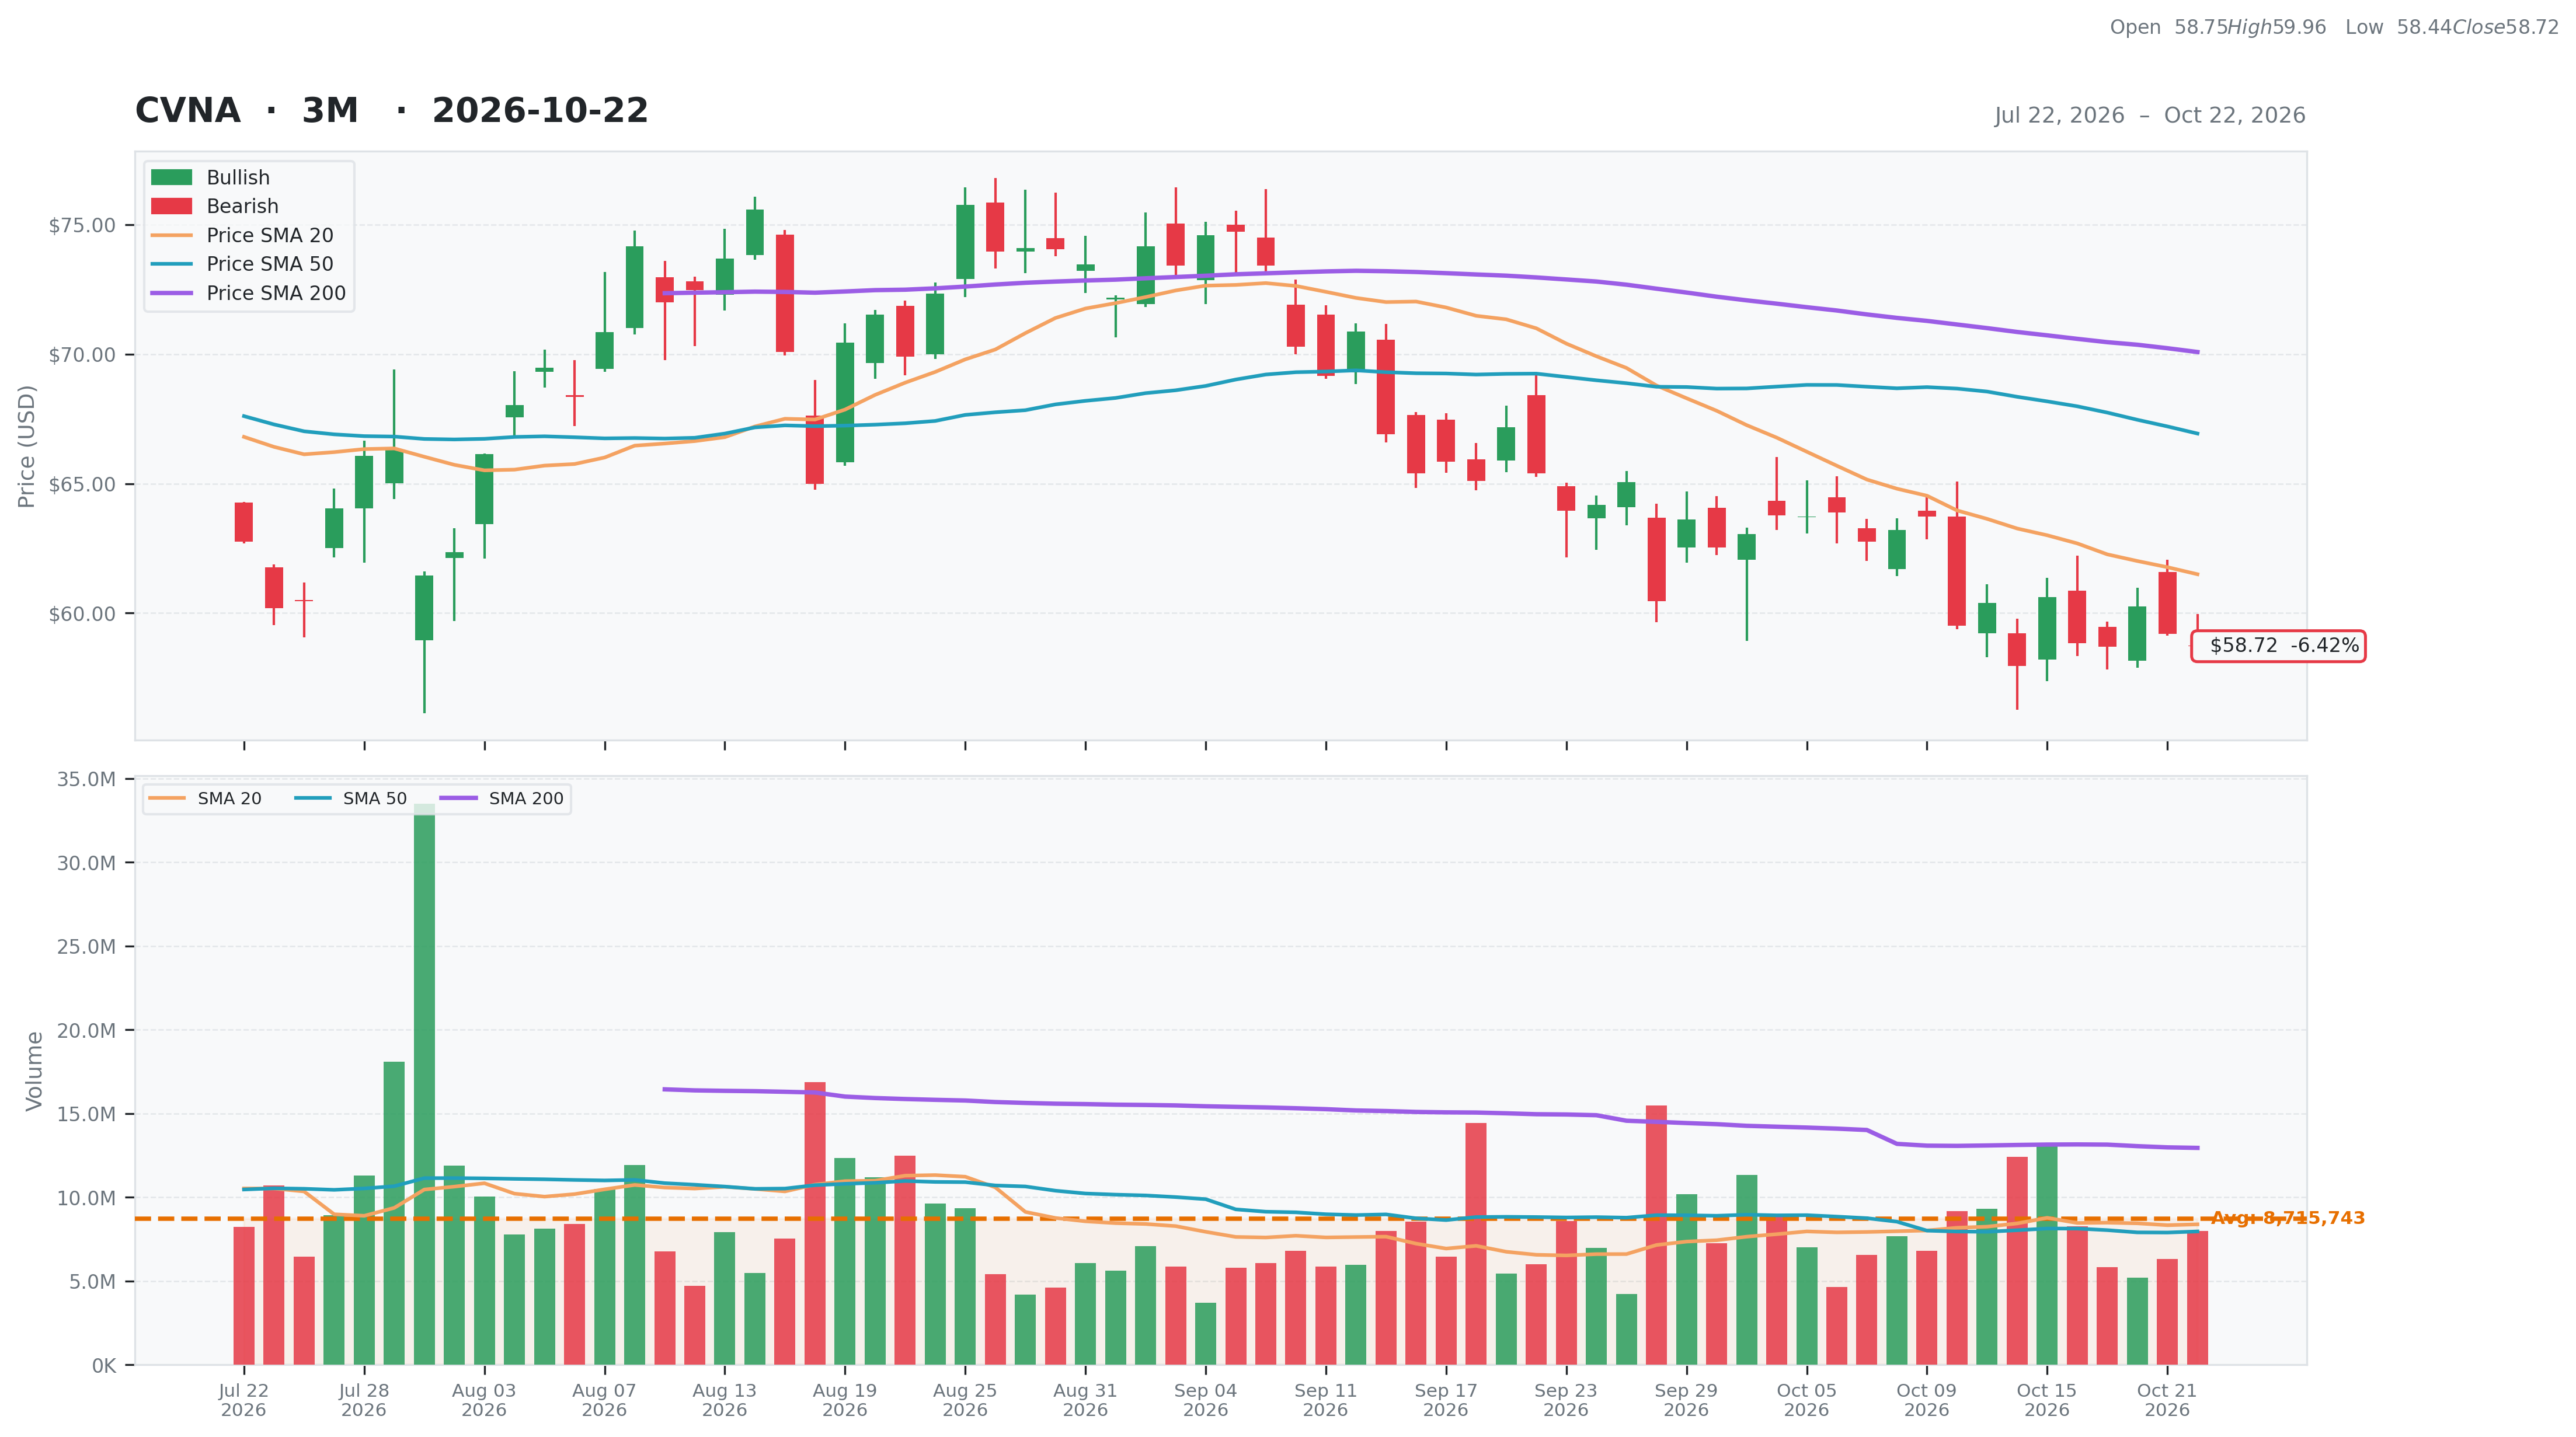
Consumer Cyclical • Auto & Truck Dealerships • $58.72 • MCap: 65,210,925,056
https://www.carvana.com • Carvana Co., together with its subsidiaries, operates an e-commerce platform for buying and selling used cars. It provides vehicle acquisition, inspection and reconditioning, online search and shopping experience, financing, complementary products, logistics network and distinctive fulfillment experience, and post-sale customer support services. The company also operates auction sites. Carvana Co. was founded in 2012 and is based in Tempe, Arizona.
Joie
| Score | Price | 52 Week & Averages | Relative Strength | Risk | |||||
|---|---|---|---|---|---|---|---|---|---|
| Total | 54 | Current | $58.72 | 52W High | $95.69 -38.64% | Relative Strength | -0.18 | Beta | 3.55 |
| Business Quality | 5 | Weekly | $60.62 -3.13% | 52W Low | $56.26 4.38% | 3M | -0.03 | Short % | 0.13 |
| Financial Strength | 18 | Monthly | $65.40 -10.21% | Above 50DMA | $66.93 -12.27% | 6M | -0.27 | Risk Score | 10 |
| Growth Outlook | 15 | Quarterly | $60.46 -2.88% | Above 200DMA | $70.08 -16.21% | 9M | -0.39 | ||
| Momentum | 3 | Yearly | $71.03 -17.33% | 12M | -0.16 | ||||
| Valuation | Financial Strength | Growth/Profitability | |||
|---|---|---|---|---|---|
| Trailing P/E | 31.13 | Cash | 3,132M | Revenue Growth | 0.52% |
| Forward P/E | 26.16 | Debt | 5,697M | Earnings Growth | 0.62% |
| PEG Ratio | N/A | Debt/Equity | 110.88 | Qtr Earnings Growth | 0.69% |
| Price/Sales | 2.60 | Current Ratio | 3.93 | Gross Margin | 0.19% |
| Price/Book | 10.50 | Quick Ratio | 1.72 | Operating Margin | 0.09% |
| EV/Revenue | 1.84 | Operating CF | 1,120M | Profit Margin | 0.06% |
| EV/EBITDA | 18.34 | Free CF | 424M | EBITDA Margin | 0.10% |
| Ent Value | 46,028M | Return on Assets | 0.12% | ||
| Return on Equity | 0.59% | ||||
| Technical | Volume & Bollinger Bands | Analyst | |||
|---|---|---|---|---|---|
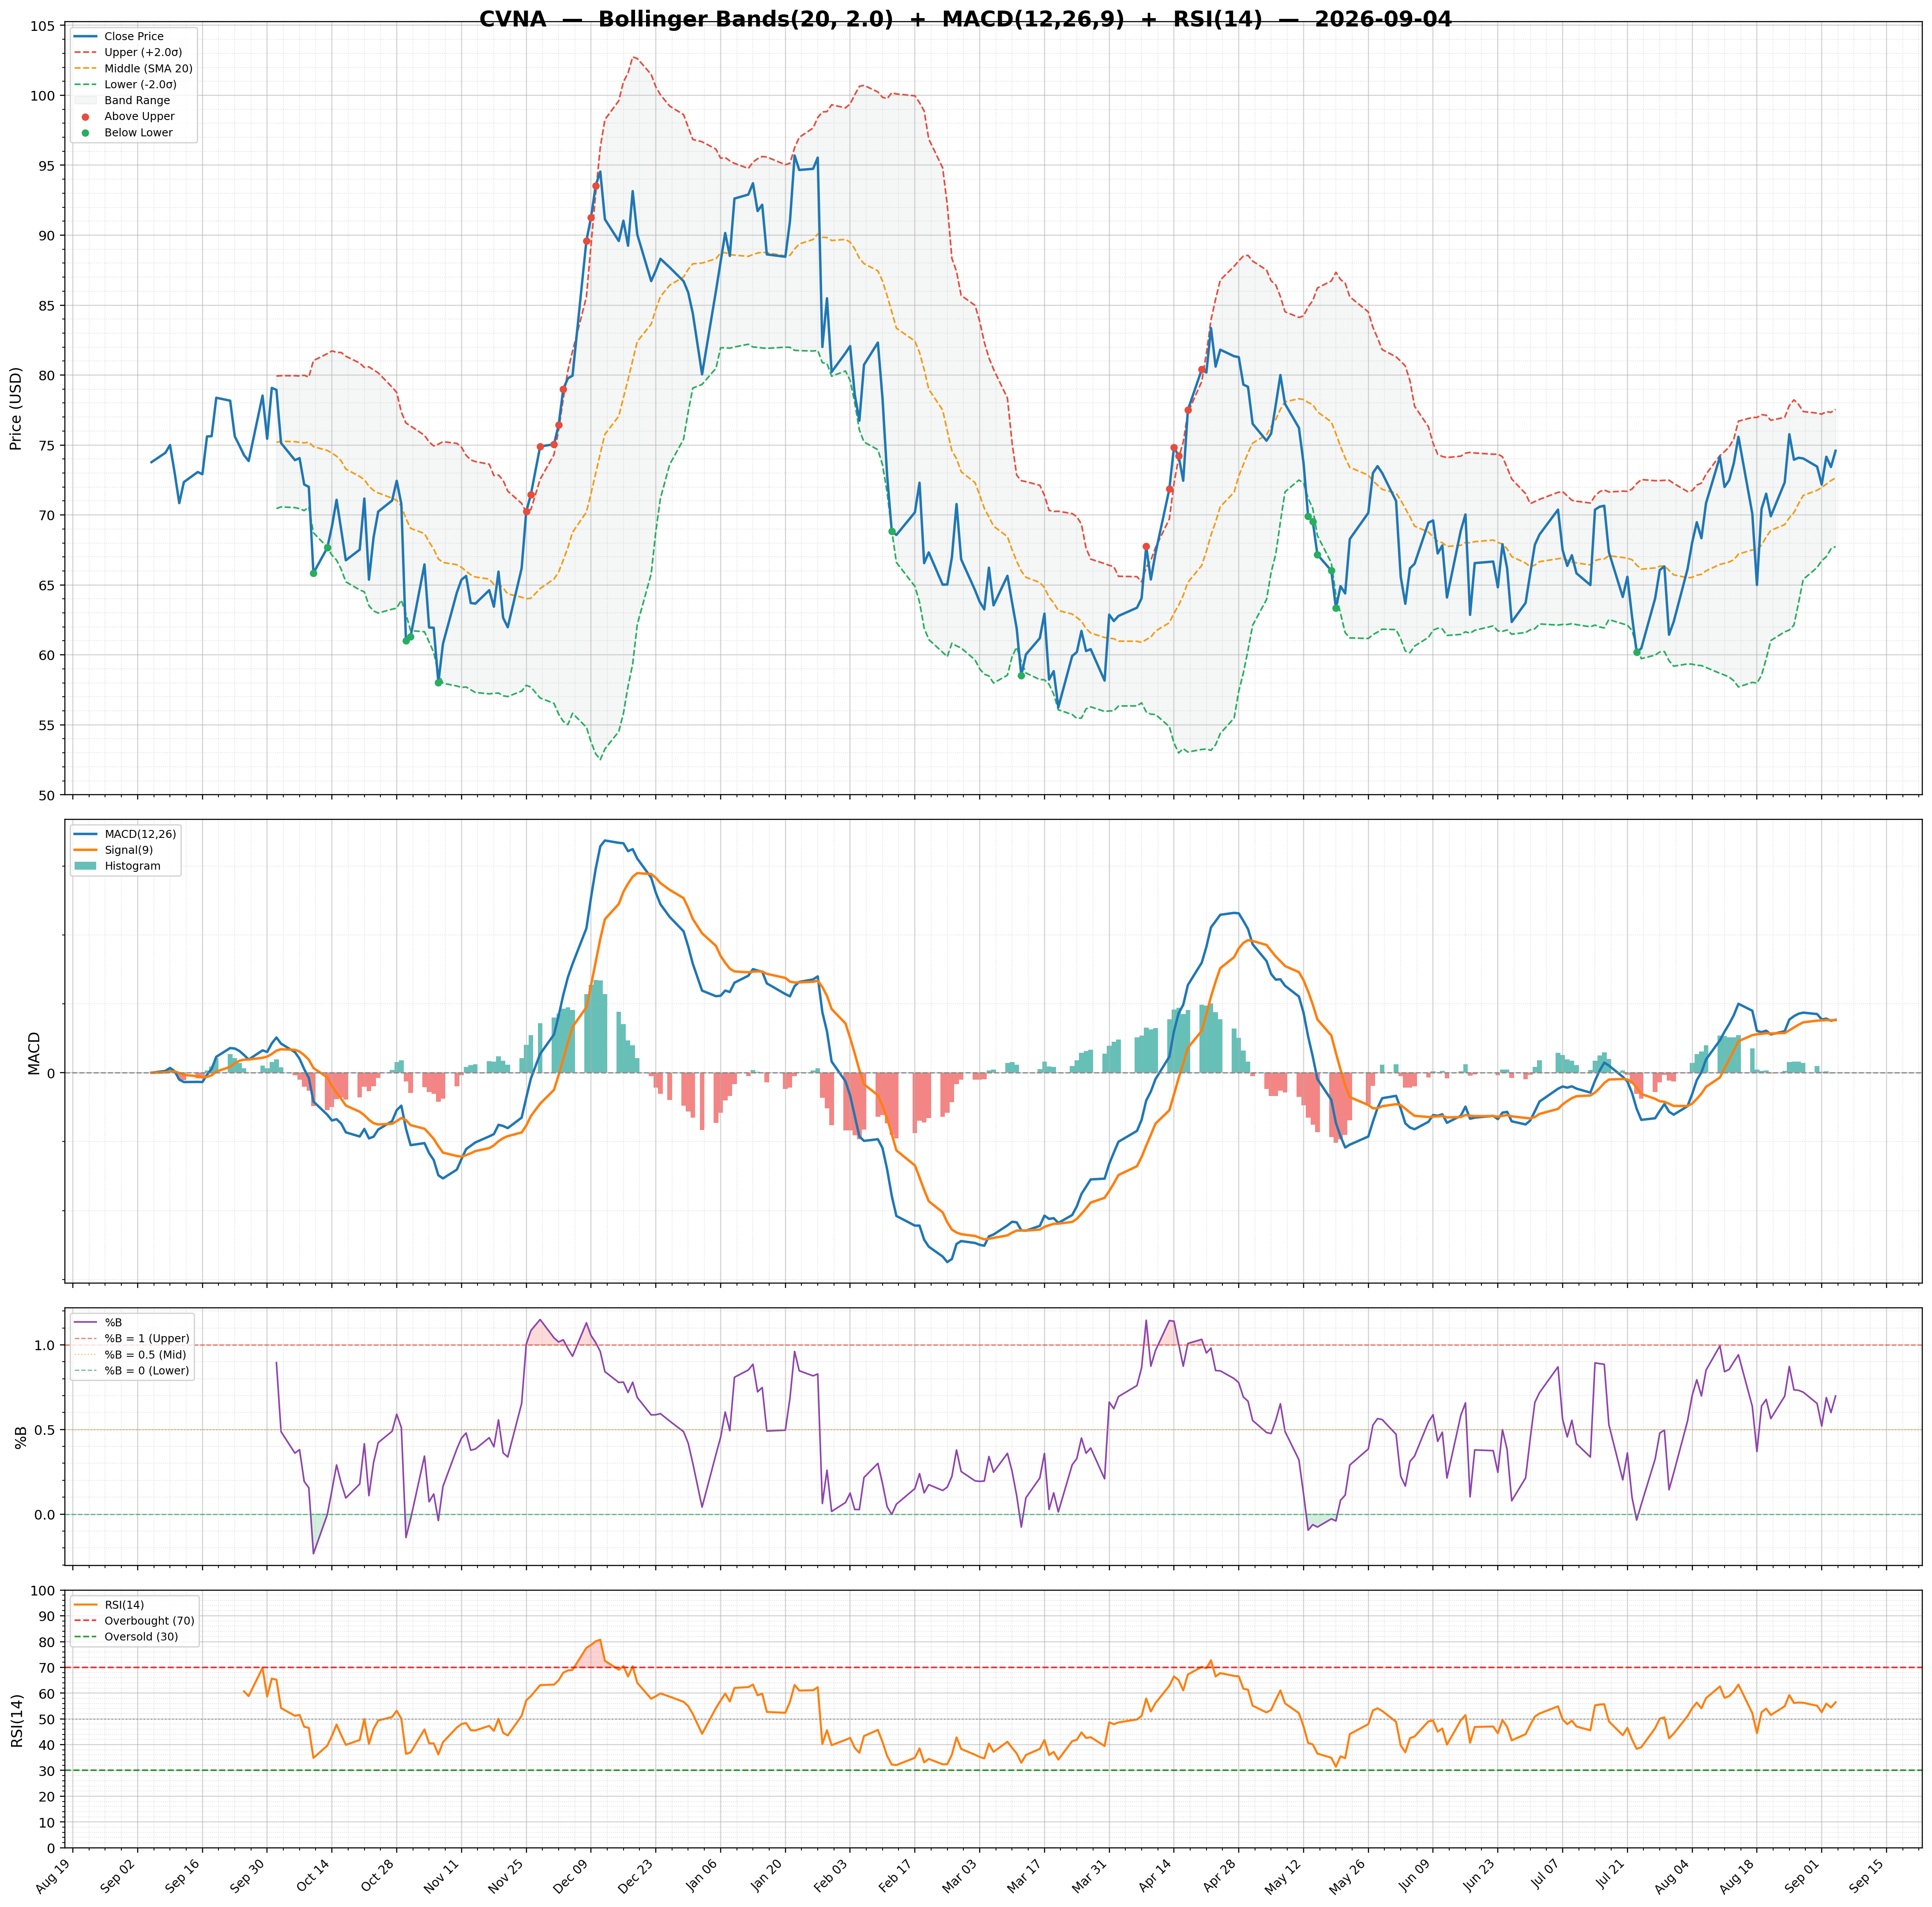
| RSI | 39.40 | Volume | 8.28M | Rating | buy |
| Previous RSI | 40.37 | Avg Volume 20D | 8.38M | Target Mean | $82.19 |
| RSI Trend | Down | Relative Volume | 0.98 | Target High | $120.00 |
| MACD | -2.16 | Lower Band | 57.03 | Target Low | $60.00 |
| MACD Signal | -2.13 | Middle Band | 61.50 | Target Median | $83.00 |
| Histogram | -0.02 | Upper Band | 65.97 | Analysts | 21 |
| Previous Histogram | -0.04 | Bandwidth | 14.540 | Upside | 39.71% |
| Histogram Trend | Increasing | %B | 0.19 | ||