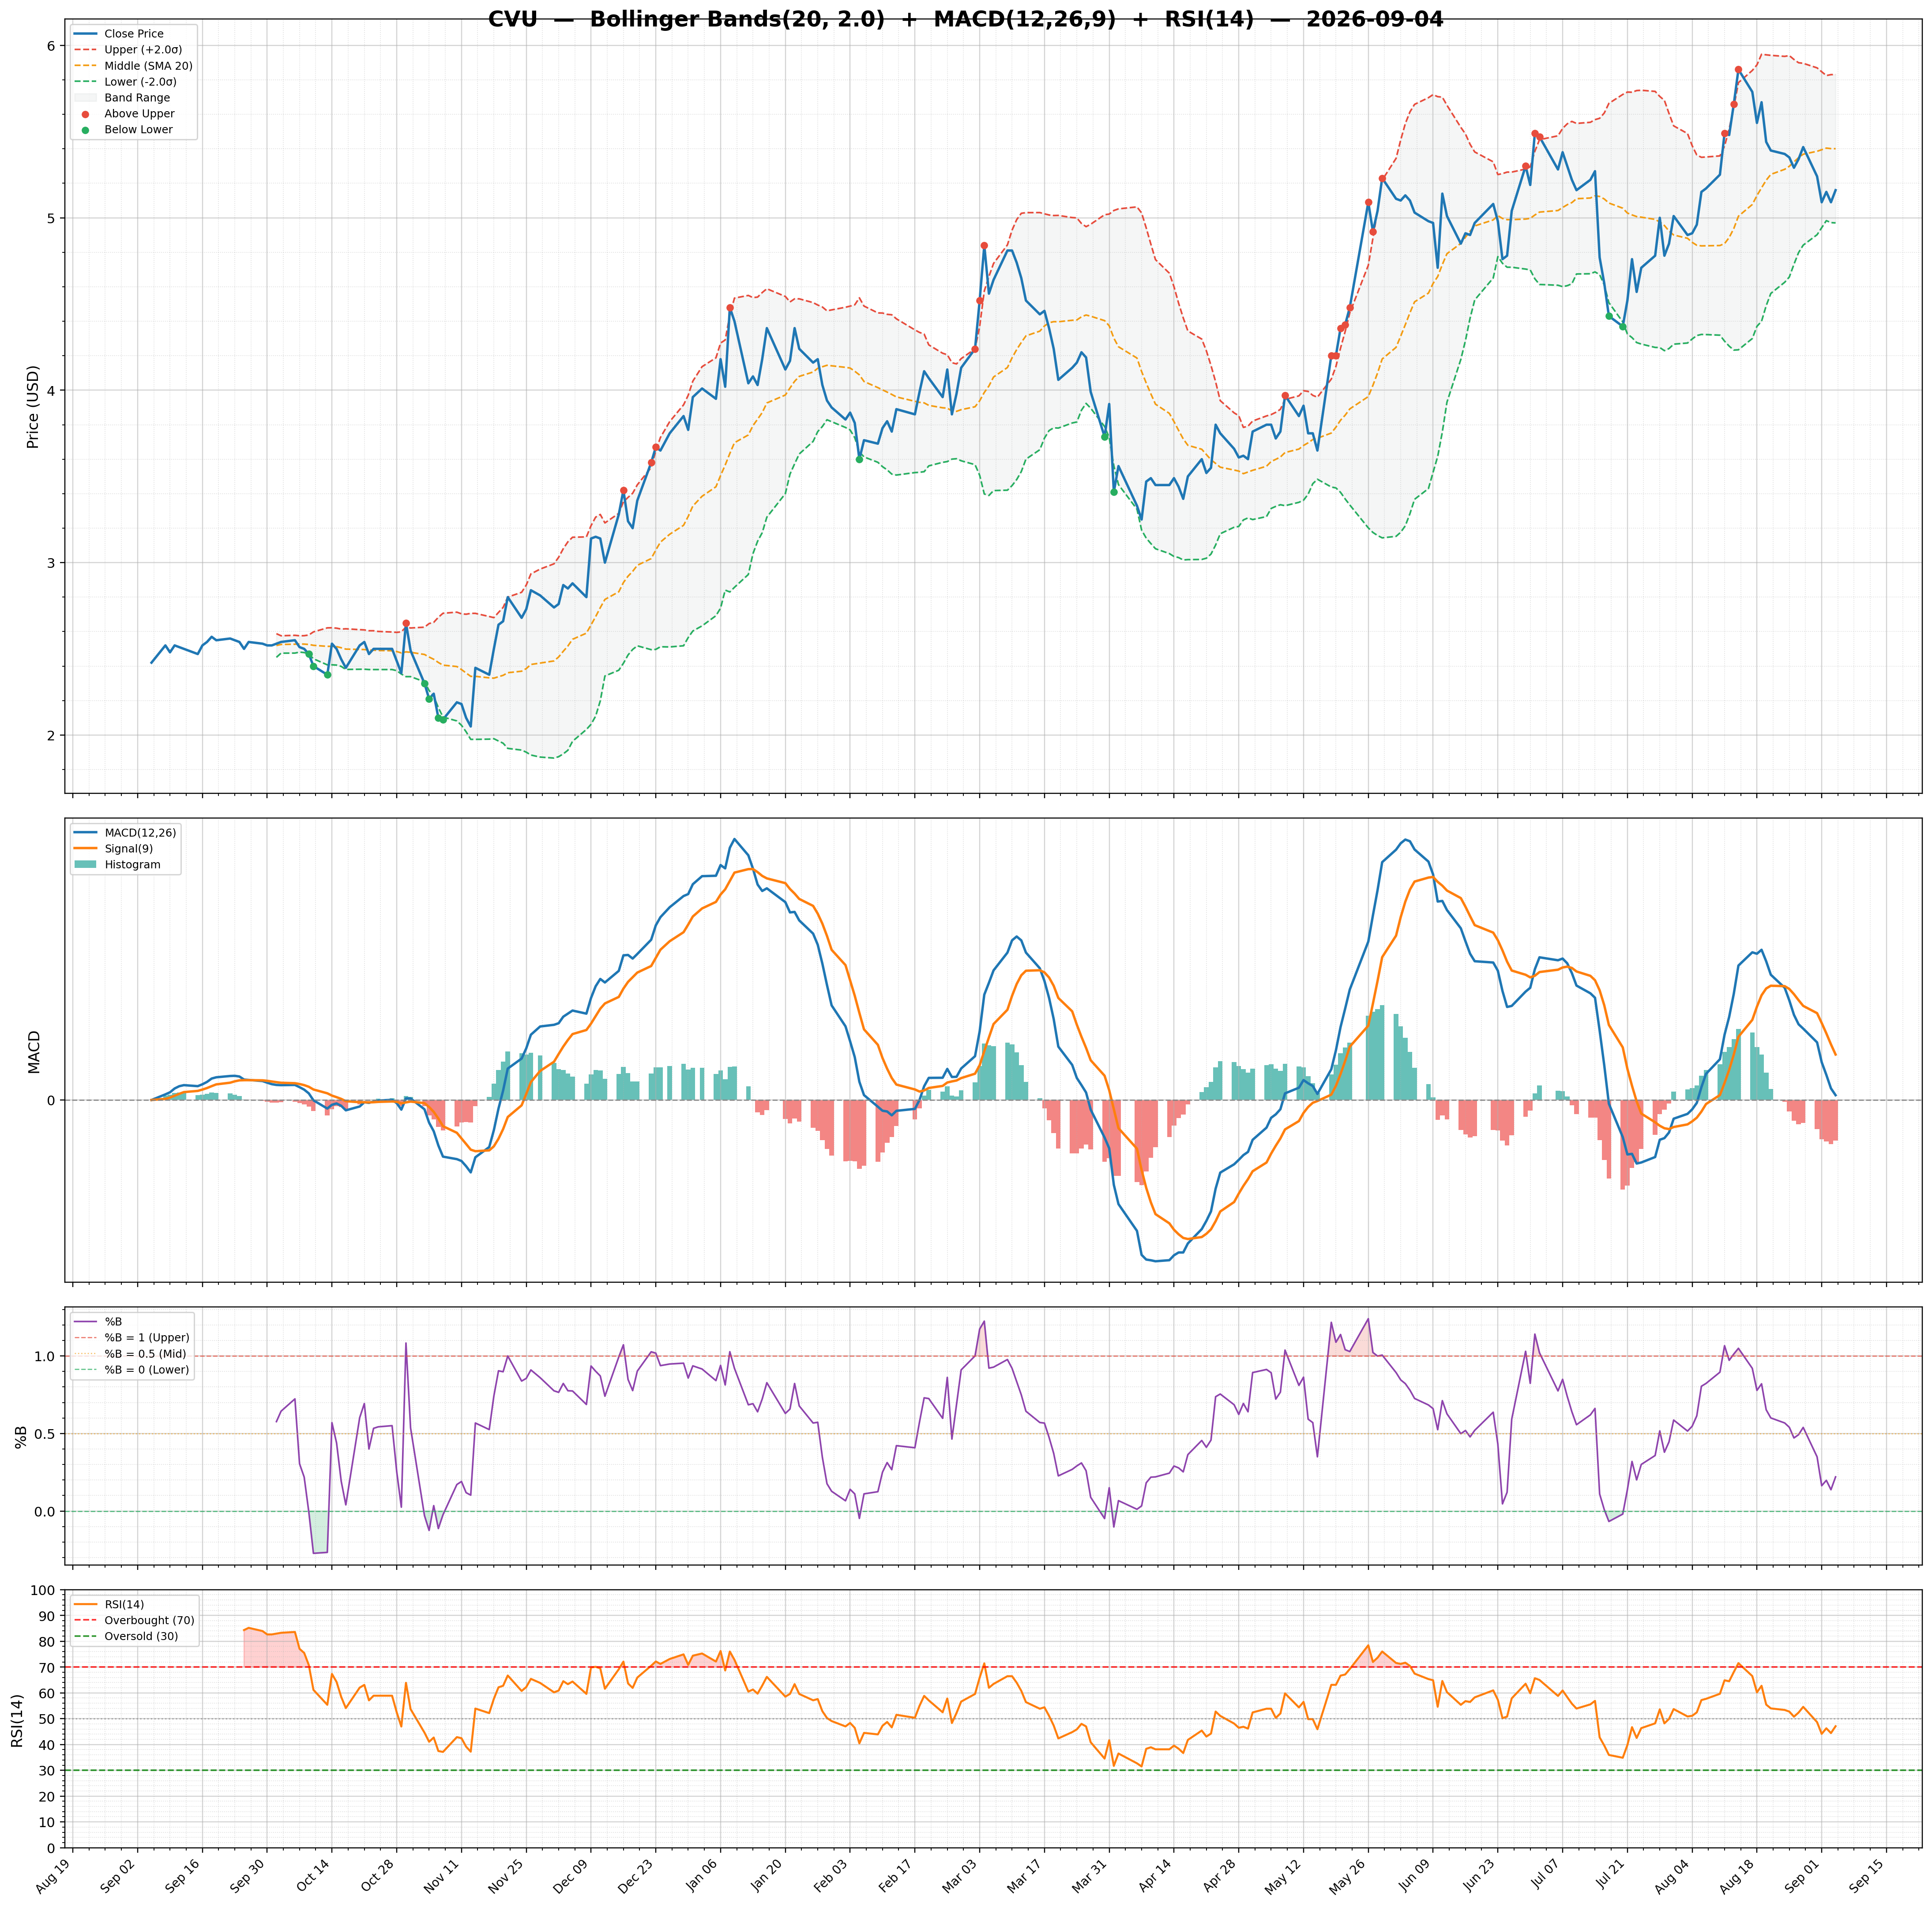
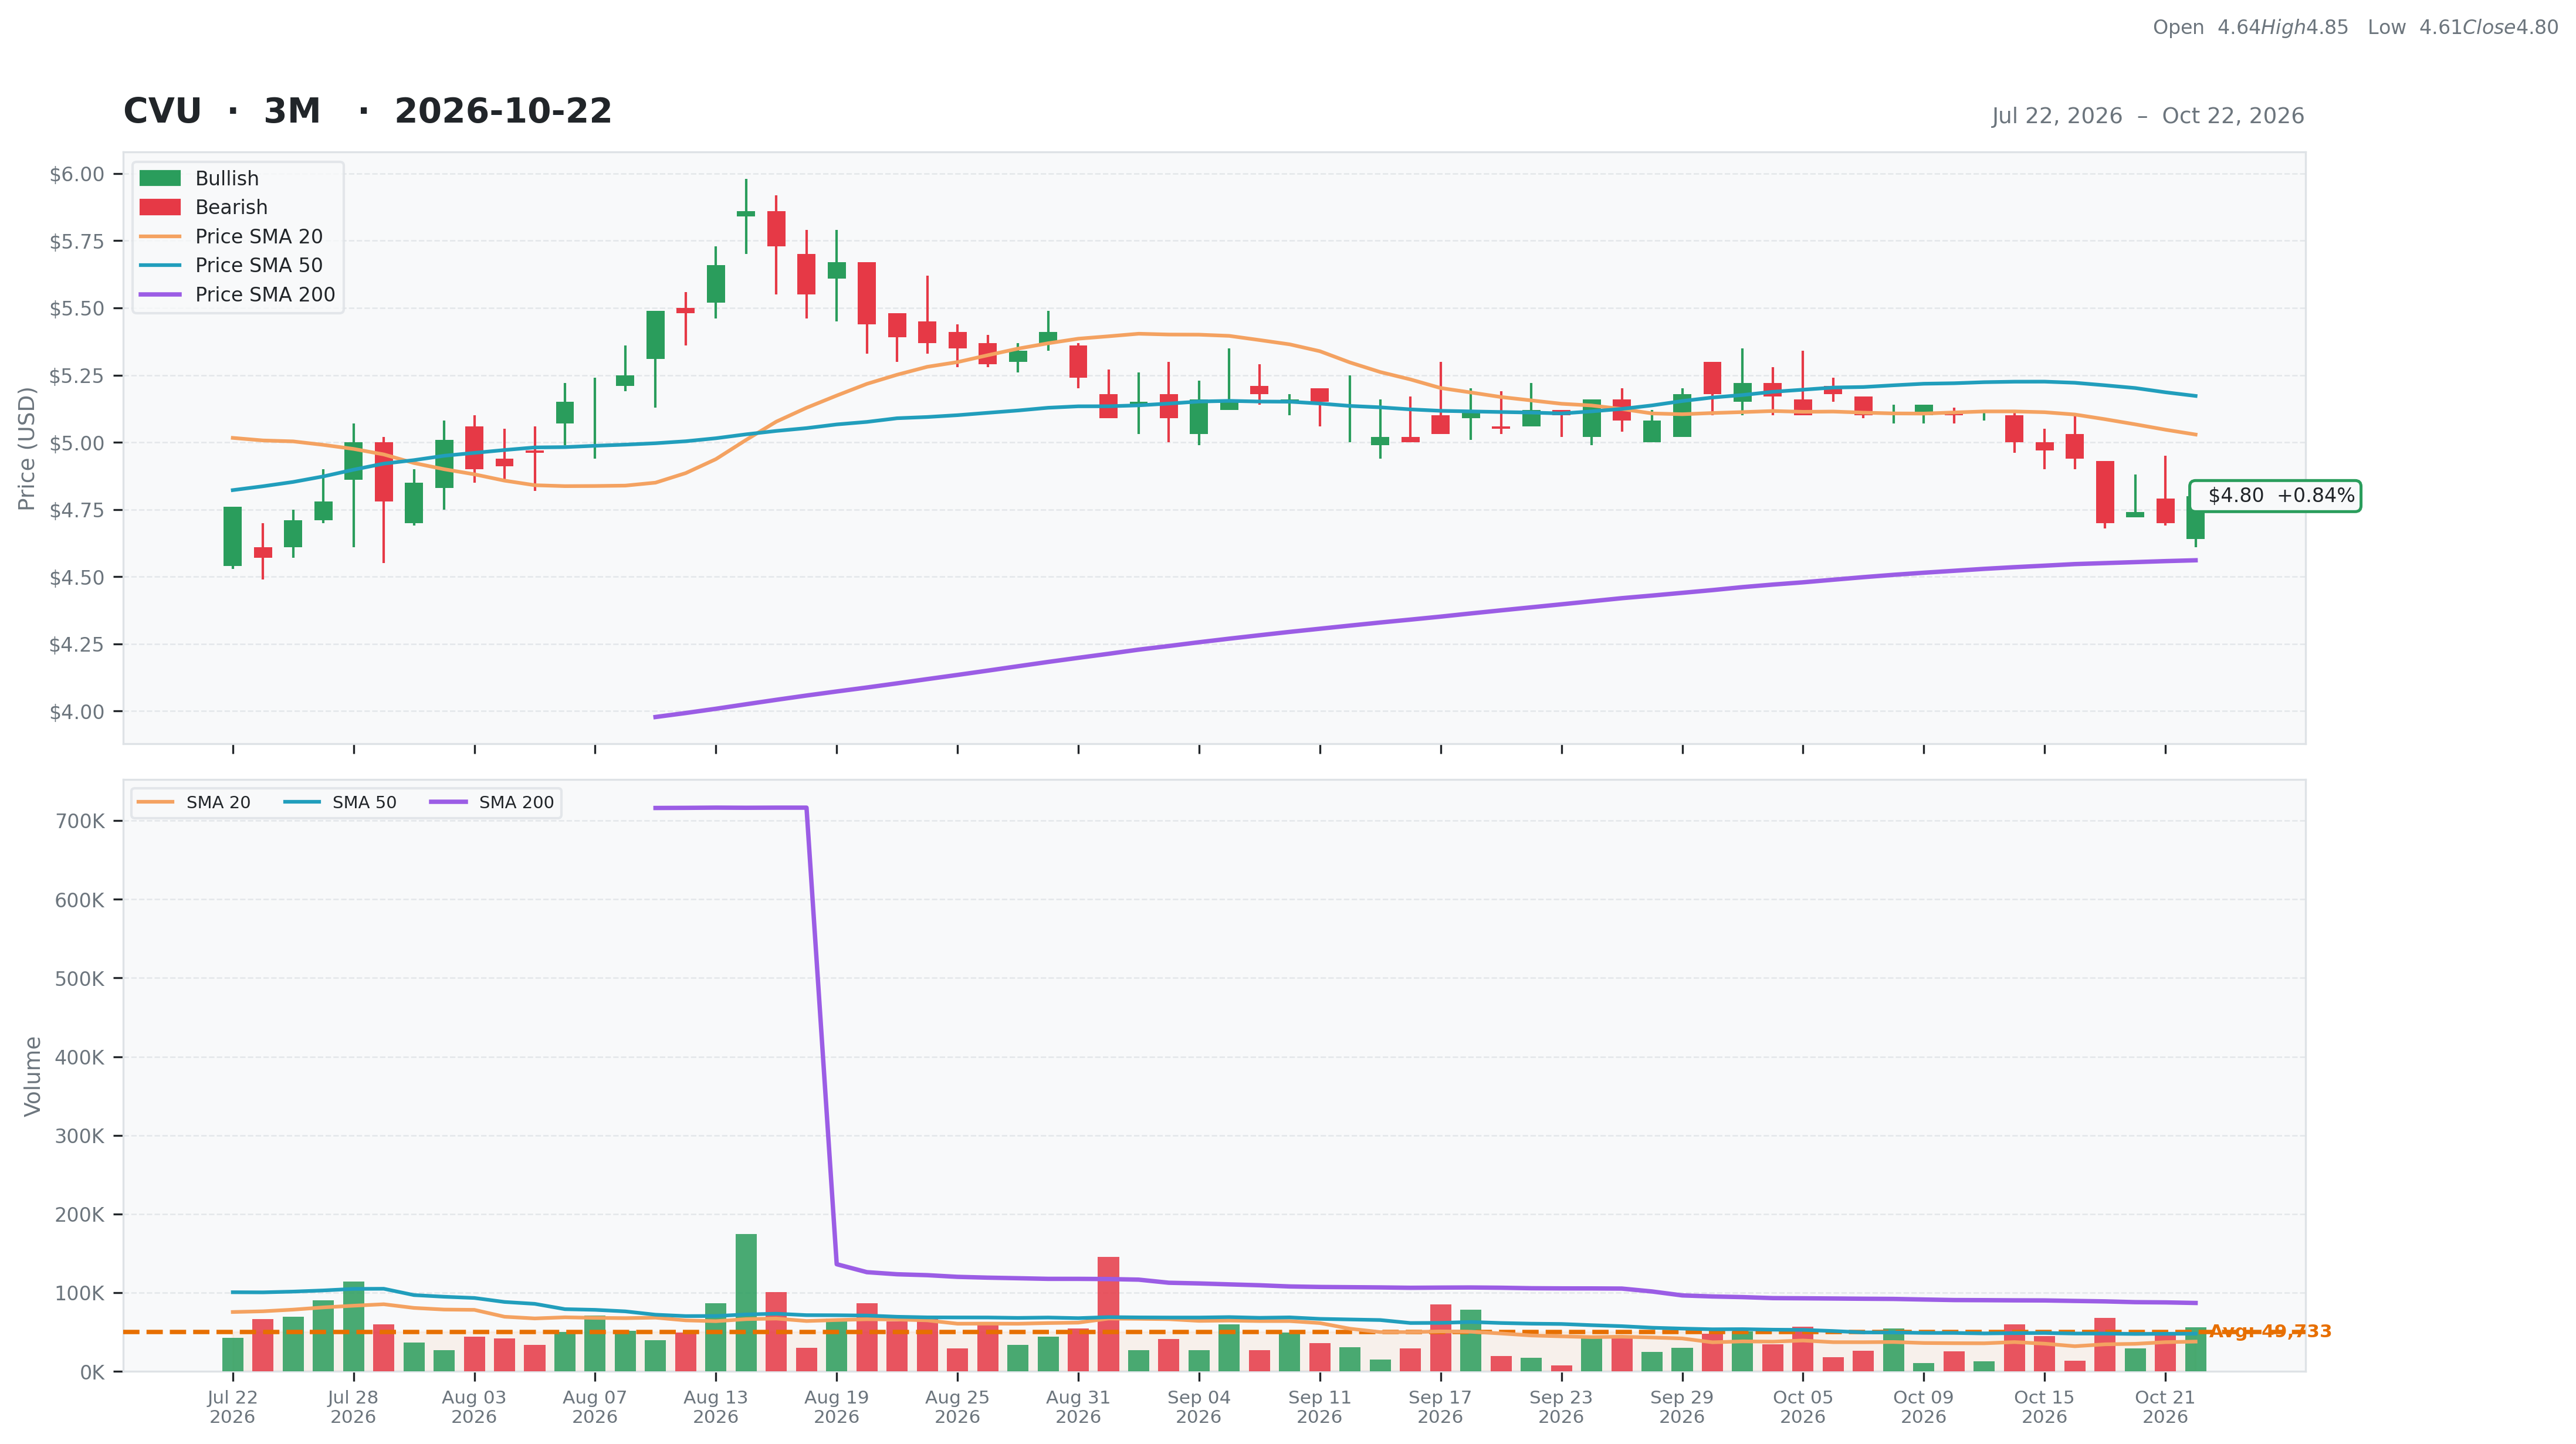
CPI Aerostructures, Inc. (CVU)
Industrials • Aerospace & Defense • $4.8 • MCap: 65,453,688
https://www.cpiaero.com • CPI Aerostructures, Inc. engages in the contract production of structural aircraft assemblies for fixed wing aircraft and helicopters in the commercial and defense markets. The company offers aerostructures products and services, including new production and repair/overhaul of fielded wing structures and other control surfaces, rudder island/drag chute canisters, engine inlets/nacelles, engine exhaust manifolds, aircraft doors and windows, aircraft steps and racks, and other aircraft secondary structures; aero system products and services, such as airborne pod structures and integration of internal systems, radar housing structures, and integrated radar housing rack systems. It also provides diameter tube bending products and services comprising complex ducts and tubes in steel, aluminum, titanium, and nickel alloys; fusion welded fluid tanks, aerial refueling probes, plenums, tubes and ducts, and resistance welding; and wire harnesses, power control systems, fuel management systems, power distribution systems, fully integrated electrical control systems, and RF enclosures. In addition, the company offers engineering, program management, supply chain management, and kitting, as well as maintenance, repair, and overhaul services. Its products are used in the production and refurbishment of fixed wing aircraft, helicopters, and electronic warfare systems; intelligence, surveillance, and reconnaissance systems; missiles; autonomous systems; and other sophisticated aerospace and defense products. The company was formerly known as Consortium of Precision Industries, Inc. and changed its name to CPI Aerostructures, Inc. in July 1992. CPI Aerostructures, Inc. was incorporated in 1980 and is headquartered in Edgewood, New York.
Ex-AAII
Test1
| Score | Price | 52 Week & Averages | Relative Strength | Risk | |||||
|---|---|---|---|---|---|---|---|---|---|
| Total | 44 | Current | $4.80 | 52W High | $5.86 -18.09% | Relative Strength | 0.26 | Beta | 1.00 |
| Business Quality | 8 | Weekly | $4.97 -3.42% | 52W Low | $2.05 134.15% | 3M | 0.02 | Short % | 0 |
| Financial Strength | 10 | Monthly | $5.12 -6.25% | Above 50DMA | $5.17 -7.20% | 6M | 0.26 | Risk Score | |
| Growth Outlook | 1 | Quarterly | $4.71 1.91% | Above 200DMA | $4.56 5.24% | 9M | 0.10 | ||
| Momentum | 2 | Yearly | $2.50 92.00% | 12M | 0.92 | ||||
| Valuation | Financial Strength | Growth/Profitability | |||
|---|---|---|---|---|---|
| Trailing P/E | 17.03 | Cash | 1M | Revenue Growth | 0.16% |
| Forward P/E | N/A | Debt | 28M | Earnings Growth | N/A |
| PEG Ratio | N/A | Debt/Equity | 100.30 | Qtr Earnings Growth | N/A |
| Price/Sales | 0.89 | Current Ratio | 1.97 | Gross Margin | 0.23% |
| Price/Book | 2.32 | Quick Ratio | 1.86 | Operating Margin | 0.07% |
| EV/Revenue | 1.26 | Operating CF | -2M | Profit Margin | 0.05% |
| EV/EBITDA | 14.67 | Free CF | -4M | EBITDA Margin | 0.09% |
| Ent Value | 93M | Return on Assets | 0.05% | ||
| Return on Equity | 0.14% | ||||
| Technical | Volume & Bollinger Bands | Analyst | |||
|---|---|---|---|---|---|
| RSI | 37.43 | Volume | 0.01M | Rating | none |
| Previous RSI | 29.61 | Avg Volume 20D | 0.04M | Target Mean | N/A |
| RSI Trend | Up | Relative Volume | 1.50 | Target High | N/A |
| MACD | -0.10 | Lower Band | 4.69 | Target Low | N/A |
| MACD Signal | -0.06 | Middle Band | 5.03 | Target Median | N/A |
| Histogram | -0.04 | Upper Band | 5.36 | Analysts | N/A |
| Previous Histogram | -0.04 | Bandwidth | 13.310 | Upside | N/A |
| Histogram Trend | Increasing | %B | 0.16 | ||