Camping World Holdings, Inc. (CWH)
Consumer Cyclical • Auto & Truck Dealerships • $4.53 • MCap: 287,864,064
https://www.campingworld.com • Camping World Holdings, Inc., together its subsidiaries, retails recreational vehicles (RVs), and related products and services in the United States. It operates through two segments, Good Sam Services and Plans; and RV and Outdoor Retail. The company provides a portfolio of services, protection plans, products, and resources in the RV industry. It also offers extended vehicle service contracts; vehicle roadside assistance plans; property and casualty insurance; travel protection, travel planning, and directories; and publications, as well as operates the Coast to Coast Resorts and Good Sam Campgrounds. In addition, the company provides new and used RVs; vehicle financing; RV repair and maintenance services; protection plans and services; various RV parts, equipment, supplies, and accessories, which include towing and hitching products, satellite and GPS systems, electrical and lighting products, appliances and furniture, and other products, as well as installation services; and collision repair services comprising fiberglass front and rear cap replacement, windshield replacement, interior remodel solutions, and paint and body work. Further, it offers co-branded credit cards; operates Good Sam Club, a membership organization that offers savings on a range of products and services; and facilitates an RV rental platform that connects travelers with RV owners. The company serves customers through dealerships and service centers, and online and e-commerce platforms. Camping World Holdings, Inc. was founded in 1966 and is headquartered in Lincolnshire, Illinois.
Watch List
Notes
10/05/2026
Sold on 10/5/2026
09/24/2026
Camping is a cyclking business.. Keep an eye on this
| Score | Price | 52 Week & Averages | Relative Strength | Risk | |||||
|---|---|---|---|---|---|---|---|---|---|
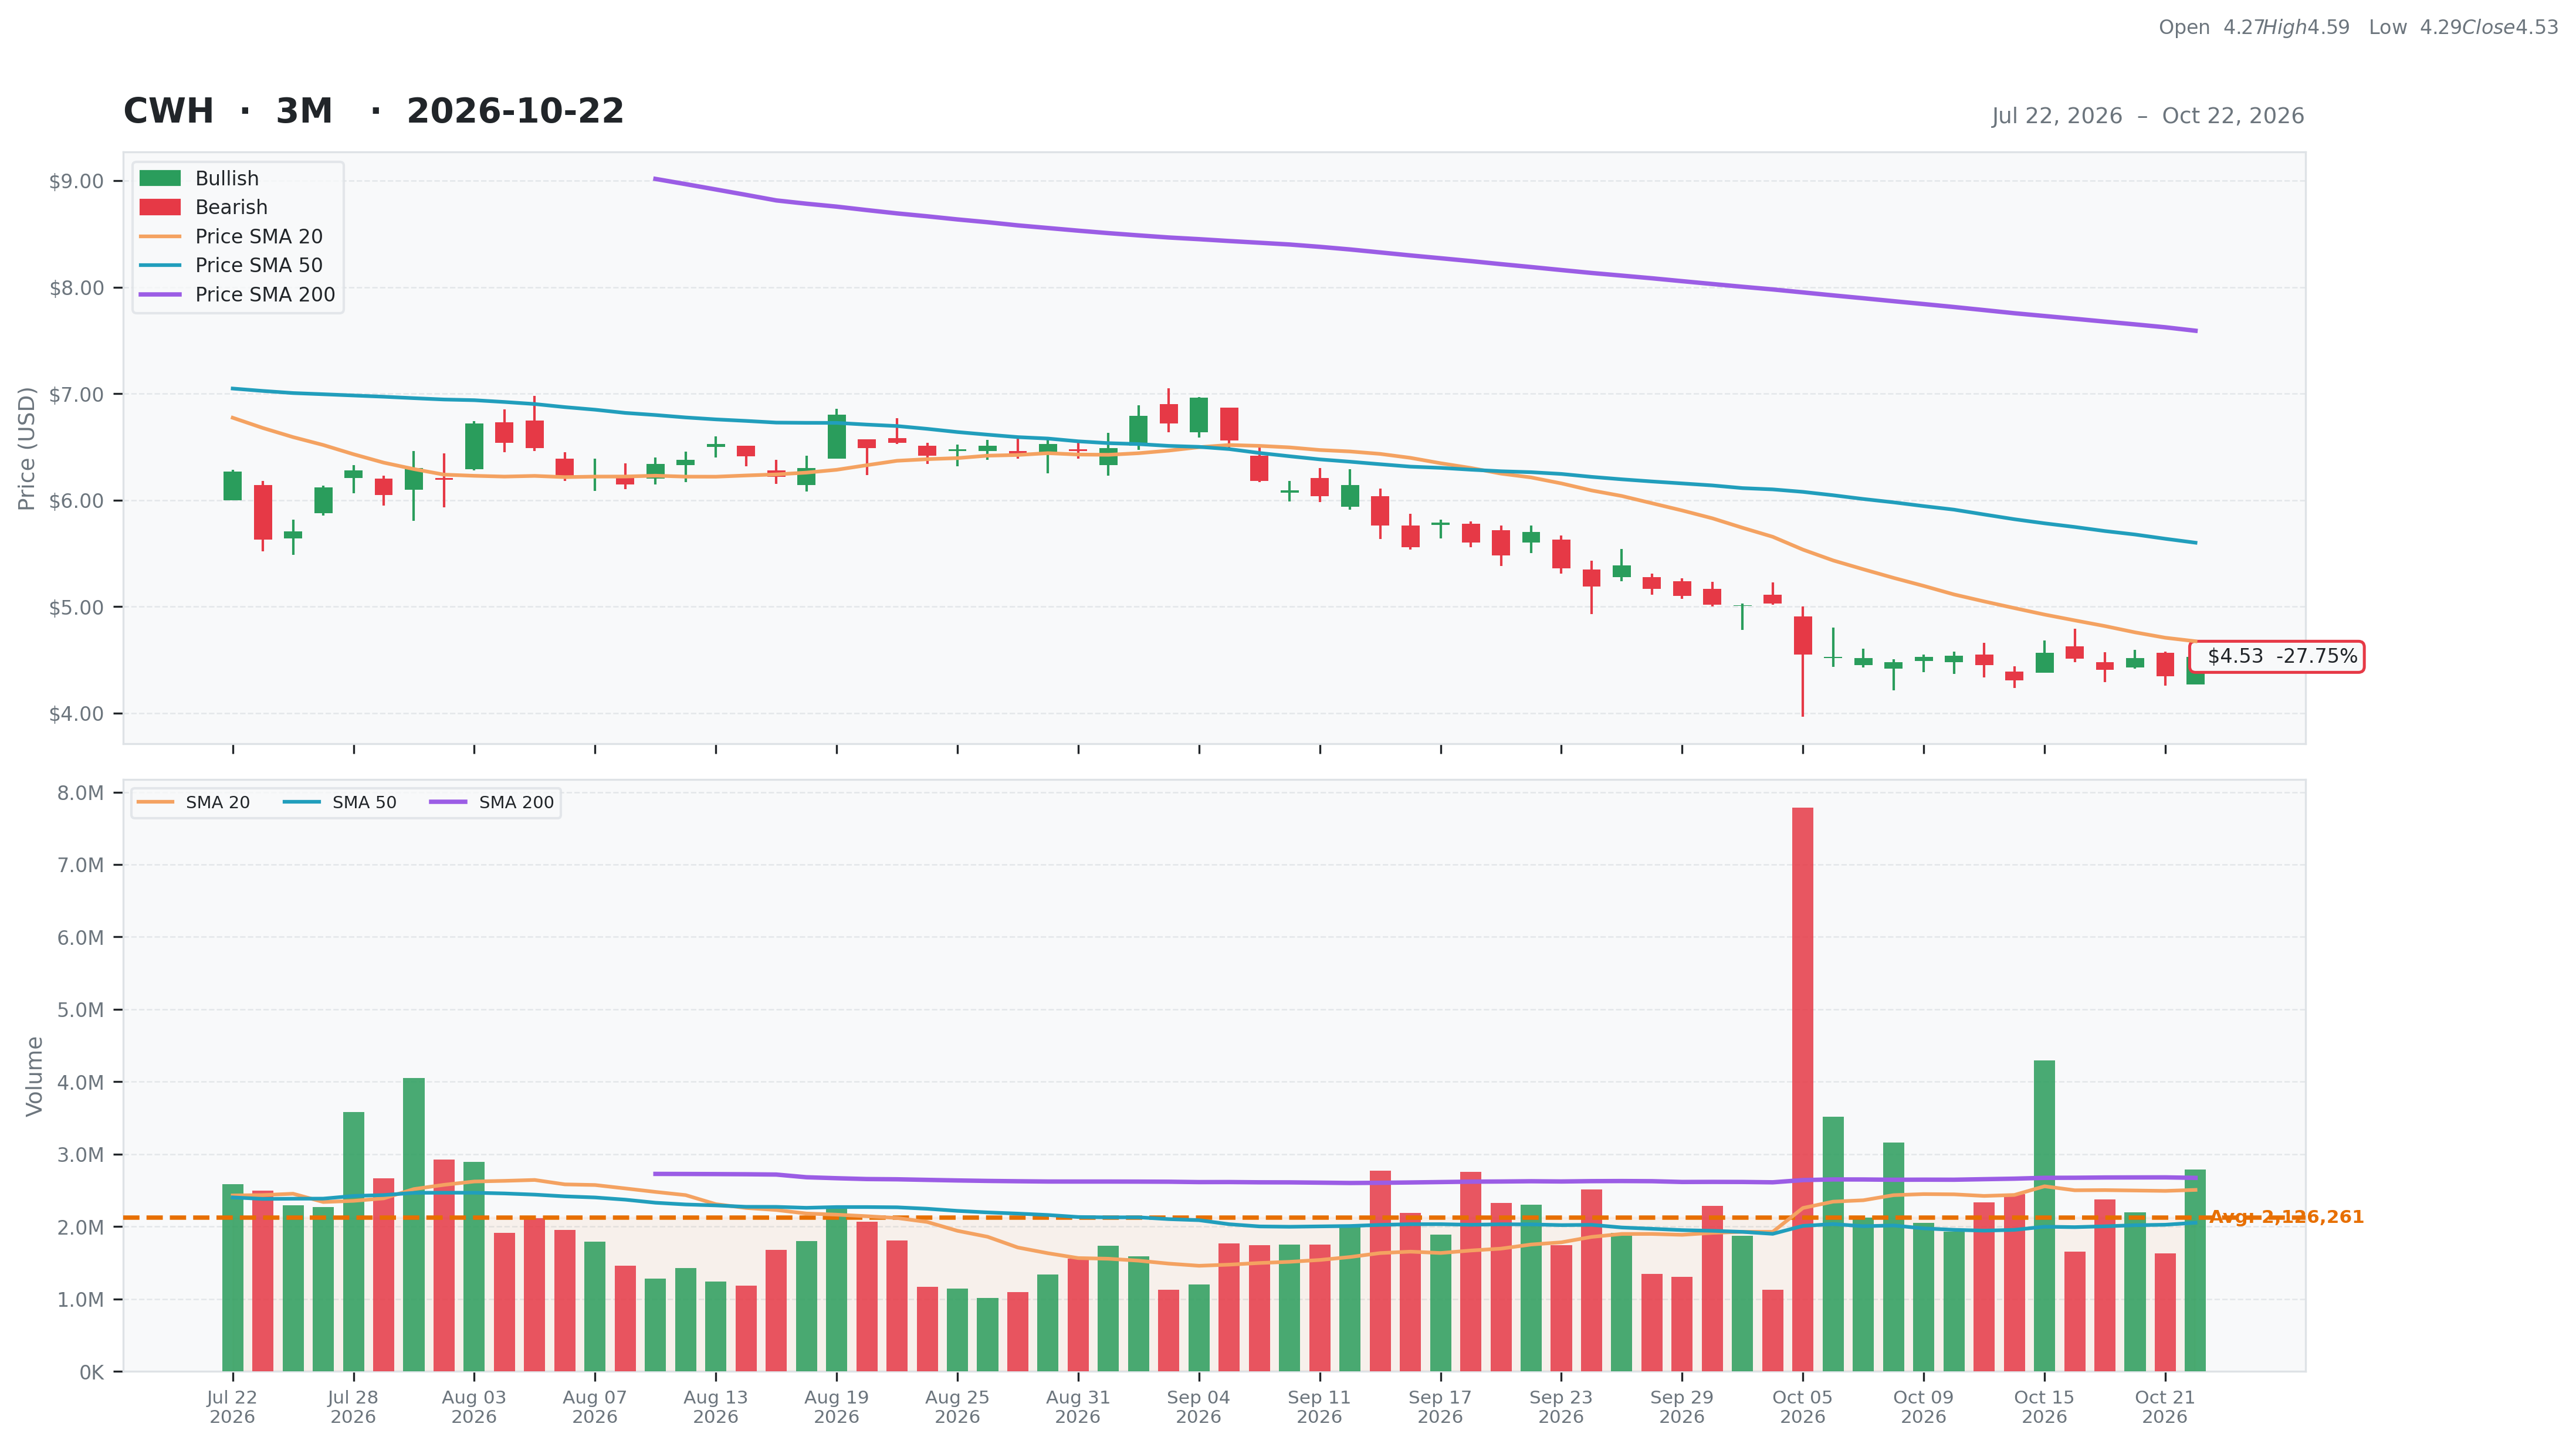
| Total | 29 | Current | $4.53 | 52W High | $16.62 -72.74% | Relative Strength | -0.44 | Beta | 2.17 |
| Business Quality | 6 | Weekly | $4.57 -0.88% | 52W Low | $4.31 5.10% | 3M | -0.21 | Short % | 0.19 |
| Financial Strength | 4 | Monthly | $5.70 -20.53% | Above 50DMA | $5.60 -19.12% | 6M | -0.34 | Risk Score | 10 |
| Growth Outlook | 0 | Quarterly | $5.71 -20.67% | Above 200DMA | $7.59 -40.32% | 9M | -0.69 | ||
| Momentum | 3 | Yearly | $16.54 -72.61% | 12M | -0.73 | ||||
| Valuation | Financial Strength | Growth/Profitability | |||
|---|---|---|---|---|---|
| Trailing P/E | N/A | Cash | 224M | Revenue Growth | -0.02% |
| Forward P/E | 7.04 | Debt | 3,737M | Earnings Growth | -0.13% |
| PEG Ratio | N/A | Debt/Equity | 937.10 | Qtr Earnings Growth | -0.11% |
| Price/Sales | 0.05 | Current Ratio | 1.22 | Gross Margin | 0.29% |
| Price/Book | 1.17 | Quick Ratio | 0.26 | Operating Margin | 0.05% |
| EV/Revenue | 0.63 | Operating CF | 246M | Profit Margin | -0.02% |
| EV/EBITDA | 15.72 | Free CF | 118M | EBITDA Margin | 0.04% |
| Ent Value | 3,954M | Return on Assets | 0.02% | ||
| Return on Equity | -0.27% | ||||
| Technical | Volume & Bollinger Bands | Analyst | |||
|---|---|---|---|---|---|
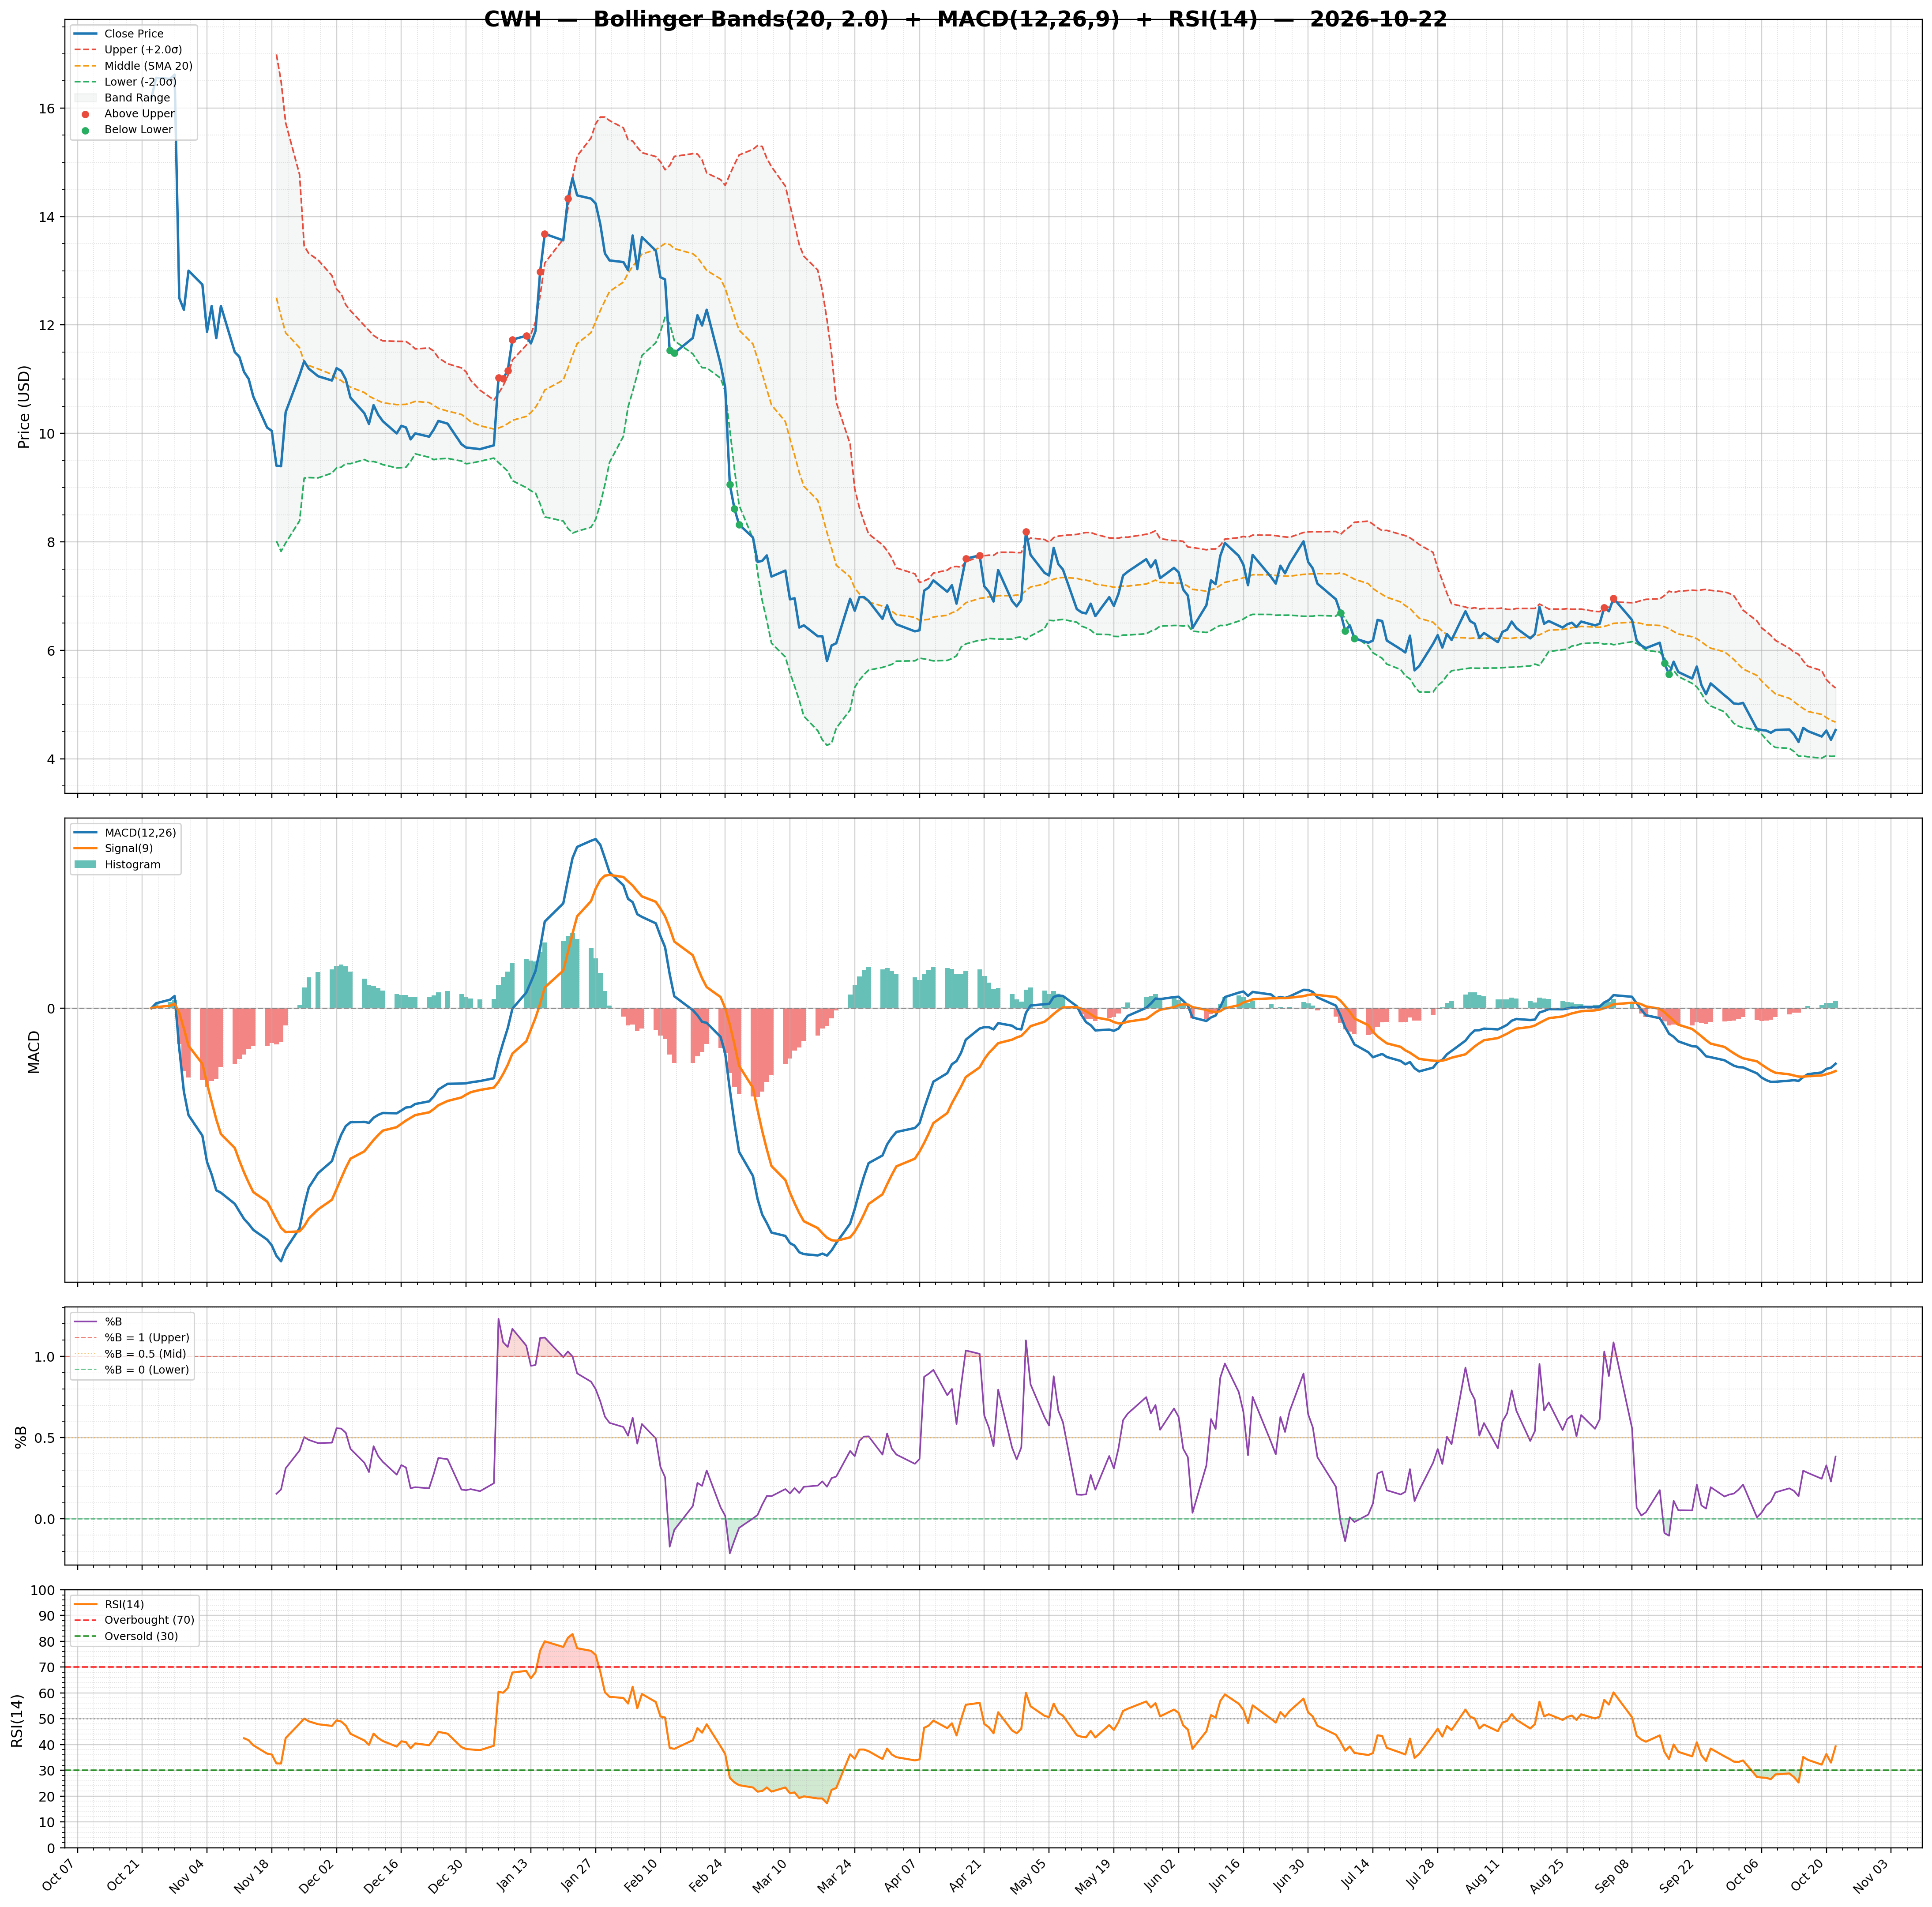
| RSI | 39.30 | Volume | 1.65M | Rating | strong_buy |
| Previous RSI | 32.99 | Avg Volume 20D | 2.51M | Target Mean | $9.62 |
| RSI Trend | Up | Relative Volume | 1.16 | Target High | $15.00 |
| MACD | -0.33 | Lower Band | 4.05 | Target Low | $6.00 |
| MACD Signal | -0.38 | Middle Band | 4.68 | Target Median | $10.00 |
| Histogram | 0.04 | Upper Band | 5.30 | Analysts | 13 |
| Previous Histogram | 0.03 | Bandwidth | 26.870 | Upside | 113.20% |
| Histogram Trend | Increasing | %B | 0.38 | ||