Leonardo DRS, Inc. (DRS)
Industrials • Aerospace & Defense • $34.3 • MCap: 9,453,296,640
https://www.leonardodrs.com • Leonardo DRS, Inc., together with its subsidiaries, provides defense electronic products and systems, and military support services worldwide. It operates through Advanced Sensing and Computing and Integrated Mission Systems segments. The Advanced Sensing and Computing segment designs, develops, and manufacture sensing and network computing technology that enables real-time situational awareness required for enhanced operational decision making and execution; and offers sensing capabilities span applications, such as missions requiring advanced detection, precision targeting and surveillance sensing, long range electro-optic/infrared, signals intelligence, and other intelligence systems including electronic warfare, ground vehicle sensing, active electronically scanned array tactical radars, dismounted soldier, and space sensing. This segment also provides network computing, which are utilized across a range of mission applications, such as platform computing on ground and shipboard for advanced battle management, combat systems, radar, command and control, tactical networks, tactical computing, and communications. The Integrated Mission Systems segment offers electrical propulsion systems, which includes power conversion, control, distribution, and propulsion systems, as well as power dense permanent magnet motors, energy storage systems, associated rugged and compact power conversion, electrical actuation systems, as well as advanced thermal management technologies, motor controllers, and instrumentation and control equipment. Leonardo DRS, Inc. was incorporated in 1968 and is based in Arlington, Virginia. Leonardo DRS, Inc. operates as a subsidiary of Leonardo US Holding, LLC.
Google_BUY_Rating
| Score | Price | 52 Week & Averages | Relative Strength | Risk | |||||
|---|---|---|---|---|---|---|---|---|---|
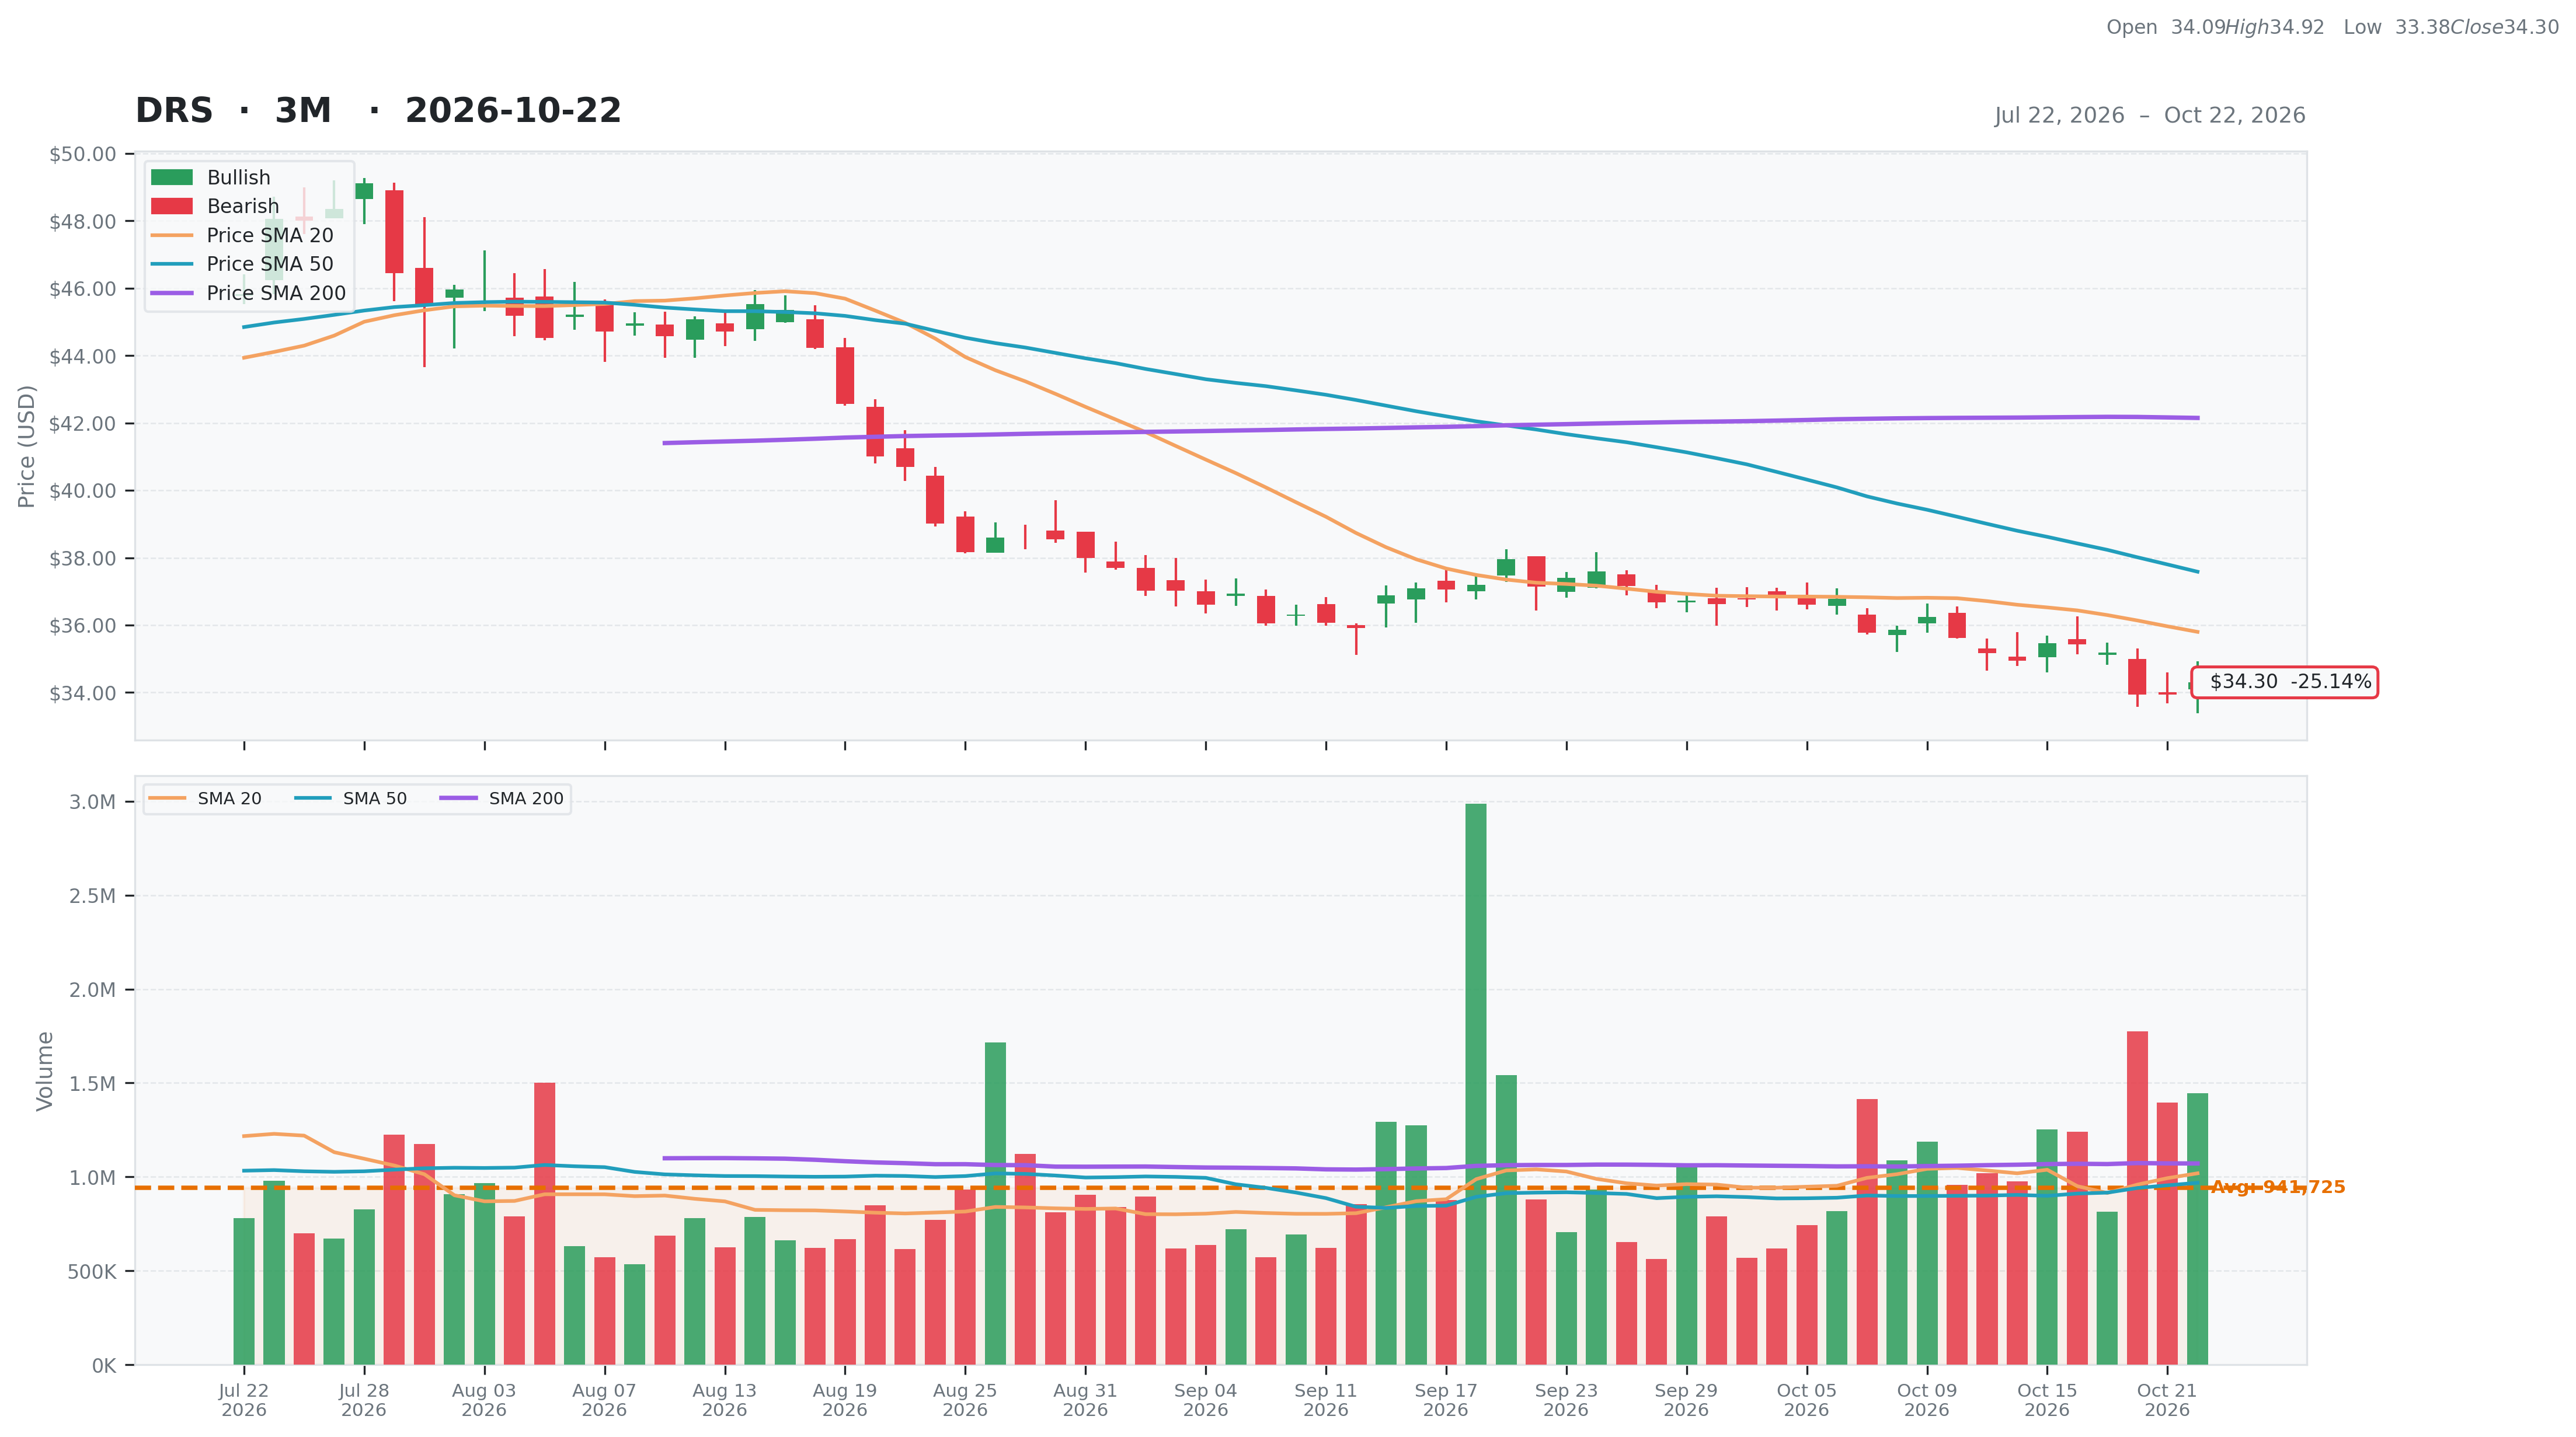
| Total | 67 | Current | $34.30 | 52W High | $49.59 -30.83% | Relative Strength | -0.21 | Beta | 0.16 |
| Business Quality | 11 | Weekly | $35.47 -3.30% | 52W Low | $32.36 6.01% | 3M | -0.29 | Short % | 0.01 |
| Financial Strength | 16 | Monthly | $37.15 -7.67% | Above 50DMA | $37.59 -8.74% | 6M | -0.17 | Risk Score | 2 |
| Growth Outlook | 15 | Quarterly | $48.00 -28.55% | Above 200DMA | $42.15 -18.62% | 9M | -0.16 | ||
| Momentum | 3 | Yearly | $40.96 -16.25% | 12M | -0.15 | ||||
| Valuation | Financial Strength | Growth/Profitability | |||
|---|---|---|---|---|---|
| Trailing P/E | 29.76 | Cash | 270M | Revenue Growth | 0.10% |
| Forward P/E | 24.04 | Debt | 267M | Earnings Growth | 0.60% |
| PEG Ratio | N/A | Debt/Equity | 9.53 | Qtr Earnings Growth | 0.59% |
| Price/Sales | 2.50 | Current Ratio | 1.92 | Gross Margin | 0.25% |
| Price/Book | 3.37 | Quick Ratio | 1.49 | Operating Margin | 0.11% |
| EV/Revenue | 2.50 | Operating CF | 501M | Profit Margin | 0.09% |
| EV/EBITDA | 19.02 | Free CF | 328M | EBITDA Margin | 0.13% |
| Ent Value | 9,450M | Return on Assets | 0.06% | ||
| Return on Equity | 0.12% | ||||
| Technical | Volume & Bollinger Bands | Analyst | |||
|---|---|---|---|---|---|
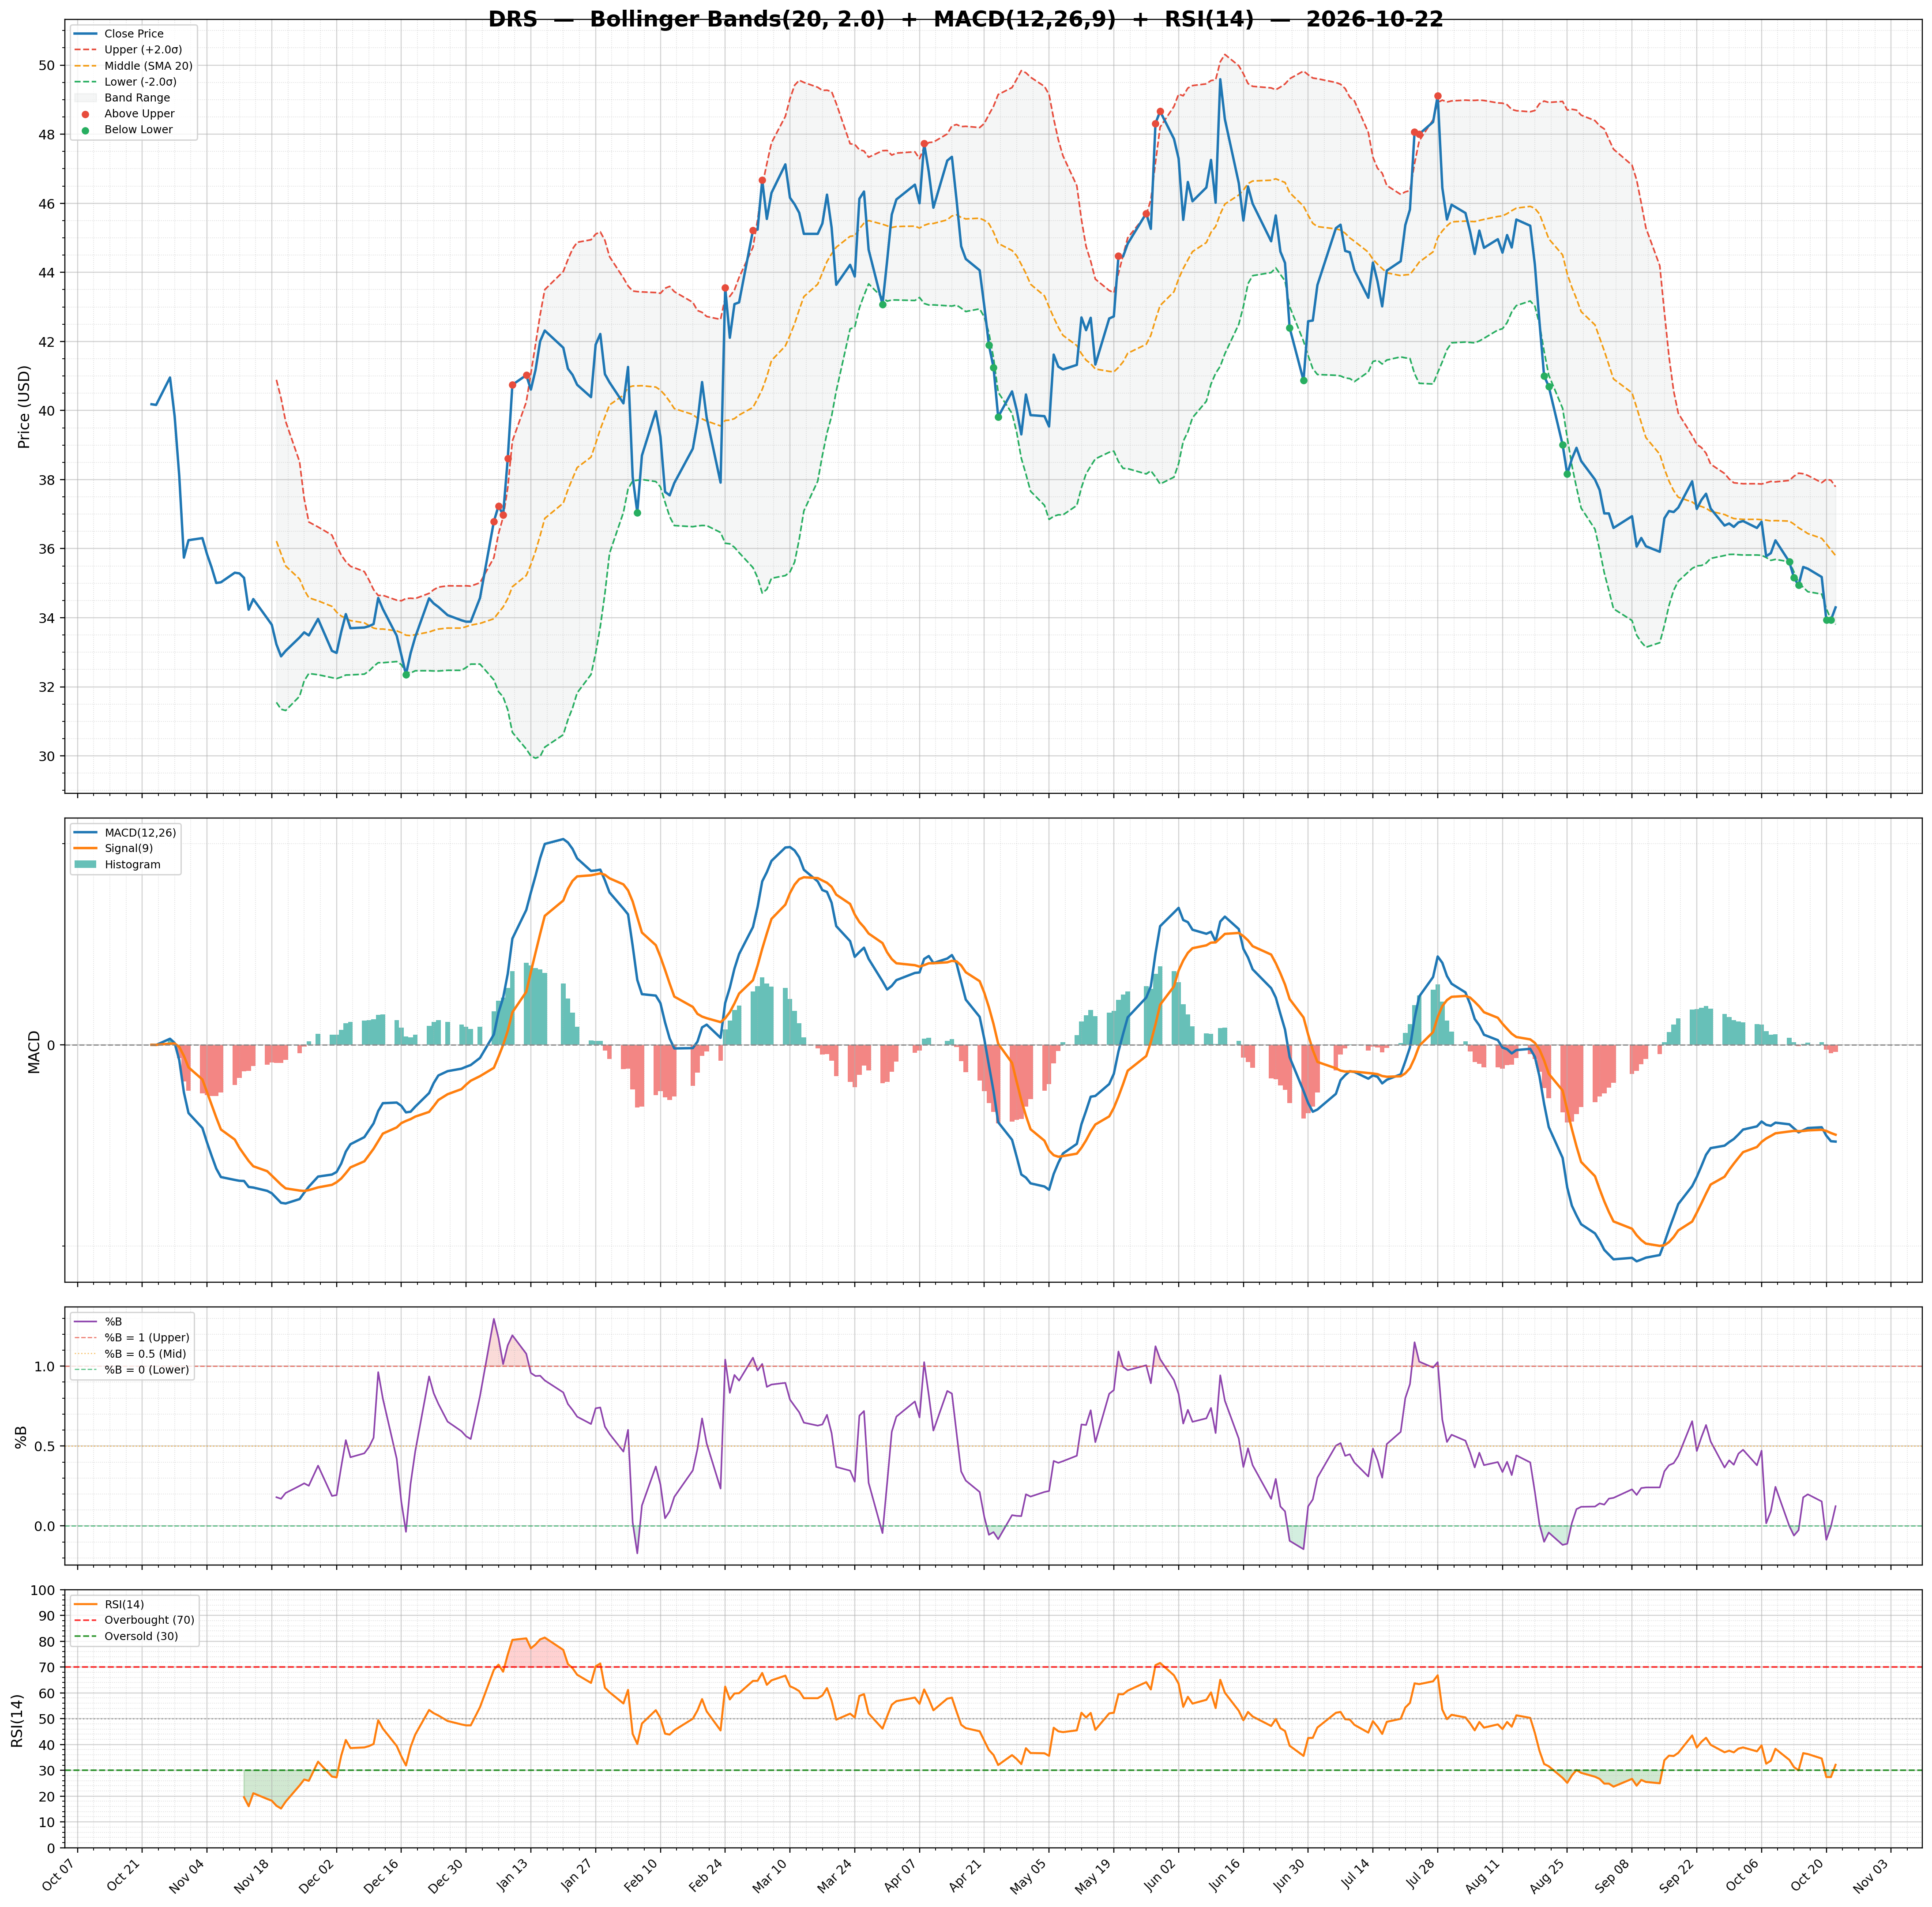
| RSI | 32.14 | Volume | 1.24M | Rating | strong_buy |
| Previous RSI | 27.39 | Avg Volume 20D | 1.02M | Target Mean | $53.18 |
| RSI Trend | Up | Relative Volume | 1.34 | Target High | $59.00 |
| MACD | -0.96 | Lower Band | 33.81 | Target Low | $44.00 |
| MACD Signal | -0.89 | Middle Band | 35.80 | Target Median | $53.00 |
| Histogram | -0.07 | Upper Band | 37.79 | Analysts | 11 |
| Previous Histogram | -0.08 | Bandwidth | 11.140 | Upside | 50.15% |
| Histogram Trend | Increasing | %B | 0.12 | ||