Dixie Group, Inc (THE) (DXYN)
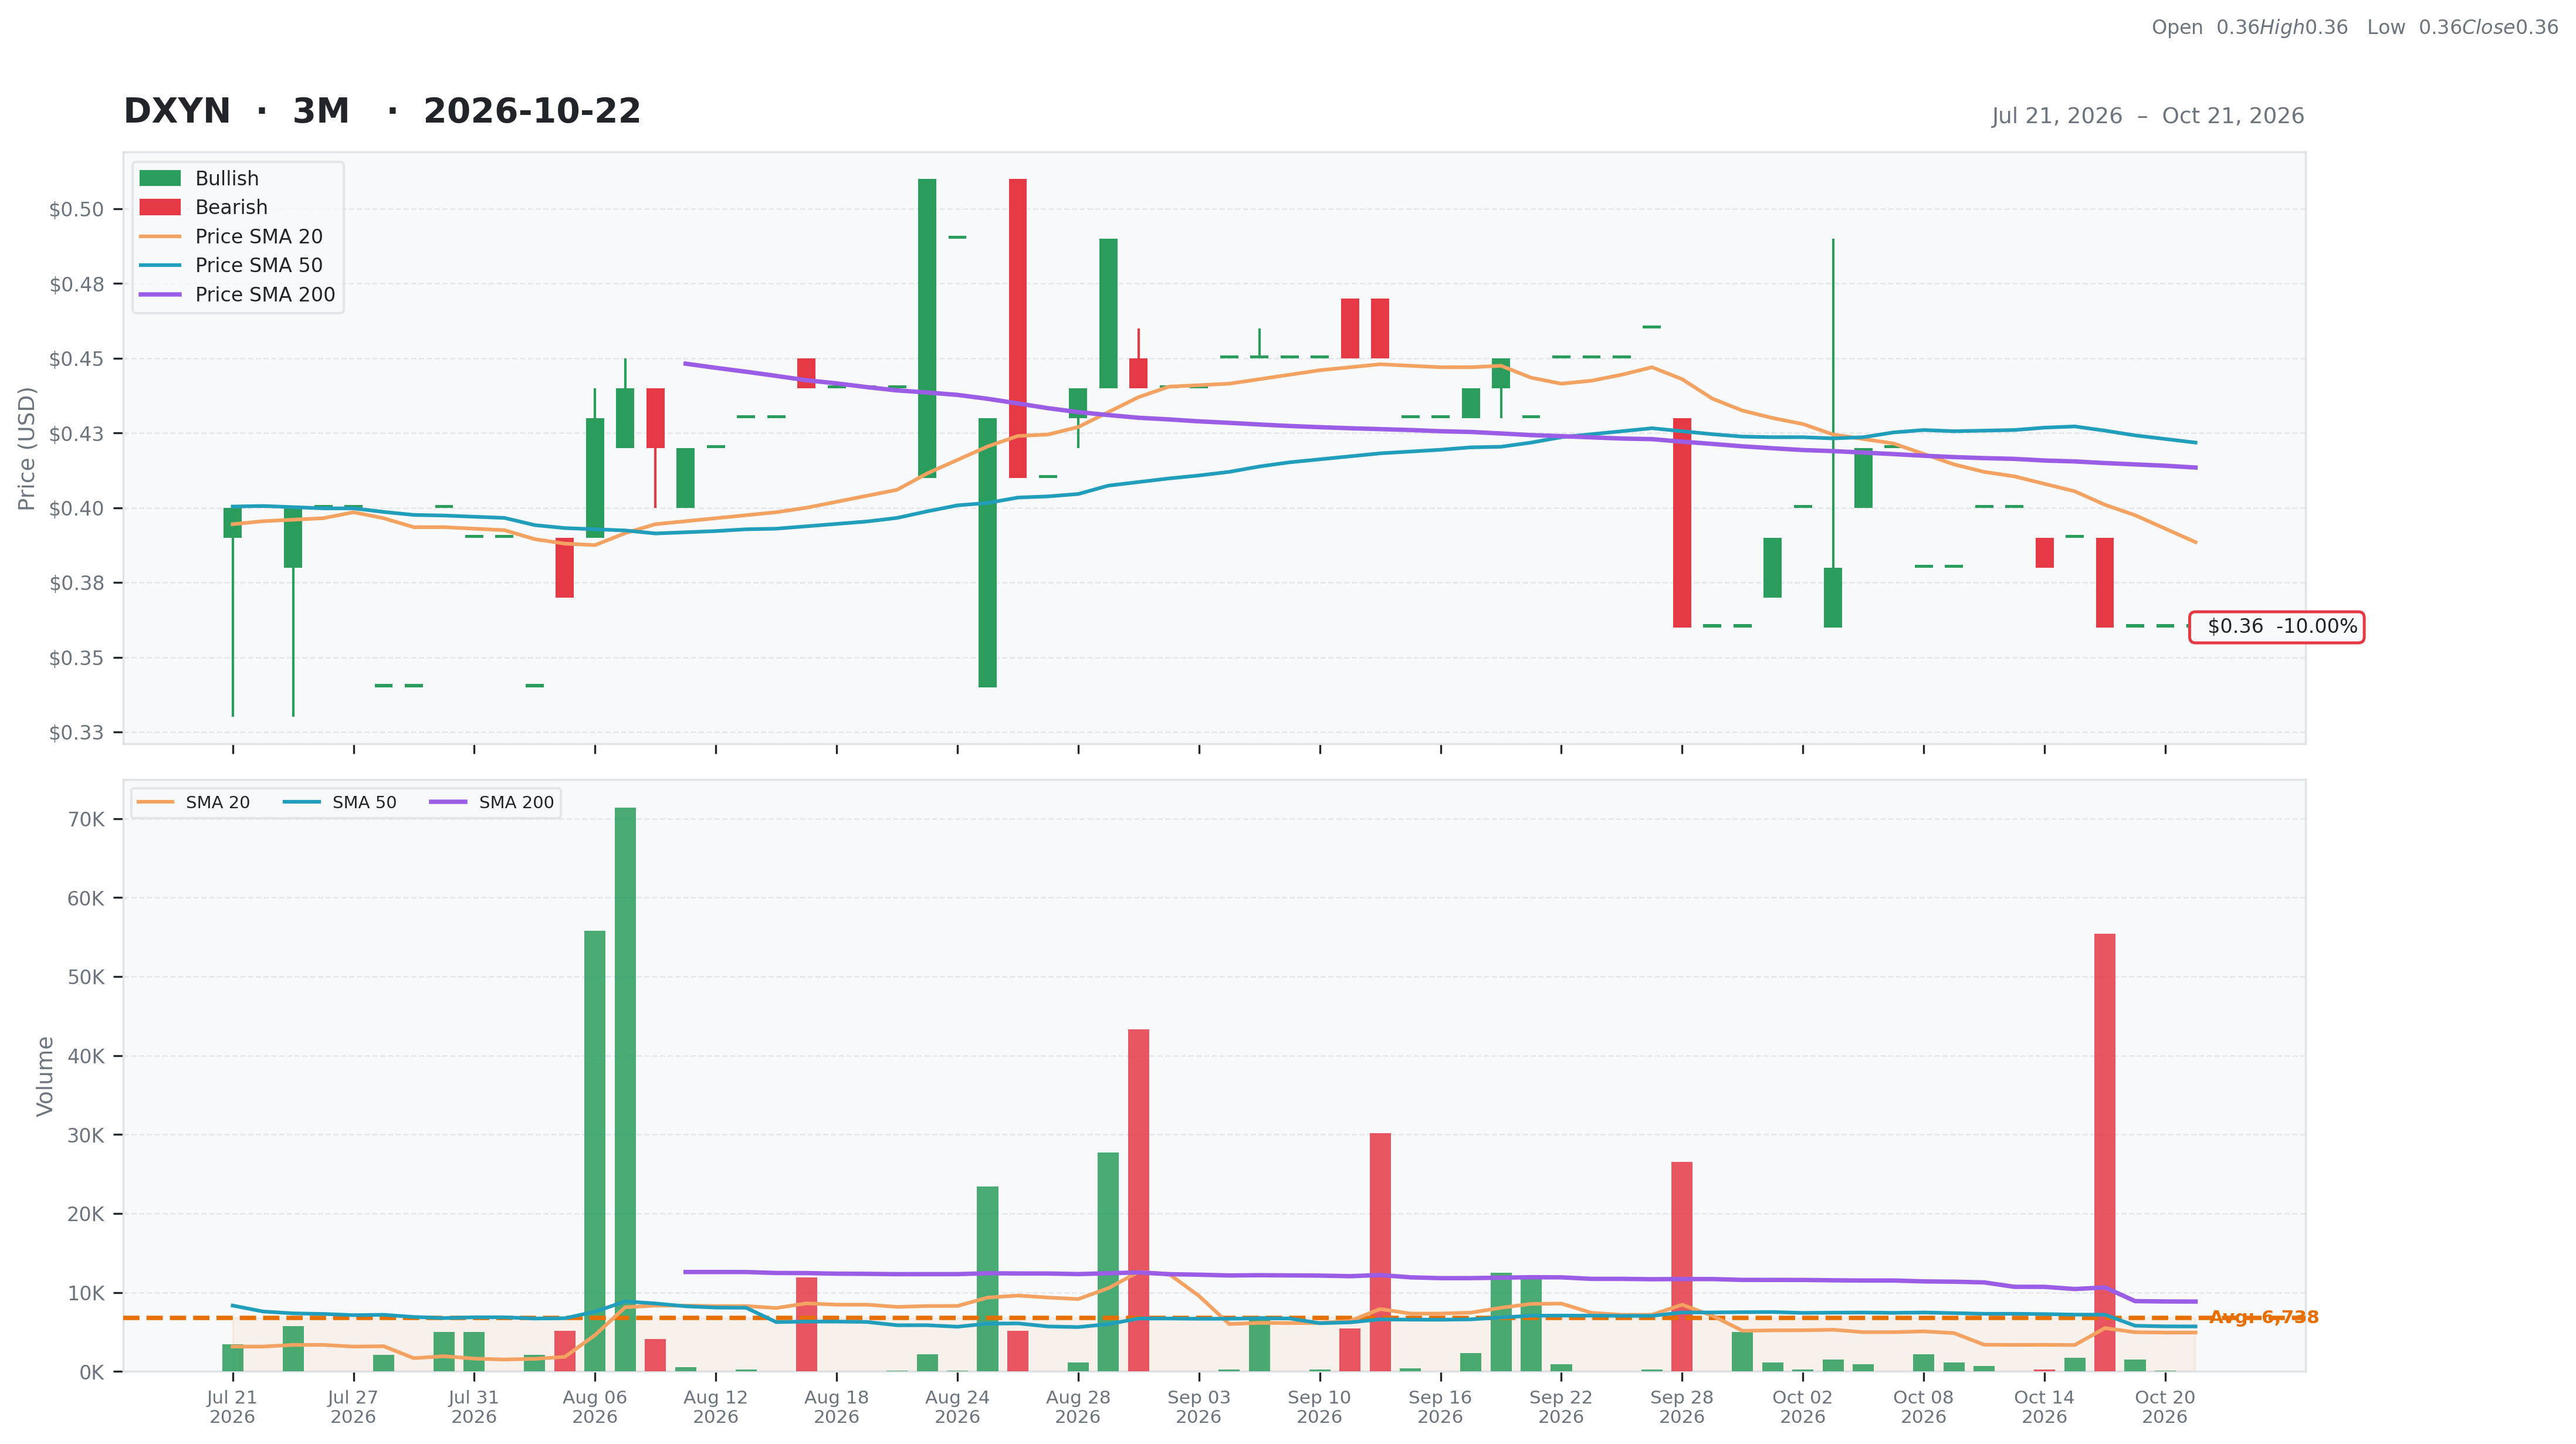
Consumer Cyclical • Textile Manufacturing • $0.36 • MCap: 5,529,737
https://www.thedixiegroup.com • The Dixie Group, Inc. manufactures, markets, and sells floorcovering products to residential customers in North America and internationally. The company offers residential carpet, custom rugs, and engineered wood products under the Fabrica brand for interior decorators and designers, selected retailers and furniture stores, luxury home builders, and manufacturers of luxury motor coaches and yachts; and specialty carpets and rugs for the high-end residential marketplace, as well as luxury vinyl flooring products and broadloom carpet products under the Masland Residential brand name through the interior design community and specialty floorcovering retailers. It provides residential tufted broadloom carpets and rugs to selected retailers and home centers under the DH floors and private label brands, as well as luxury vinyl flooring products to the marketplace it serves. The company is based in Dalton, Georgia.
Ani
Ex-AAII
| Score | Price | 52 Week & Averages | Relative Strength | Risk | |||||
|---|---|---|---|---|---|---|---|---|---|
| Total | 34 | Current | $0.36 | 52W High | $0.73 -50.68% | Relative Strength | -0.19 | Beta | 1.57 |
| Business Quality | 6 | Weekly | $0.38 -5.26% | 52W Low | $0.30 20.00% | 3M | -0.10 | Short % | 0 |
| Financial Strength | 4 | Monthly | $0.43 -16.28% | Above 50DMA | $0.42 -14.65% | 6M | 0.00 | Risk Score | |
| Growth Outlook | 0 | Quarterly | $0.40 -10.00% | Above 200DMA | $0.41 -12.92% | 9M | -0.27 | ||
| Momentum | 0 | Yearly | $0.69 -47.83% | 12M | -0.49 | ||||
| Valuation | Financial Strength | Growth/Profitability | |||
|---|---|---|---|---|---|
| Trailing P/E | N/A | Cash | 2M | Revenue Growth | 0.00% |
| Forward P/E | 1.44 | Debt | 108M | Earnings Growth | -0.09% |
| PEG Ratio | N/A | Debt/Equity | 970.01 | Qtr Earnings Growth | -0.06% |
| Price/Sales | 0.02 | Current Ratio | 0.99 | Gross Margin | 0.28% |
| Price/Book | 0.48 | Quick Ratio | 0.31 | Operating Margin | 0.05% |
| EV/Revenue | 0.44 | Operating CF | -1M | Profit Margin | -0.02% |
| EV/EBITDA | 11.35 | Free CF | 1M | EBITDA Margin | 0.04% |
| Ent Value | 111M | Return on Assets | 0.01% | ||
| Return on Equity | -0.33% | ||||
| Technical | Volume & Bollinger Bands | Analyst | |||
|---|---|---|---|---|---|
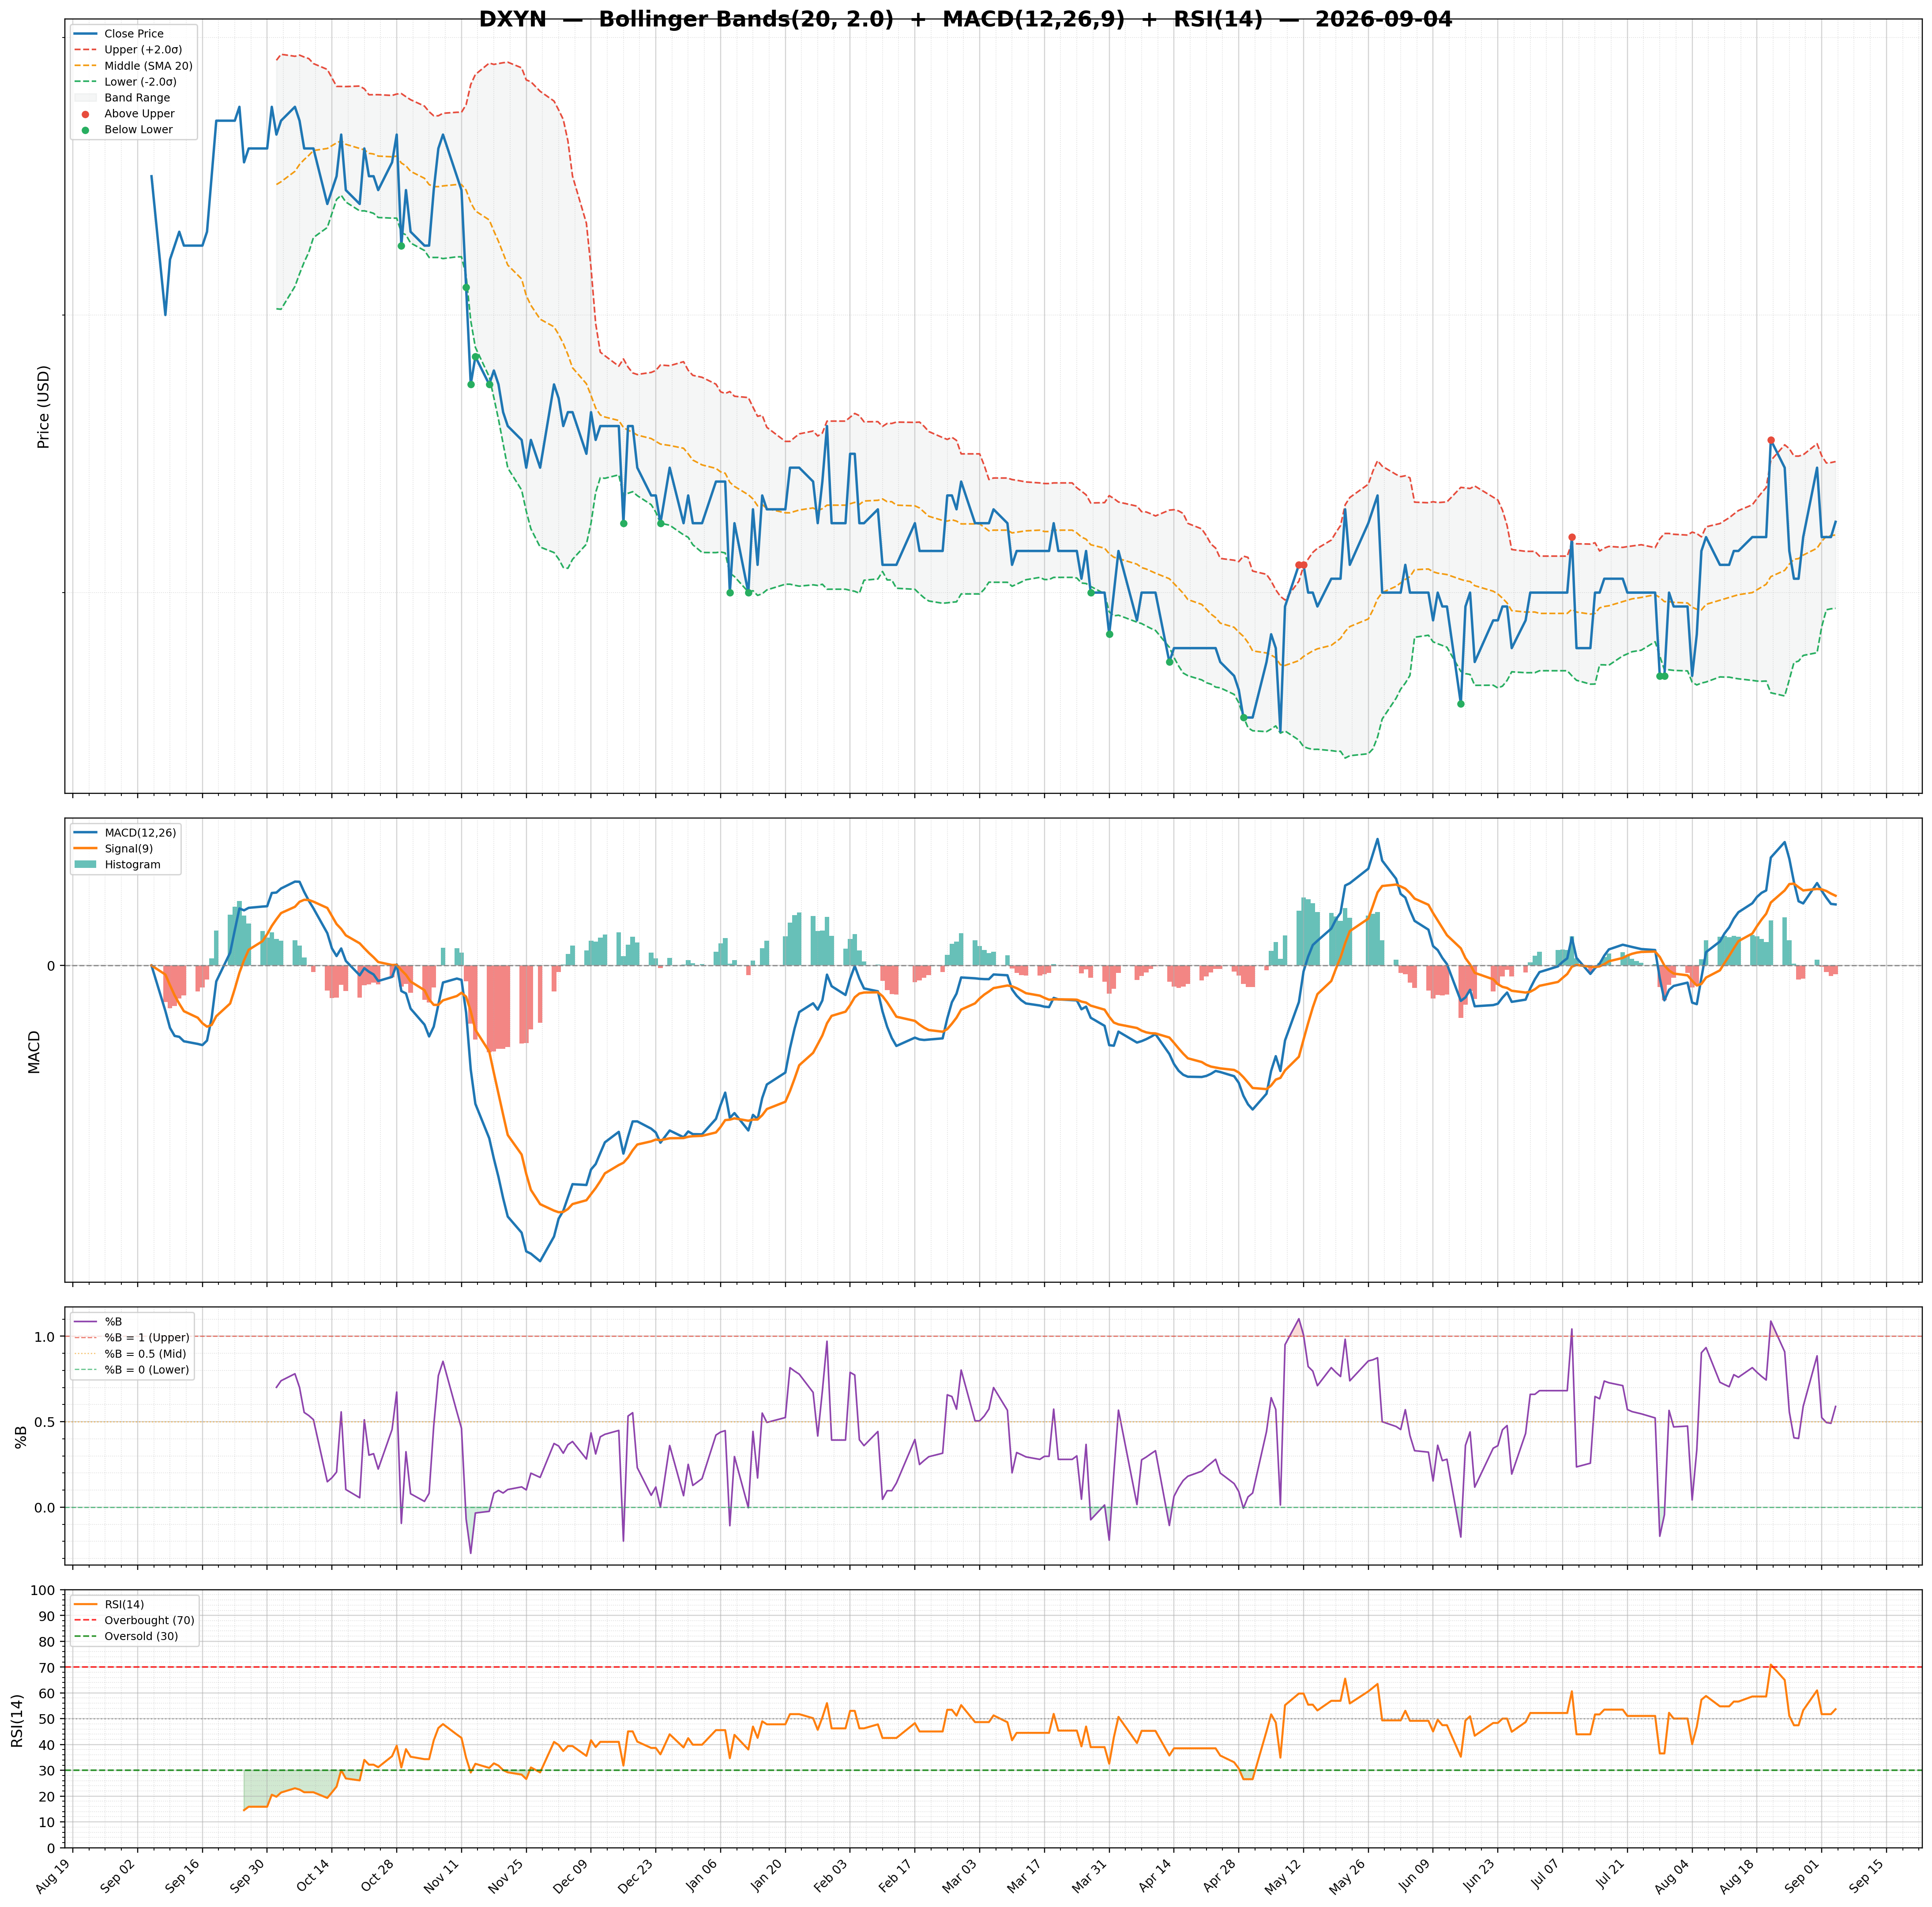
| RSI | 39.93 | Volume | 0.02M | Rating | none |
| Previous RSI | 39.93 | Avg Volume 20D | 0M | Target Mean | N/A |
| RSI Trend | Down | Relative Volume | N/A | Target High | N/A |
| MACD | -0.02 | Lower Band | 0.33 | Target Low | N/A |
| MACD Signal | -0.01 | Middle Band | 0.39 | Target Median | N/A |
| Histogram | -0.00 | Upper Band | 0.45 | Analysts | N/A |
| Previous Histogram | -0.00 | Bandwidth | 31.030 | Upside | N/A |
| Histogram Trend | Decreasing | %B | 0.26 | ||