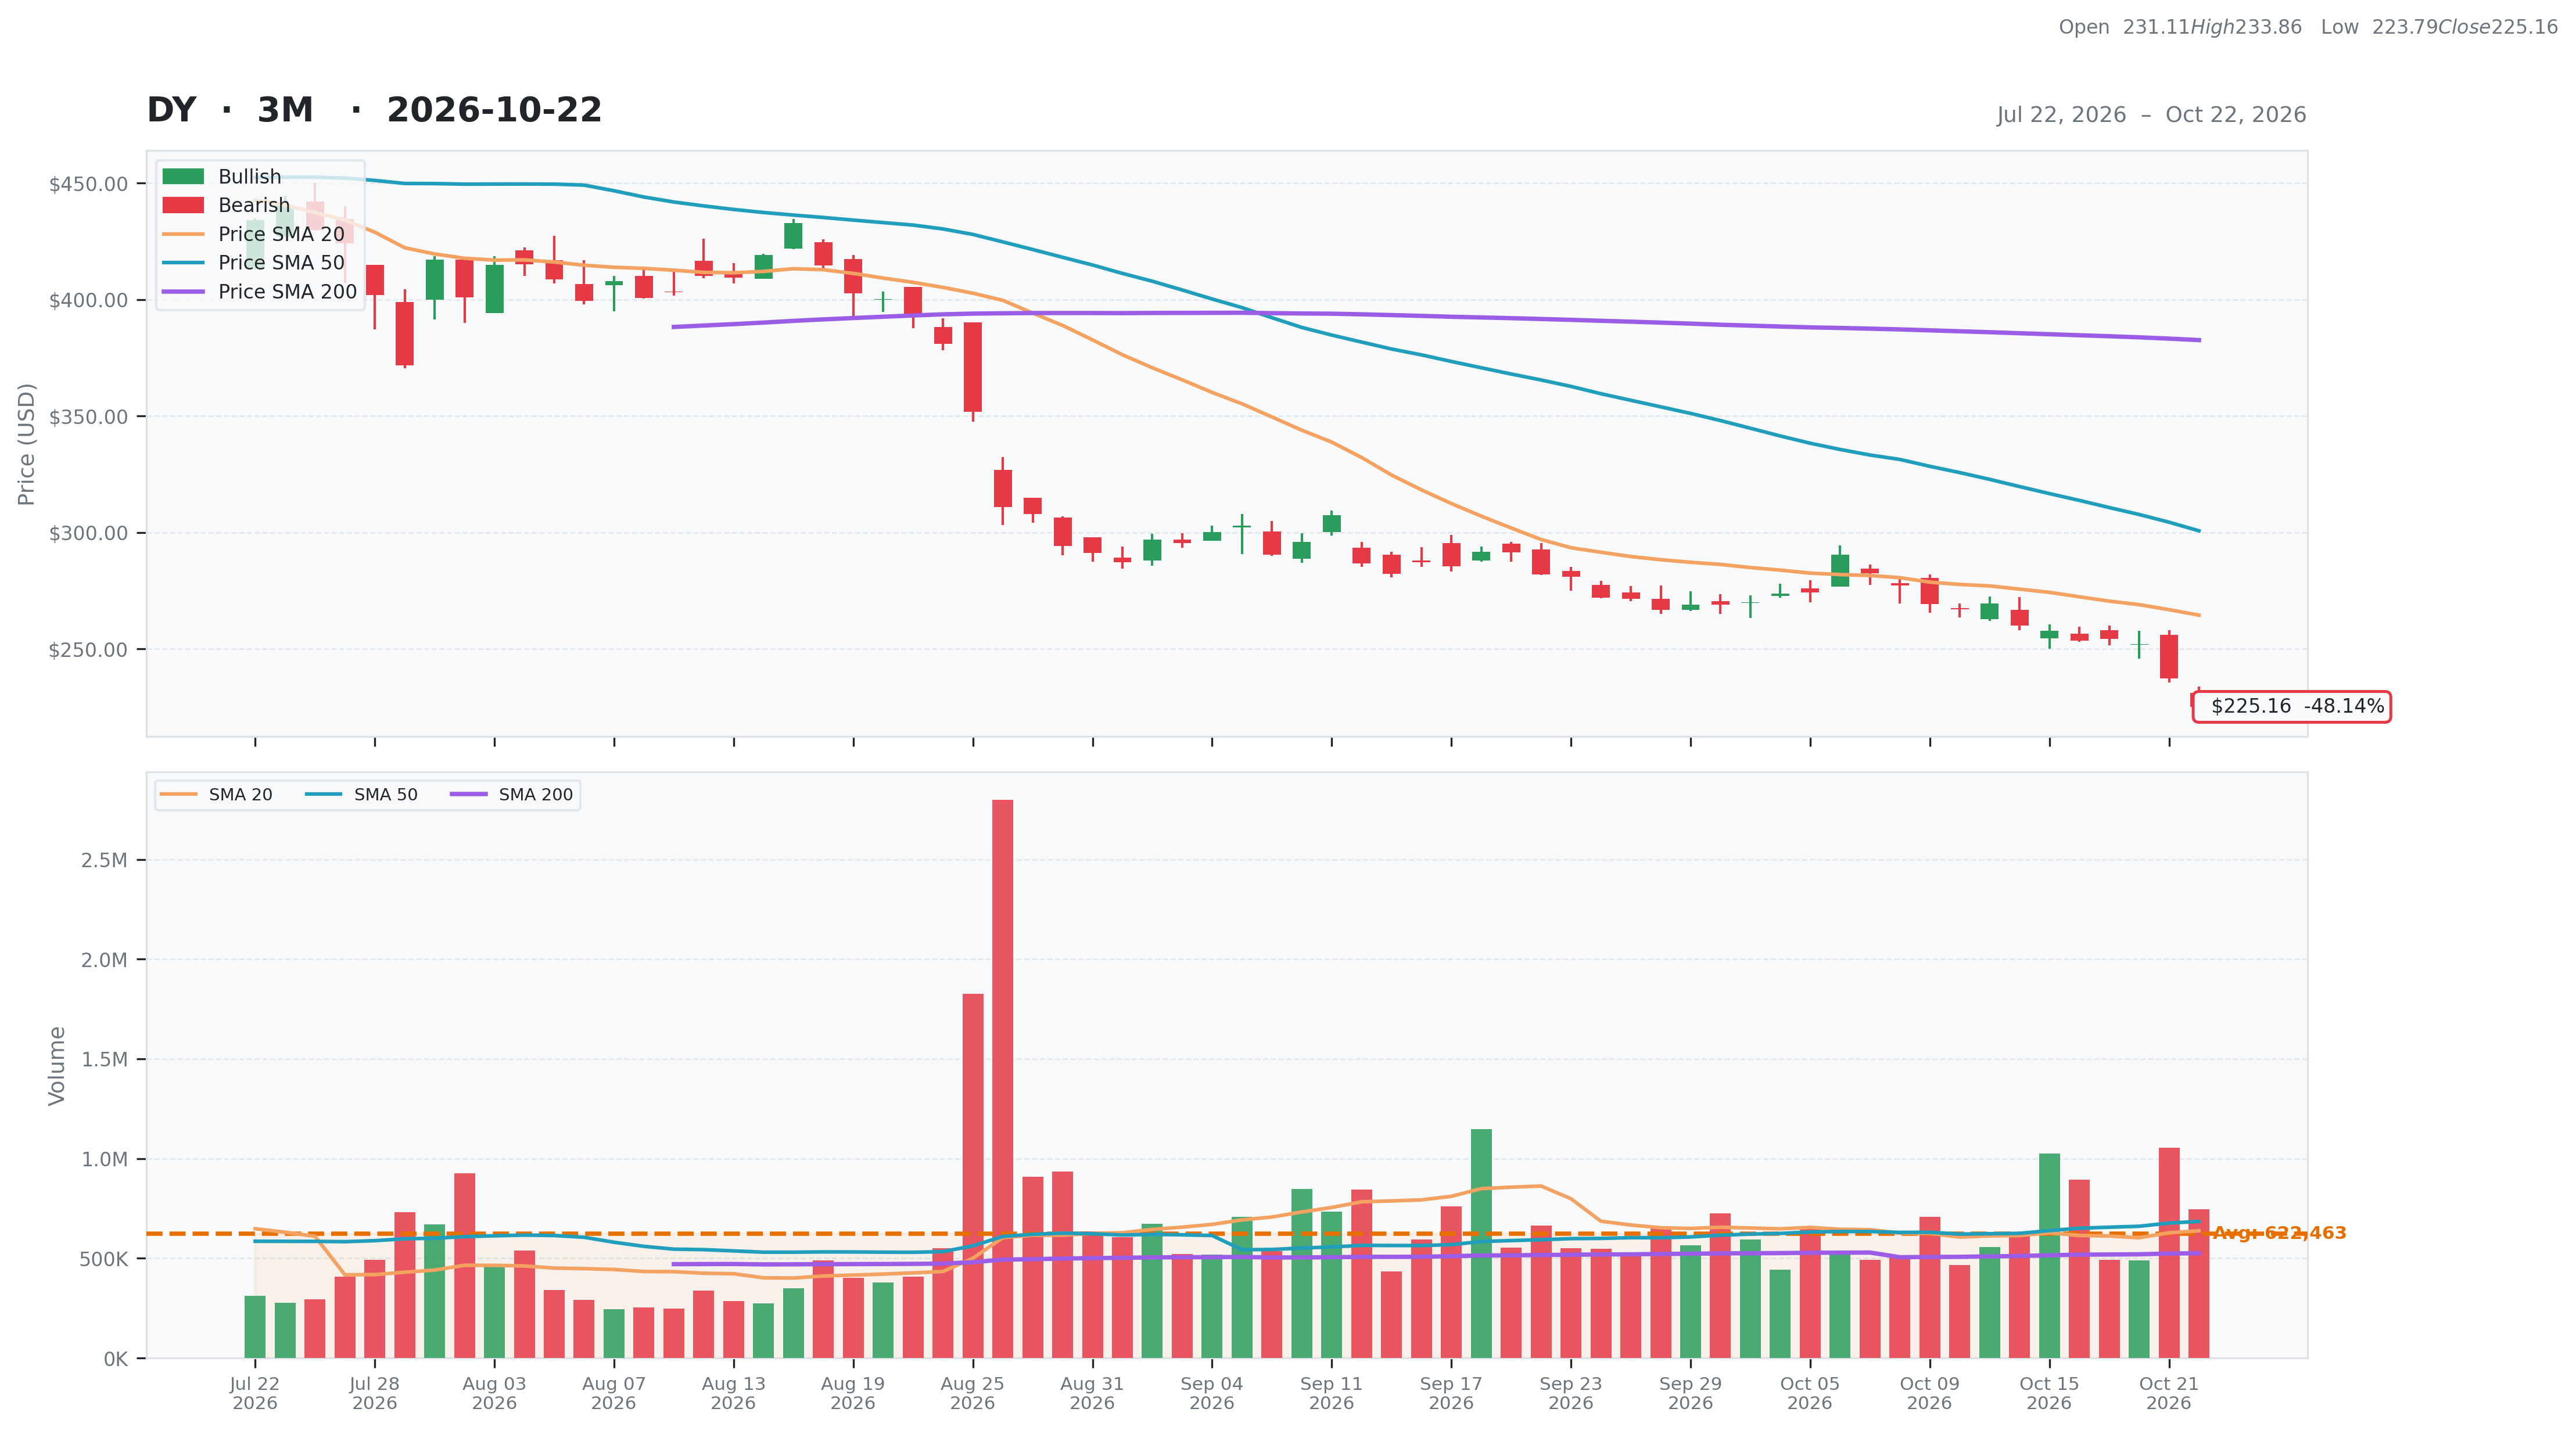
Dycom Industries, Inc. (DY)
Industrials • Engineering & Construction • $225.16 • MCap: 7,649,120,256
https://www.dycomind.com • Dycom Industries, Inc. provides specialty contracting services to the digital infrastructure, telecommunications infrastructure, and utility industries in the United States. It operates through Communications and Building Systems segments. The company offers engineering services to telecommunications providers, including the planning and design of aerial, underground, and buried fiber optic, copper, and coaxial cable systems; placement of cables, related structures, and drop lines for telephone companies and cable multiple system operators; program and project management, and inspection personnel; and wireless networks in connection with the deployment of macro cell and new small cell sites. It also provides construction, maintenance, and installation services, such as placement and splicing of copper, fiber, and coaxial cables; tower construction, lines and antenna installation, foundation and equipment pad construction, and small cell site placement for wireless carriers, as well as equipment installation and material fabrication, and site testing services; underground facility locating services, including locating telephone, cable television, power, water, sewer, and gas lines for utility companies; installation and maintenance of customer premise equipment for electric and gas utilities, and other customers. Dycom Industries, Inc. was incorporated in 1969 and is based in West Palm Beach, Florida.
Google_BUY_Rating
| Score | Price | 52 Week & Averages | Relative Strength | Risk | |||||
|---|---|---|---|---|---|---|---|---|---|
| Total | 49 | Current | $225.16 | 52W High | $535.20 -57.93% | Relative Strength | -0.41 | Beta | 1.50 |
| Business Quality | 6 | Weekly | $257.78 -12.65% | 52W Low | $225.16 0.00% | 3M | -0.48 | Short % | 0.06 |
| Financial Strength | 16 | Monthly | $282.02 -20.16% | Above 50DMA | $300.75 -25.13% | 6M | -0.46 | Risk Score | 2 |
| Growth Outlook | 9 | Quarterly | $429.81 -47.61% | Above 200DMA | $382.64 -41.16% | 9M | -0.41 | ||
| Momentum | 3 | Yearly | $284.16 -20.76% | 12M | -0.23 | ||||
| Valuation | Financial Strength | Growth/Profitability | |||
|---|---|---|---|---|---|
| Trailing P/E | 23.16 | Cash | 352M | Revenue Growth | 0.46% |
| Forward P/E | 12.20 | Debt | 3,048M | Earnings Growth | 0.14% |
| PEG Ratio | 3.50 | Debt/Equity | 147.70 | Qtr Earnings Growth | 0.19% |
| Price/Sales | 1.11 | Current Ratio | 2.35 | Gross Margin | 0.21% |
| Price/Book | 3.71 | Quick Ratio | 2.20 | Operating Margin | 0.10% |
| EV/Revenue | 1.50 | Operating CF | 718M | Profit Margin | 0.05% |
| EV/EBITDA | 11.10 | Free CF | 327M | EBITDA Margin | 0.14% |
| Ent Value | 10,346M | Return on Assets | 0.07% | ||
| Return on Equity | 0.19% | ||||
| Technical | Volume & Bollinger Bands | Analyst | |||
|---|---|---|---|---|---|
| RSI | 21.46 | Volume | 0.89M | Rating | strong_buy |
| Previous RSI | 24.92 | Avg Volume 20D | 0.64M | Target Mean | $520.91 |
| RSI Trend | Down | Relative Volume | 1.14 | Target High | $625.00 |
| MACD | -16.48 | Lower Band | 234.65 | Target Low | $375.00 |
| MACD Signal | -14.80 | Middle Band | 264.54 | Target Median | $525.00 |
| Histogram | -1.69 | Upper Band | 294.43 | Analysts | 11 |
| Previous Histogram | -0.46 | Bandwidth | 22.600 | Upside | 105.40% |
| Histogram Trend | Decreasing | %B | -0.16 | ||