Eastern Company (The) (EML)
Industrials • Tools & Accessories • $24.85 • MCap: 146,286,832
https://www.easterncompany.com • The Eastern Company designs, manufactures, and sells engineered solutions to industrial markets in the United States and North America. The company offers turnkey returnable packaging solutions, which are used in the assembly processes of vehicles, aircraft, and durable goods, as well as in production processes of plastic packaging products, packaged consumer goods, and pharmaceuticals; injection blow mold tooling products; design, develops, and manufactures 2-step stretch blow molds, and related components for the stretch blow molding industry; and supplies blow molds and change parts to the food, beverage, healthcare, and chemical industries. It also provides rotary latches, compression latches, draw latches, hinges, camlocks, key switches, padlocks, and handles; and development and program management services for custom electromechanical and mechanical systems for original equipment manufacturers (OEM) and customer applications. In addition, the company designs and manufactures proprietary vision technology for OEMs and aftermarket applications, as well as offers aftermarket components to the heavy- and medium-duty truck, motorhome, and bus markets. The Eastern Company was founded in 1858 and is based in Shelton, Connecticut.
AAII
| Score | Price | 52 Week & Averages | Relative Strength | Risk | |||||
|---|---|---|---|---|---|---|---|---|---|
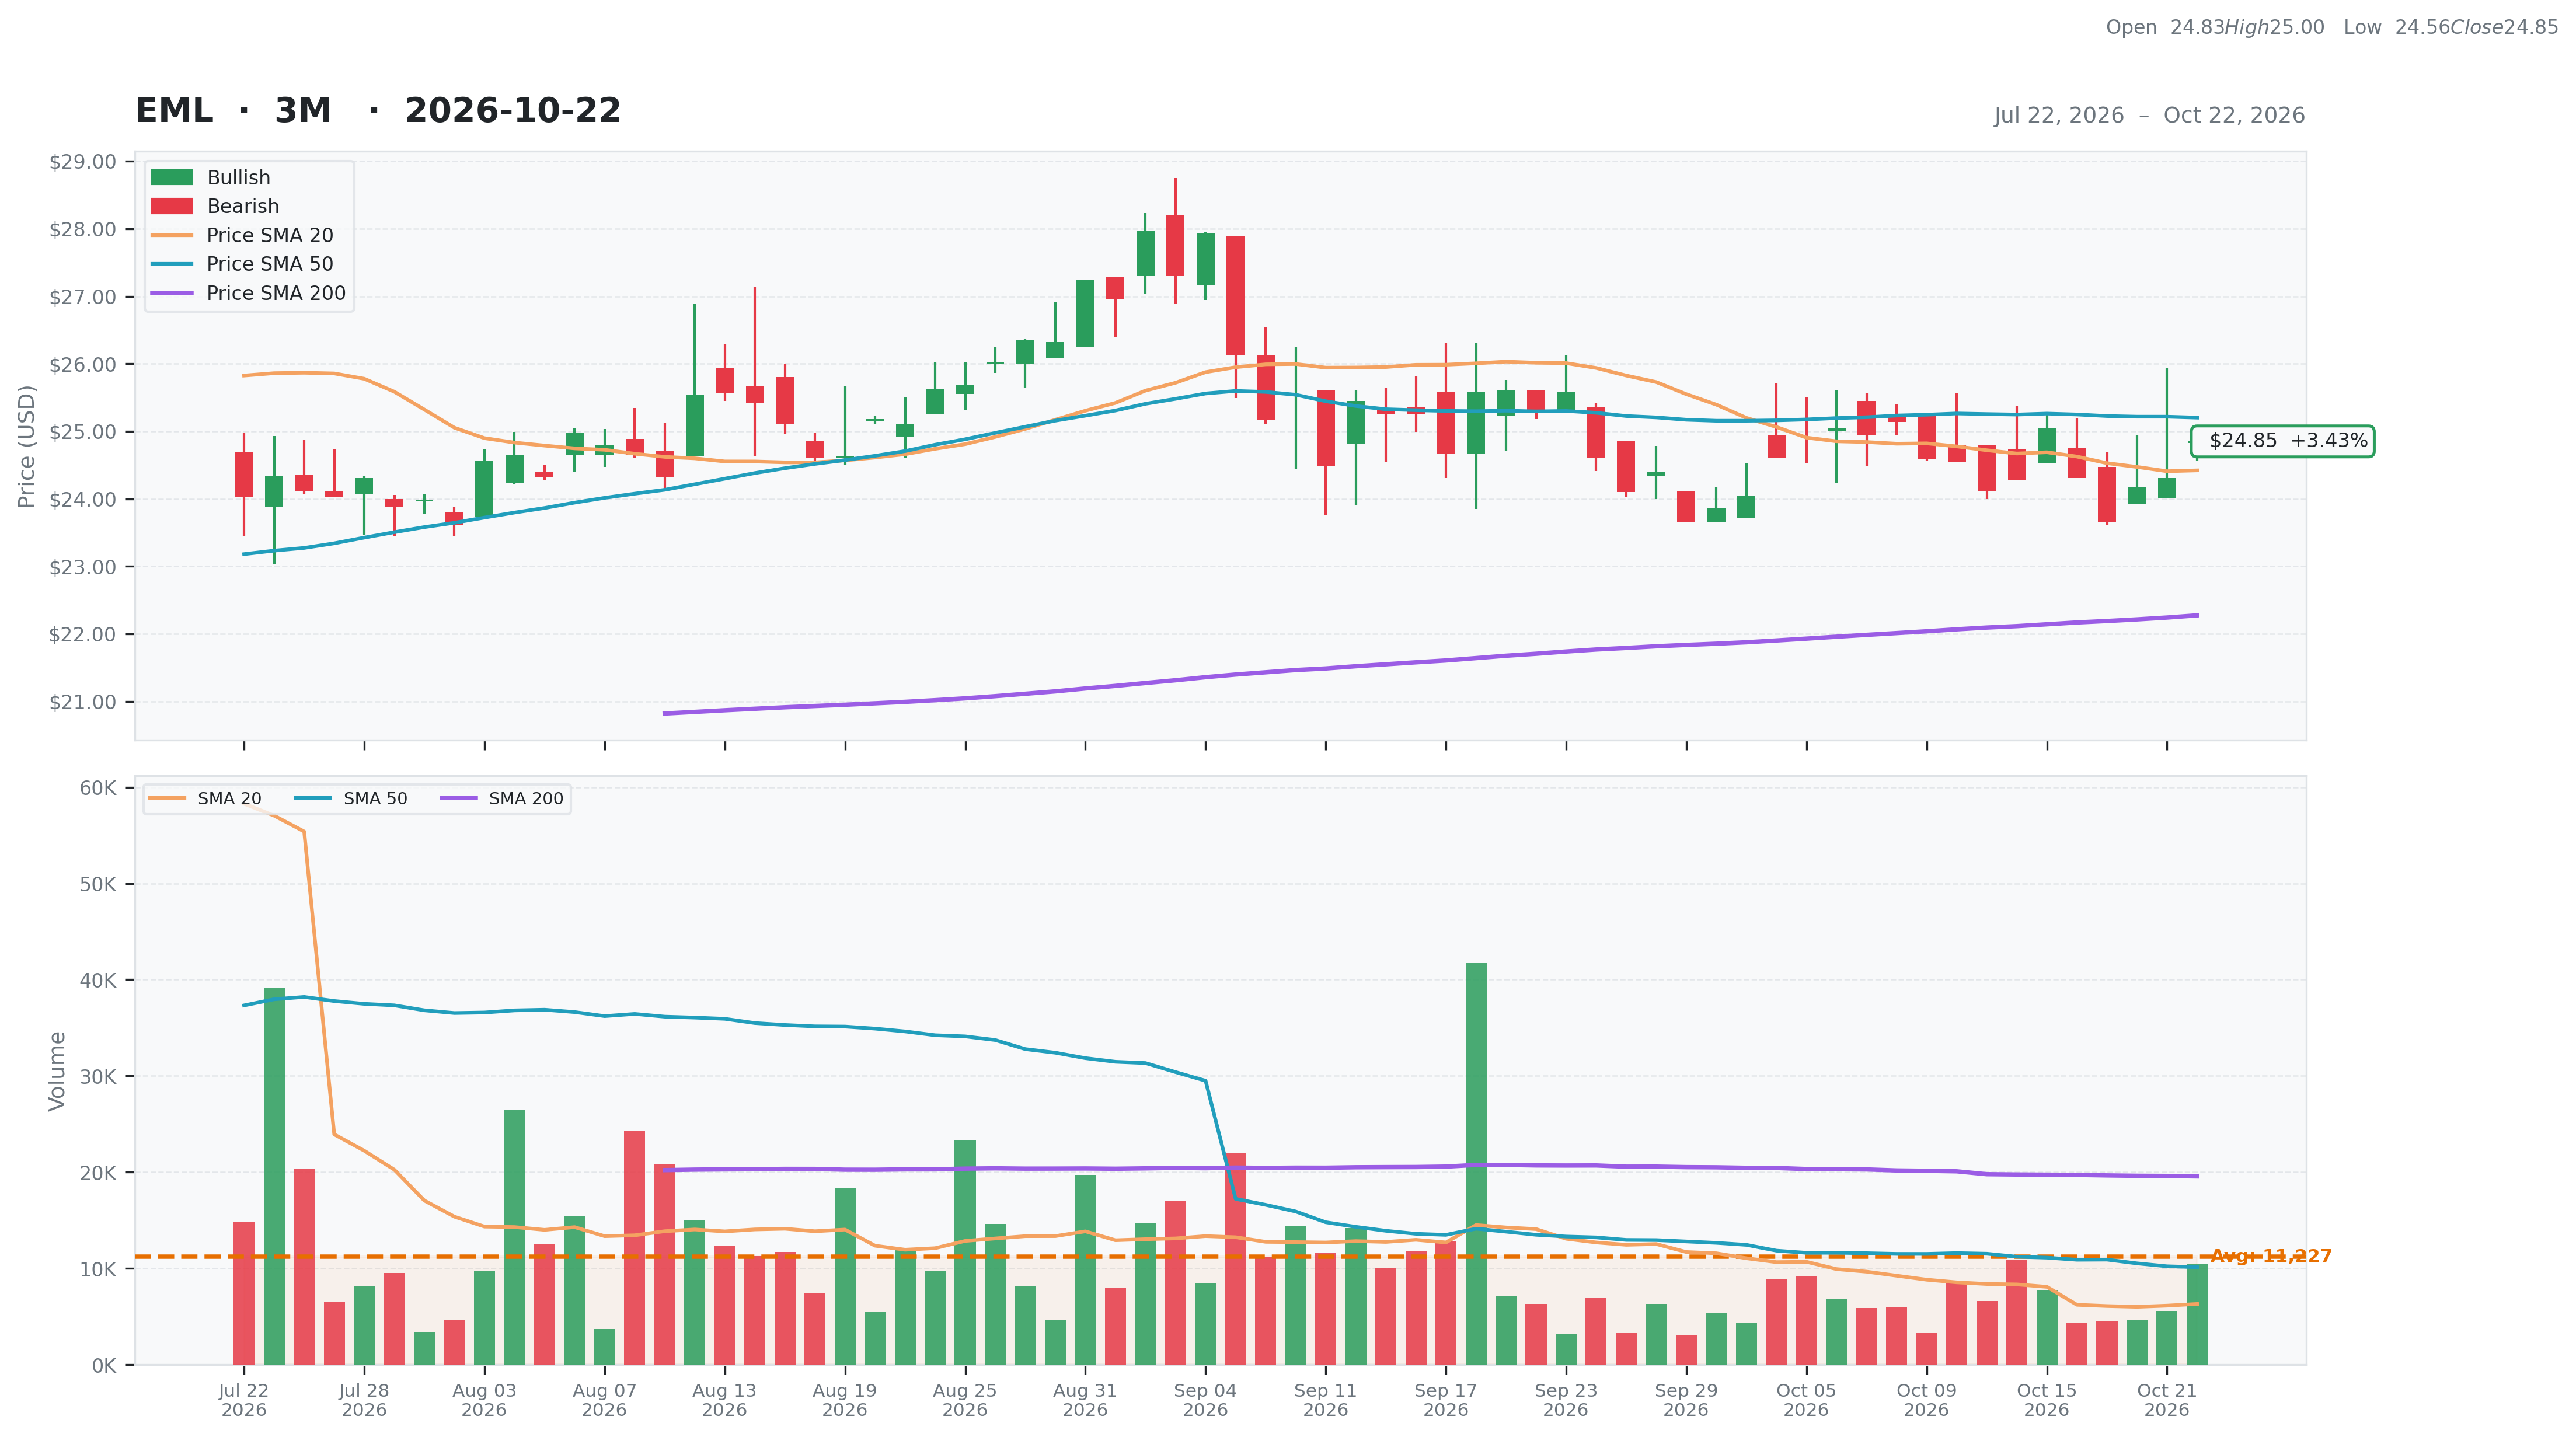
| Total | 50 | Current | $24.85 | 52W High | $29.26 -15.08% | Relative Strength | 0.15 | Beta | 0.86 |
| Business Quality | 4 | Weekly | $25.04 -0.76% | 52W Low | $17.51 41.88% | 3M | 0.03 | Short % | 0.03 |
| Financial Strength | 11 | Monthly | $25.29 -1.74% | Above 50DMA | $25.20 -1.40% | 6M | 0.14 | Risk Score | 2 |
| Growth Outlook | 11 | Quarterly | $24.12 3.04% | Above 200DMA | $22.27 11.56% | 9M | 0.37 | ||
| Momentum | 2 | Yearly | $20.92 18.78% | 12M | 0.20 | ||||
| Valuation | Financial Strength | Growth/Profitability | |||
|---|---|---|---|---|---|
| Trailing P/E | 21.14 | Cash | 15M | Revenue Growth | -0.12% |
| Forward P/E | N/A | Debt | 62M | Earnings Growth | 0.68% |
| PEG Ratio | N/A | Debt/Equity | 47.34 | Qtr Earnings Growth | 0.64% |
| Price/Sales | 0.62 | Current Ratio | 2.80 | Gross Margin | 0.21% |
| Price/Book | 1.13 | Quick Ratio | 1.17 | Operating Margin | 0.03% |
| EV/Revenue | 0.82 | Operating CF | 19M | Profit Margin | 0.03% |
| EV/EBITDA | 11.86 | Free CF | 5M | EBITDA Margin | 0.07% |
| Ent Value | 193M | Return on Assets | 0.03% | ||
| Return on Equity | 0.06% | ||||
| Technical | Volume & Bollinger Bands | Analyst | |||
|---|---|---|---|---|---|
| RSI | 51.51 | Volume | 0M | Rating | none |
| Previous RSI | 46.87 | Avg Volume 20D | 0.01M | Target Mean | N/A |
| RSI Trend | Up | Relative Volume | 1.24 | Target High | N/A |
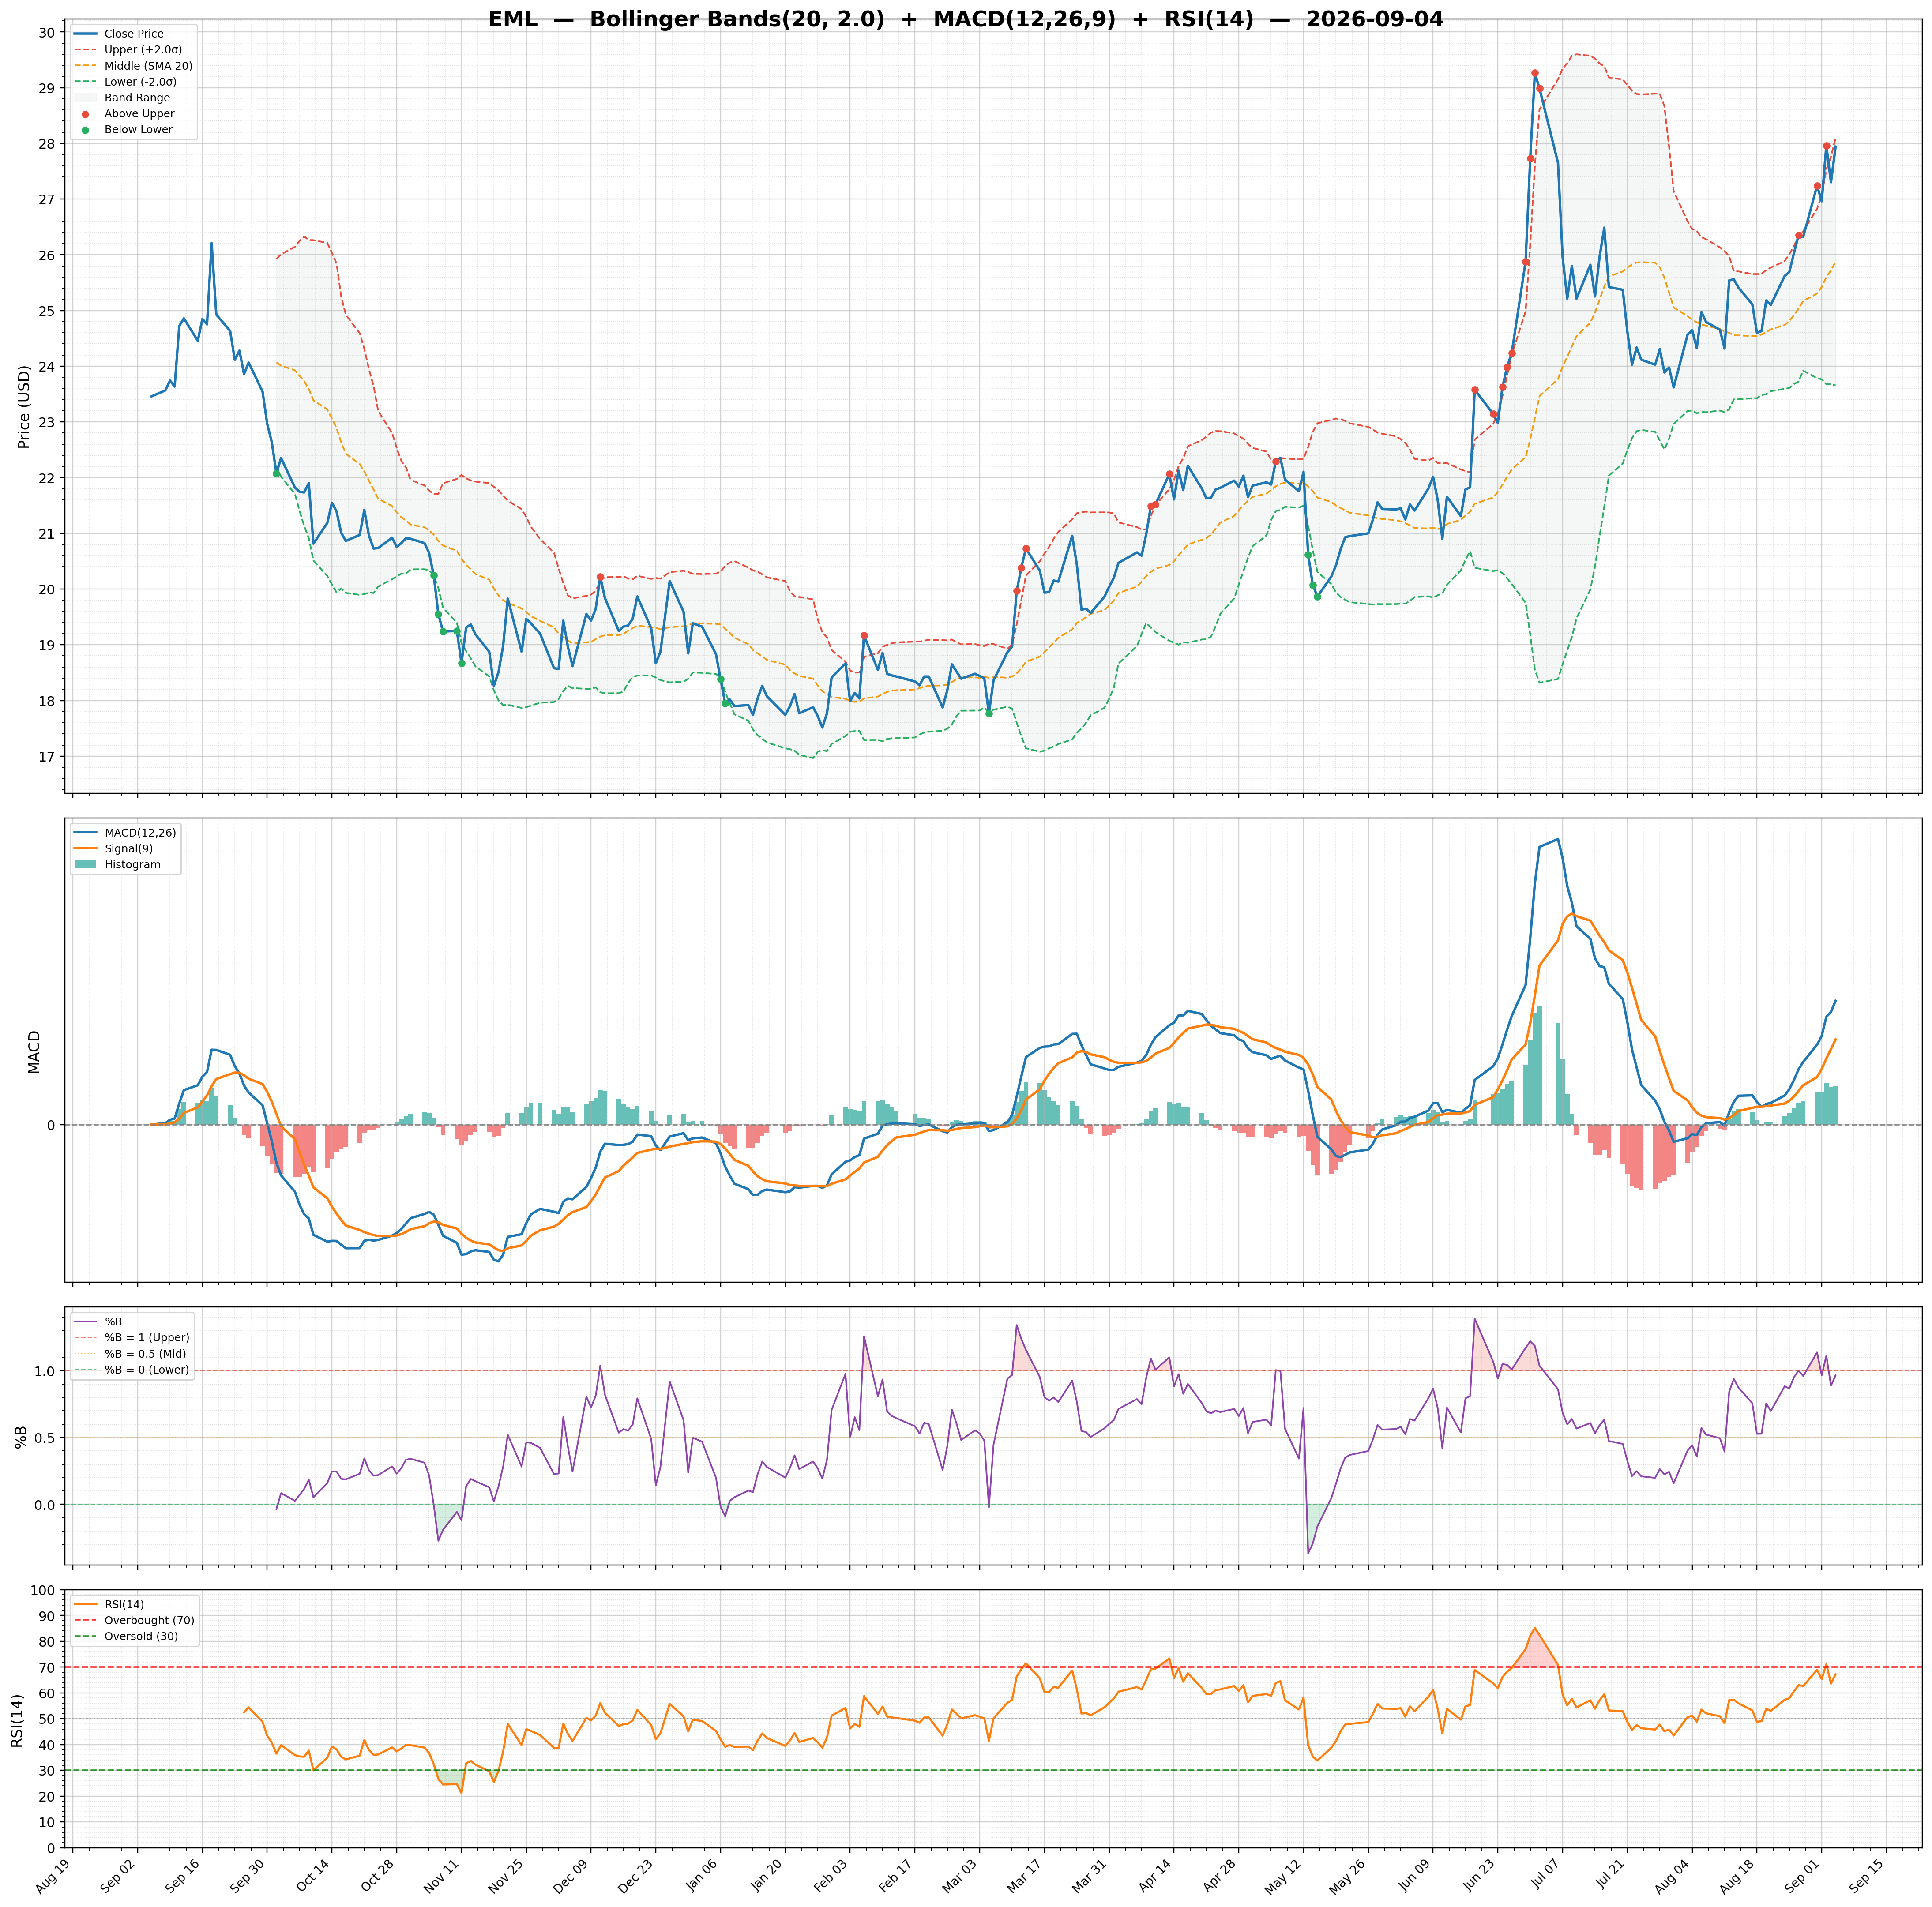
| MACD | -0.20 | Lower Band | 23.52 | Target Low | N/A |
| MACD Signal | -0.24 | Middle Band | 24.42 | Target Median | N/A |
| Histogram | 0.03 | Upper Band | 25.33 | Analysts | N/A |
| Previous Histogram | -0.01 | Bandwidth | 7.420 | Upside | N/A |
| Histogram Trend | Increasing | %B | 0.74 | ||