Eos Energy Enterprises, Inc. (EOSE)
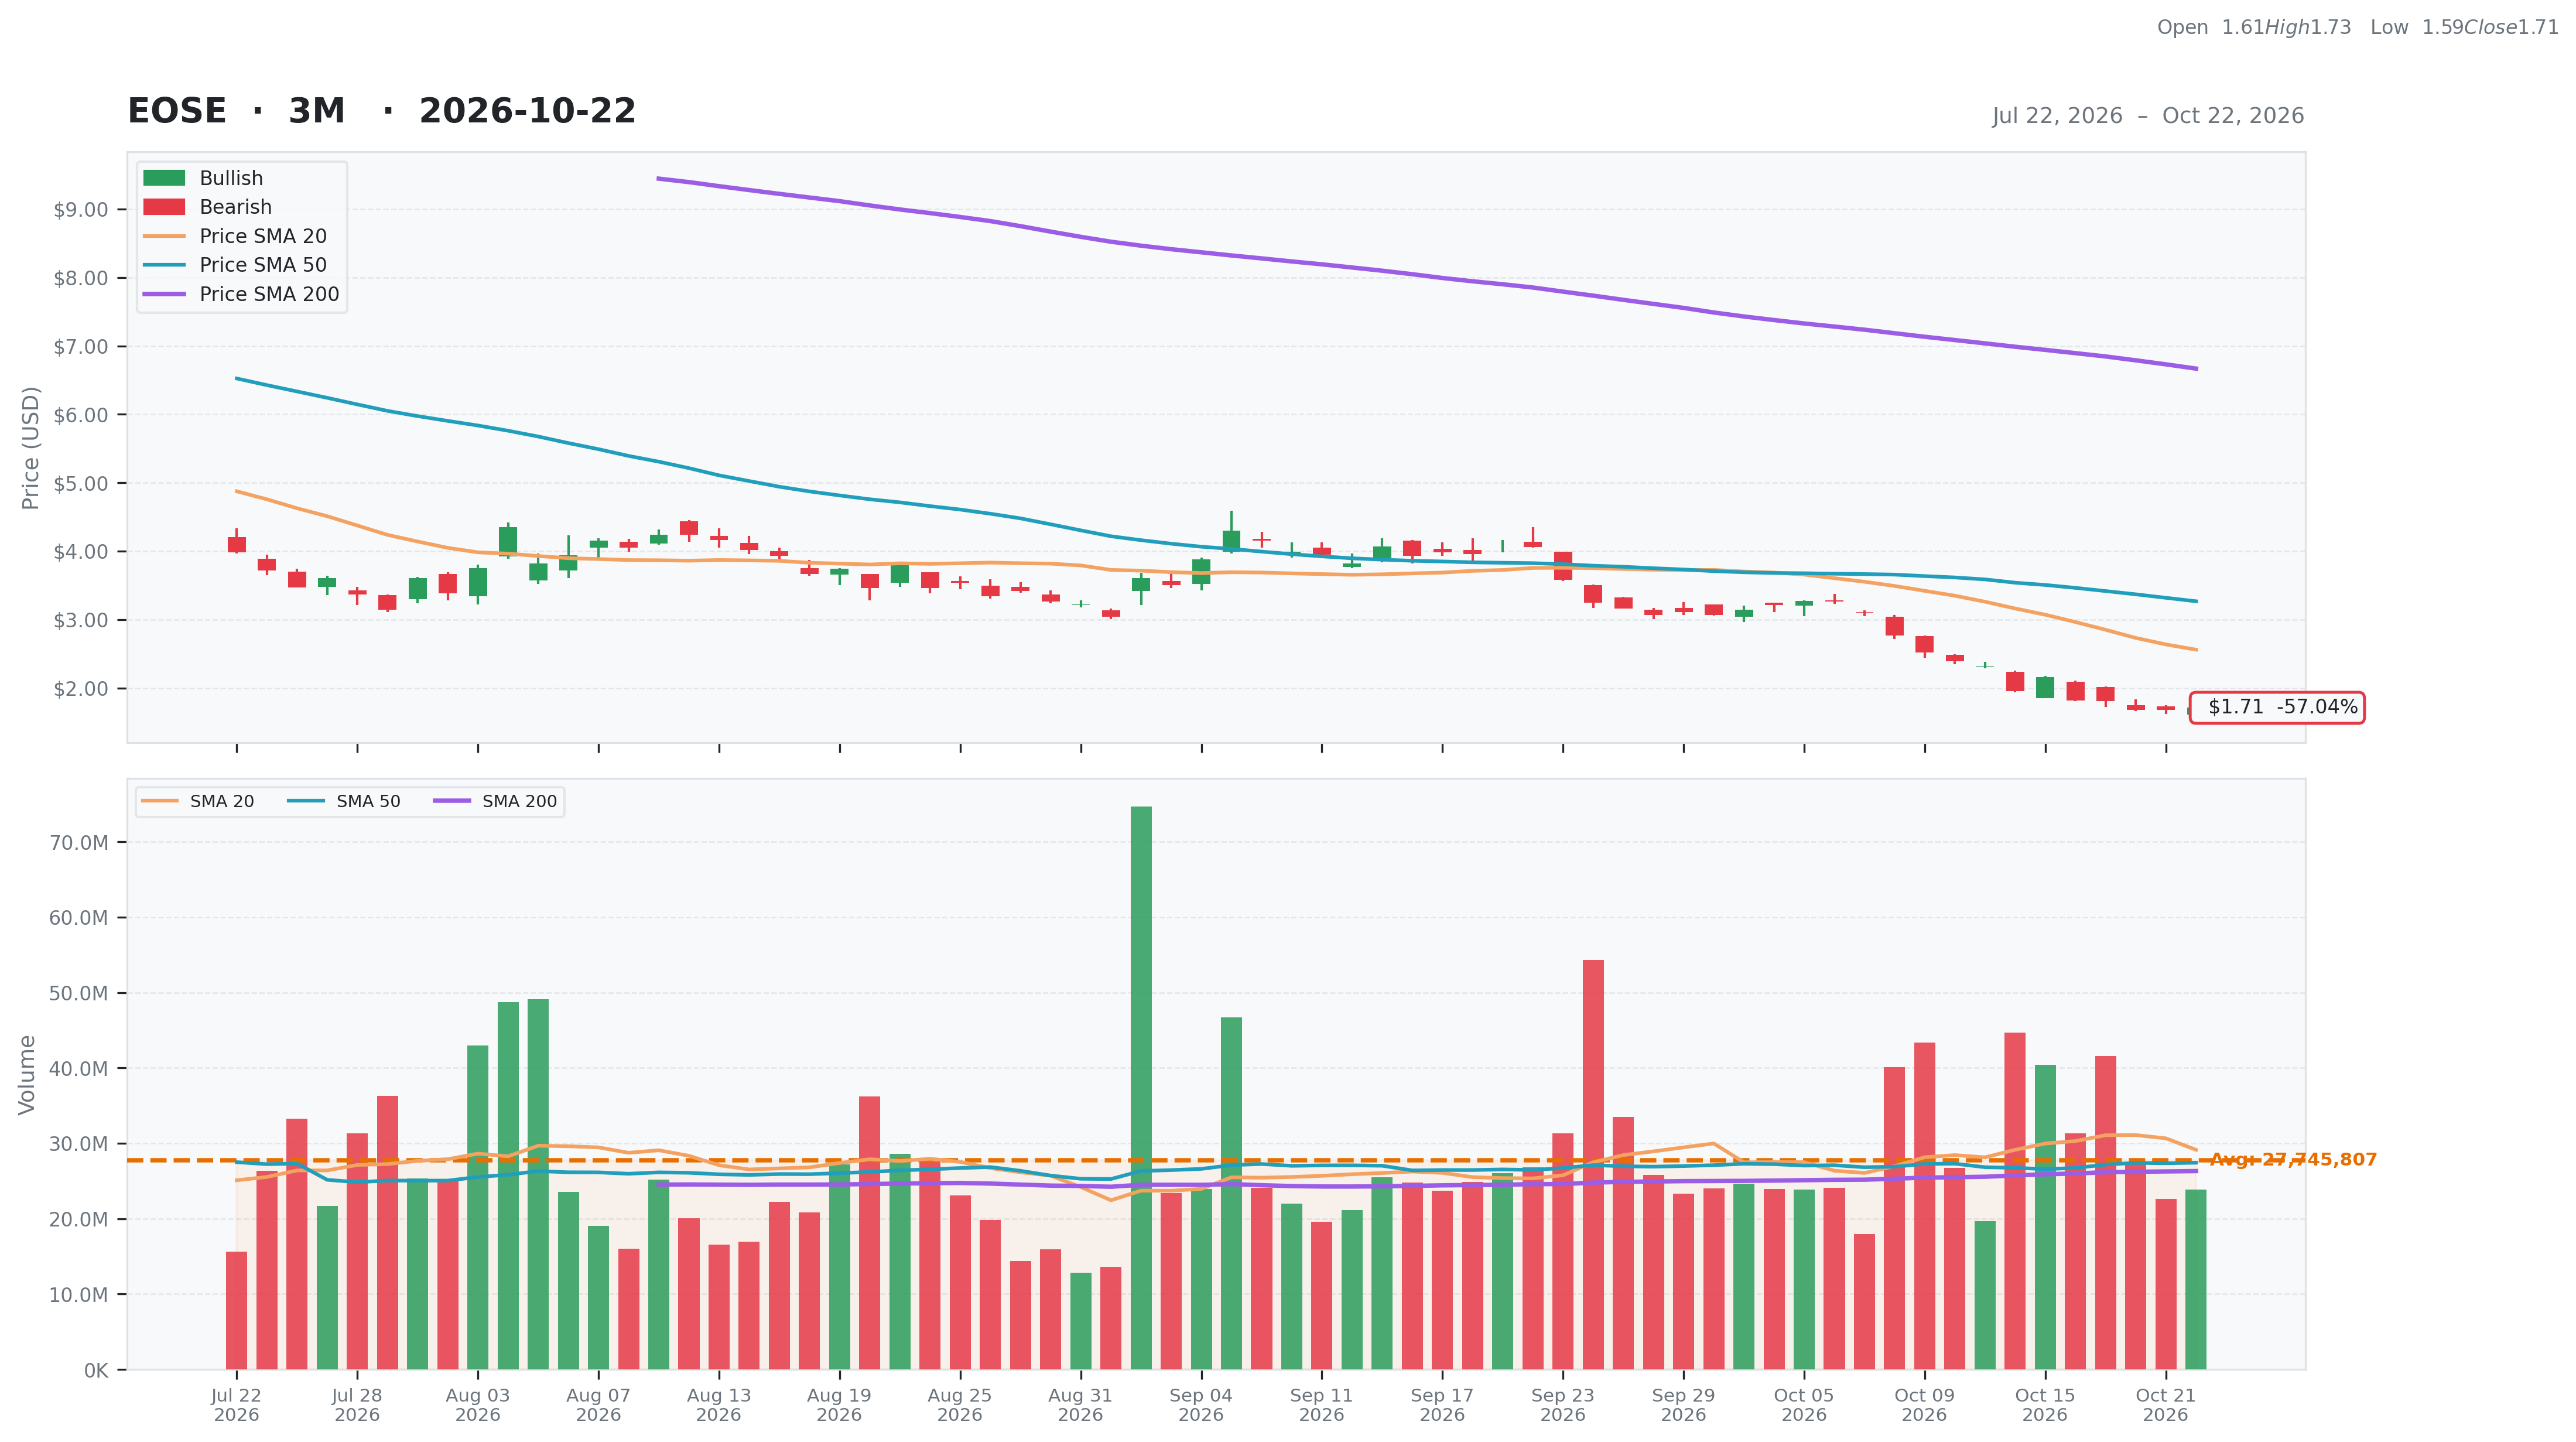
Industrials • Electrical Equipment & Parts • $1.71 • MCap: 658,270,976
https://www.eose.com • Eos Energy Enterprises, Inc. designs, develops, manufactures, and markets energy storage solutions for utility-scale, microgrid, and commercial and industrial applications in the United States. The company offers Znyth technology battery energy storage system (BESS), which provides operating flexibility to manage increased grid complexity and price volatility. It also provides the Z3 battery module that provides utilities, independent power producers, renewables developers, and commercial and industrial customers with an alternative to lithium-ion and lead-acid monopolar batteries for critical 3- to 12-hour discharge duration applications; a battery management system, which provides remote asset monitoring capability and service to track the performance and health of BESS and identify future system performance issues through predictive analytics; and project management and commissioning services, as well as long-term maintenance plans. The company also provides Eos Indensity, an energy storage architecture; Eos Cube; and DawnOS, a proprietary U.S.-engineered battery management and analytics platform. Eos Energy Enterprises, Inc. was formerly known as B. Riley Principal Merger Corp. II and changed its name to Eos Energy Enterprises, Inc. in November 2020. The company was founded in 2008 and is headquartered in Pittsburgh, Pennsylvania.
ET
| Score | Price | 52 Week & Averages | Relative Strength | Risk | |||||
|---|---|---|---|---|---|---|---|---|---|
| Total | 33 | Current | $1.71 | 52W High | $19.19 -91.09% | Relative Strength | -0.71 | Beta | 2.88 |
| Business Quality | 1 | Weekly | $2.16 -20.83% | 52W Low | $1.68 1.79% | 3M | -0.51 | Short % | 0.37 |
| Financial Strength | 15 | Monthly | $4.06 -57.88% | Above 50DMA | $3.27 -47.66% | 6M | -0.75 | Risk Score | 9 |
| Growth Outlook | 1 | Quarterly | $3.47 -50.72% | Above 200DMA | $6.67 -74.36% | 9M | -0.91 | ||
| Momentum | 2 | Yearly | $15.38 -88.88% | 12M | -0.89 | ||||
| Valuation | Financial Strength | Growth/Profitability | |||
|---|---|---|---|---|---|
| Trailing P/E | N/A | Cash | 305M | Revenue Growth | 3.51% |
| Forward P/E | -10.49 | Debt | 641M | Earnings Growth | N/A |
| PEG Ratio | N/A | Debt/Equity | N/A | Qtr Earnings Growth | N/A |
| Price/Sales | 3.07 | Current Ratio | 3.26 | Gross Margin | -0.85% |
| Price/Book | -0.60 | Quick Ratio | 2.34 | Operating Margin | -1.22% |
| EV/Revenue | 7.99 | Operating CF | -308M | Profit Margin | -2.47% |
| EV/EBITDA | -6.02 | Free CF | -324M | EBITDA Margin | -1.33% |
| Ent Value | 1,711M | Return on Assets | -0.30% | ||
| Return on Equity | N/A | ||||
| Technical | Volume & Bollinger Bands | Analyst | |||
|---|---|---|---|---|---|
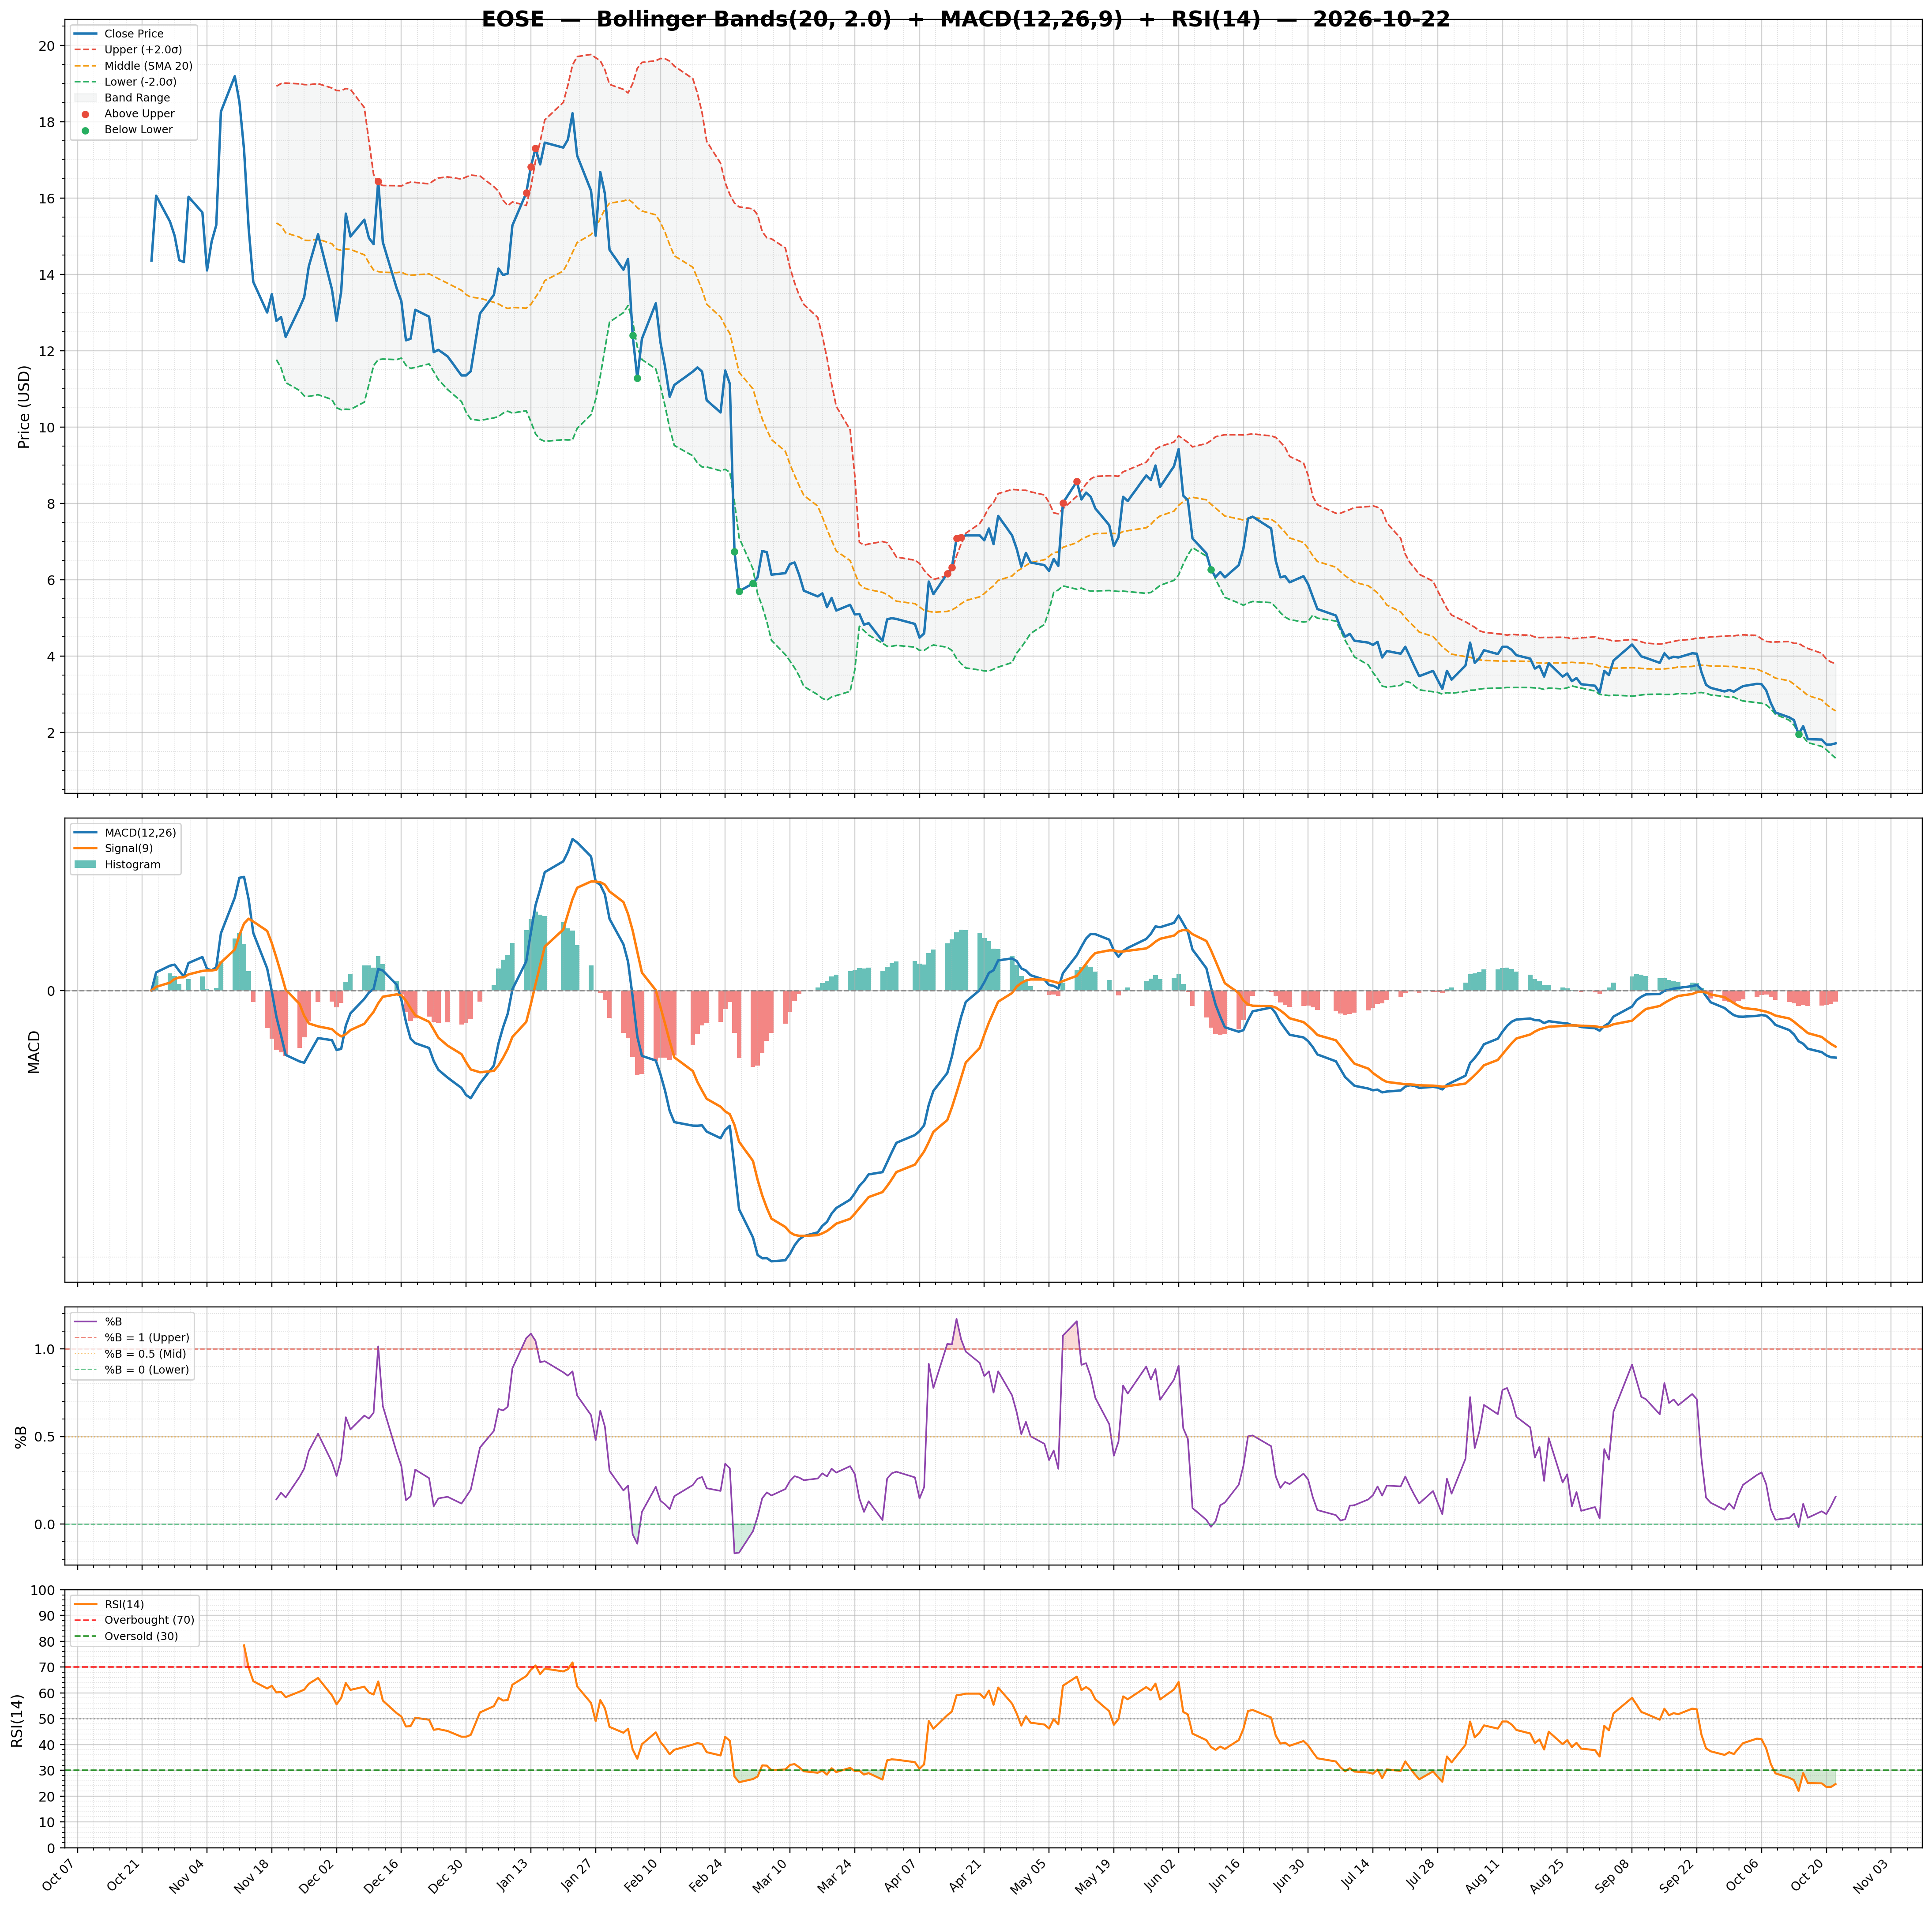
| RSI | 24.68 | Volume | 30.98M | Rating | buy |
| Previous RSI | 23.55 | Avg Volume 20D | 29.14M | Target Mean | $6.50 |
| RSI Trend | Up | Relative Volume | 0.83 | Target High | $10.00 |
| MACD | -0.50 | Lower Band | 1.32 | Target Low | $4.00 |
| MACD Signal | -0.42 | Middle Band | 2.56 | Target Median | $5.00 |
| Histogram | -0.08 | Upper Band | 3.80 | Analysts | 9 |
| Previous Histogram | -0.10 | Bandwidth | 96.670 | Upside | 257.14% |
| Histogram Trend | Increasing | %B | 0.16 | ||