Escalade, Incorporated (ESCA)
Consumer Cyclical • Leisure • $18.89 • MCap: 254,534,704
https://www.escaladeinc.com • Escalade, Incorporated manufactures, distributes, imports, and sells sporting goods in North America, Europe, and internationally. The company provides various sporting goods brands in basketball goals, archery, indoor and outdoor game recreation, and fitness products. It offers archery products under the Bear Archery, Trophy Ridge, Cajun Bowfishing, SIK, and BearX brand names; table tennis products under the STIGA and Ping-Pong brands; basketball goals under the Goalrilla, Goaliath, Silverback, Hoopstar, and Goalsetter brand names; and pickleball under the Onix, and DURA brands. The company provides play systems under the Woodplay and Jack & June brands; fitness products under the STEP, Lifeline, Kettleworx, Natural Fitness, USW, adidas Fitness, and PER4M brand names; safety products under the US Weight brand; hockey and soccer game tables under the Triumph, Atomic, American Legend, Air Hockey, and HJ Scott brands; and billiard tables and accessories under the American Heritage Billiards, Brunswick Billiards, Cue&Case, Lucasi, Mizerak, PureX, Rage, Players, Minnesota Fats, and Mosconi brand names. In addition, it offers darting products under the Unicorn, DMI, Arachnid, and Accudart brands; water sports products under the RAVE Sports brand; and outdoor game products under the Victory Tailgate, Triumph, ACL, and Zume Games brand names. The company provides its products through sporting goods retailers, specialty dealers, online retailers, direct-to-consumer, e-commerce, traditional department stores, and mass merchants. Escalade, Incorporated was founded in 1919 and is headquartered in Evansville, Indiana.
AAII
| Score | Price | 52 Week & Averages | Relative Strength | Risk | |||||
|---|---|---|---|---|---|---|---|---|---|
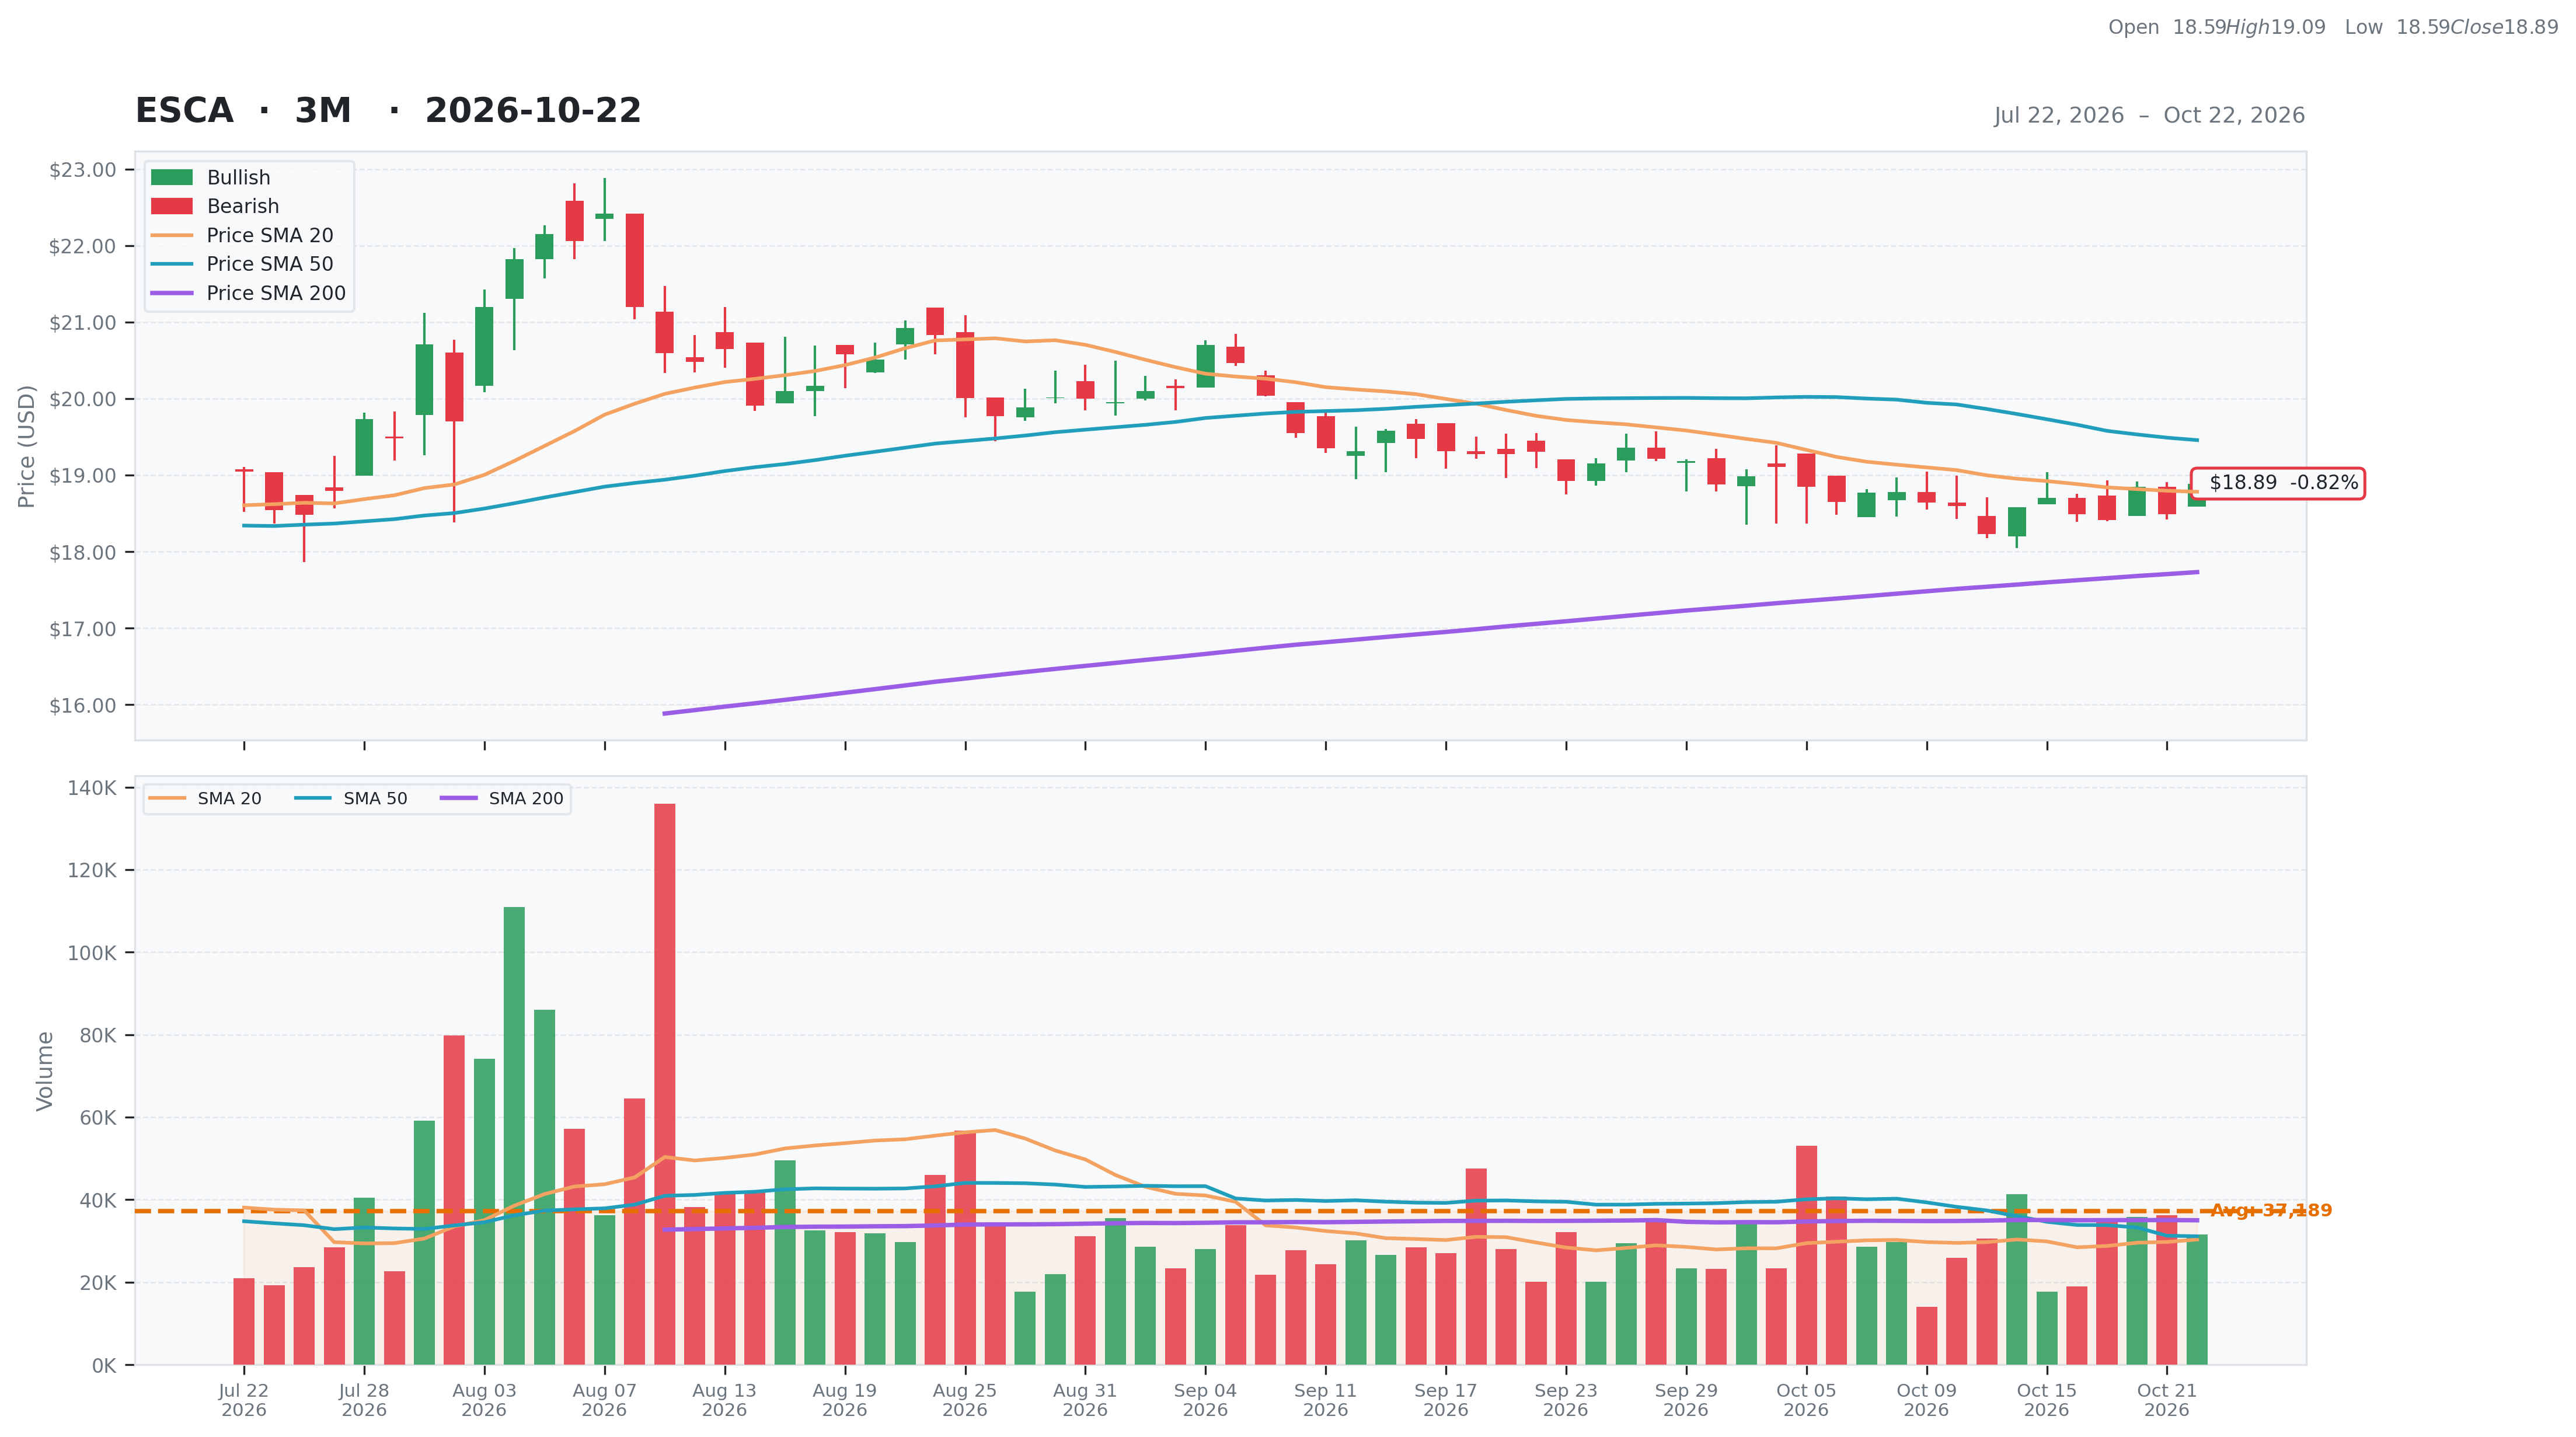
| Total | 75 | Current | $18.89 | 52W High | $22.42 -15.74% | Relative Strength | 0.22 | Beta | 0.53 |
| Business Quality | 14 | Weekly | $18.70 1.02% | 52W Low | $11.01 71.56% | 3M | 0.02 | Short % | 0.03 |
| Financial Strength | 16 | Monthly | $19.30 -2.14% | Above 50DMA | $19.46 -2.92% | 6M | 0.06 | Risk Score | 5 |
| Growth Outlook | 15 | Quarterly | $18.48 2.22% | Above 200DMA | $17.73 6.53% | 9M | 0.34 | ||
| Momentum | 4 | Yearly | $11.28 67.45% | 12M | 0.64 | ||||
| Valuation | Financial Strength | Growth/Profitability | |||
|---|---|---|---|---|---|
| Trailing P/E | 11.07 | Cash | 16M | Revenue Growth | 0.06% |
| Forward P/E | 9.43 | Debt | 16M | Earnings Growth | 4.23% |
| PEG Ratio | 1.05 | Debt/Equity | 8.84 | Qtr Earnings Growth | 4.17% |
| Price/Sales | 1.04 | Current Ratio | 3.21 | Gross Margin | 0.28% |
| Price/Book | 1.39 | Quick Ratio | 1.36 | Operating Margin | 0.21% |
| EV/Revenue | 1.04 | Operating CF | 29M | Profit Margin | 0.09% |
| EV/EBITDA | 7.21 | Free CF | 18M | EBITDA Margin | 0.14% |
| Ent Value | 254M | Return on Assets | 0.08% | ||
| Return on Equity | 0.13% | ||||
| Technical | Volume & Bollinger Bands | Analyst | |||
|---|---|---|---|---|---|
| RSI | 49.28 | Volume | 0.02M | Rating | buy |
| Previous RSI | 42.04 | Avg Volume 20D | 0.03M | Target Mean | $24.00 |
| RSI Trend | Up | Relative Volume | 1.06 | Target High | $24.00 |
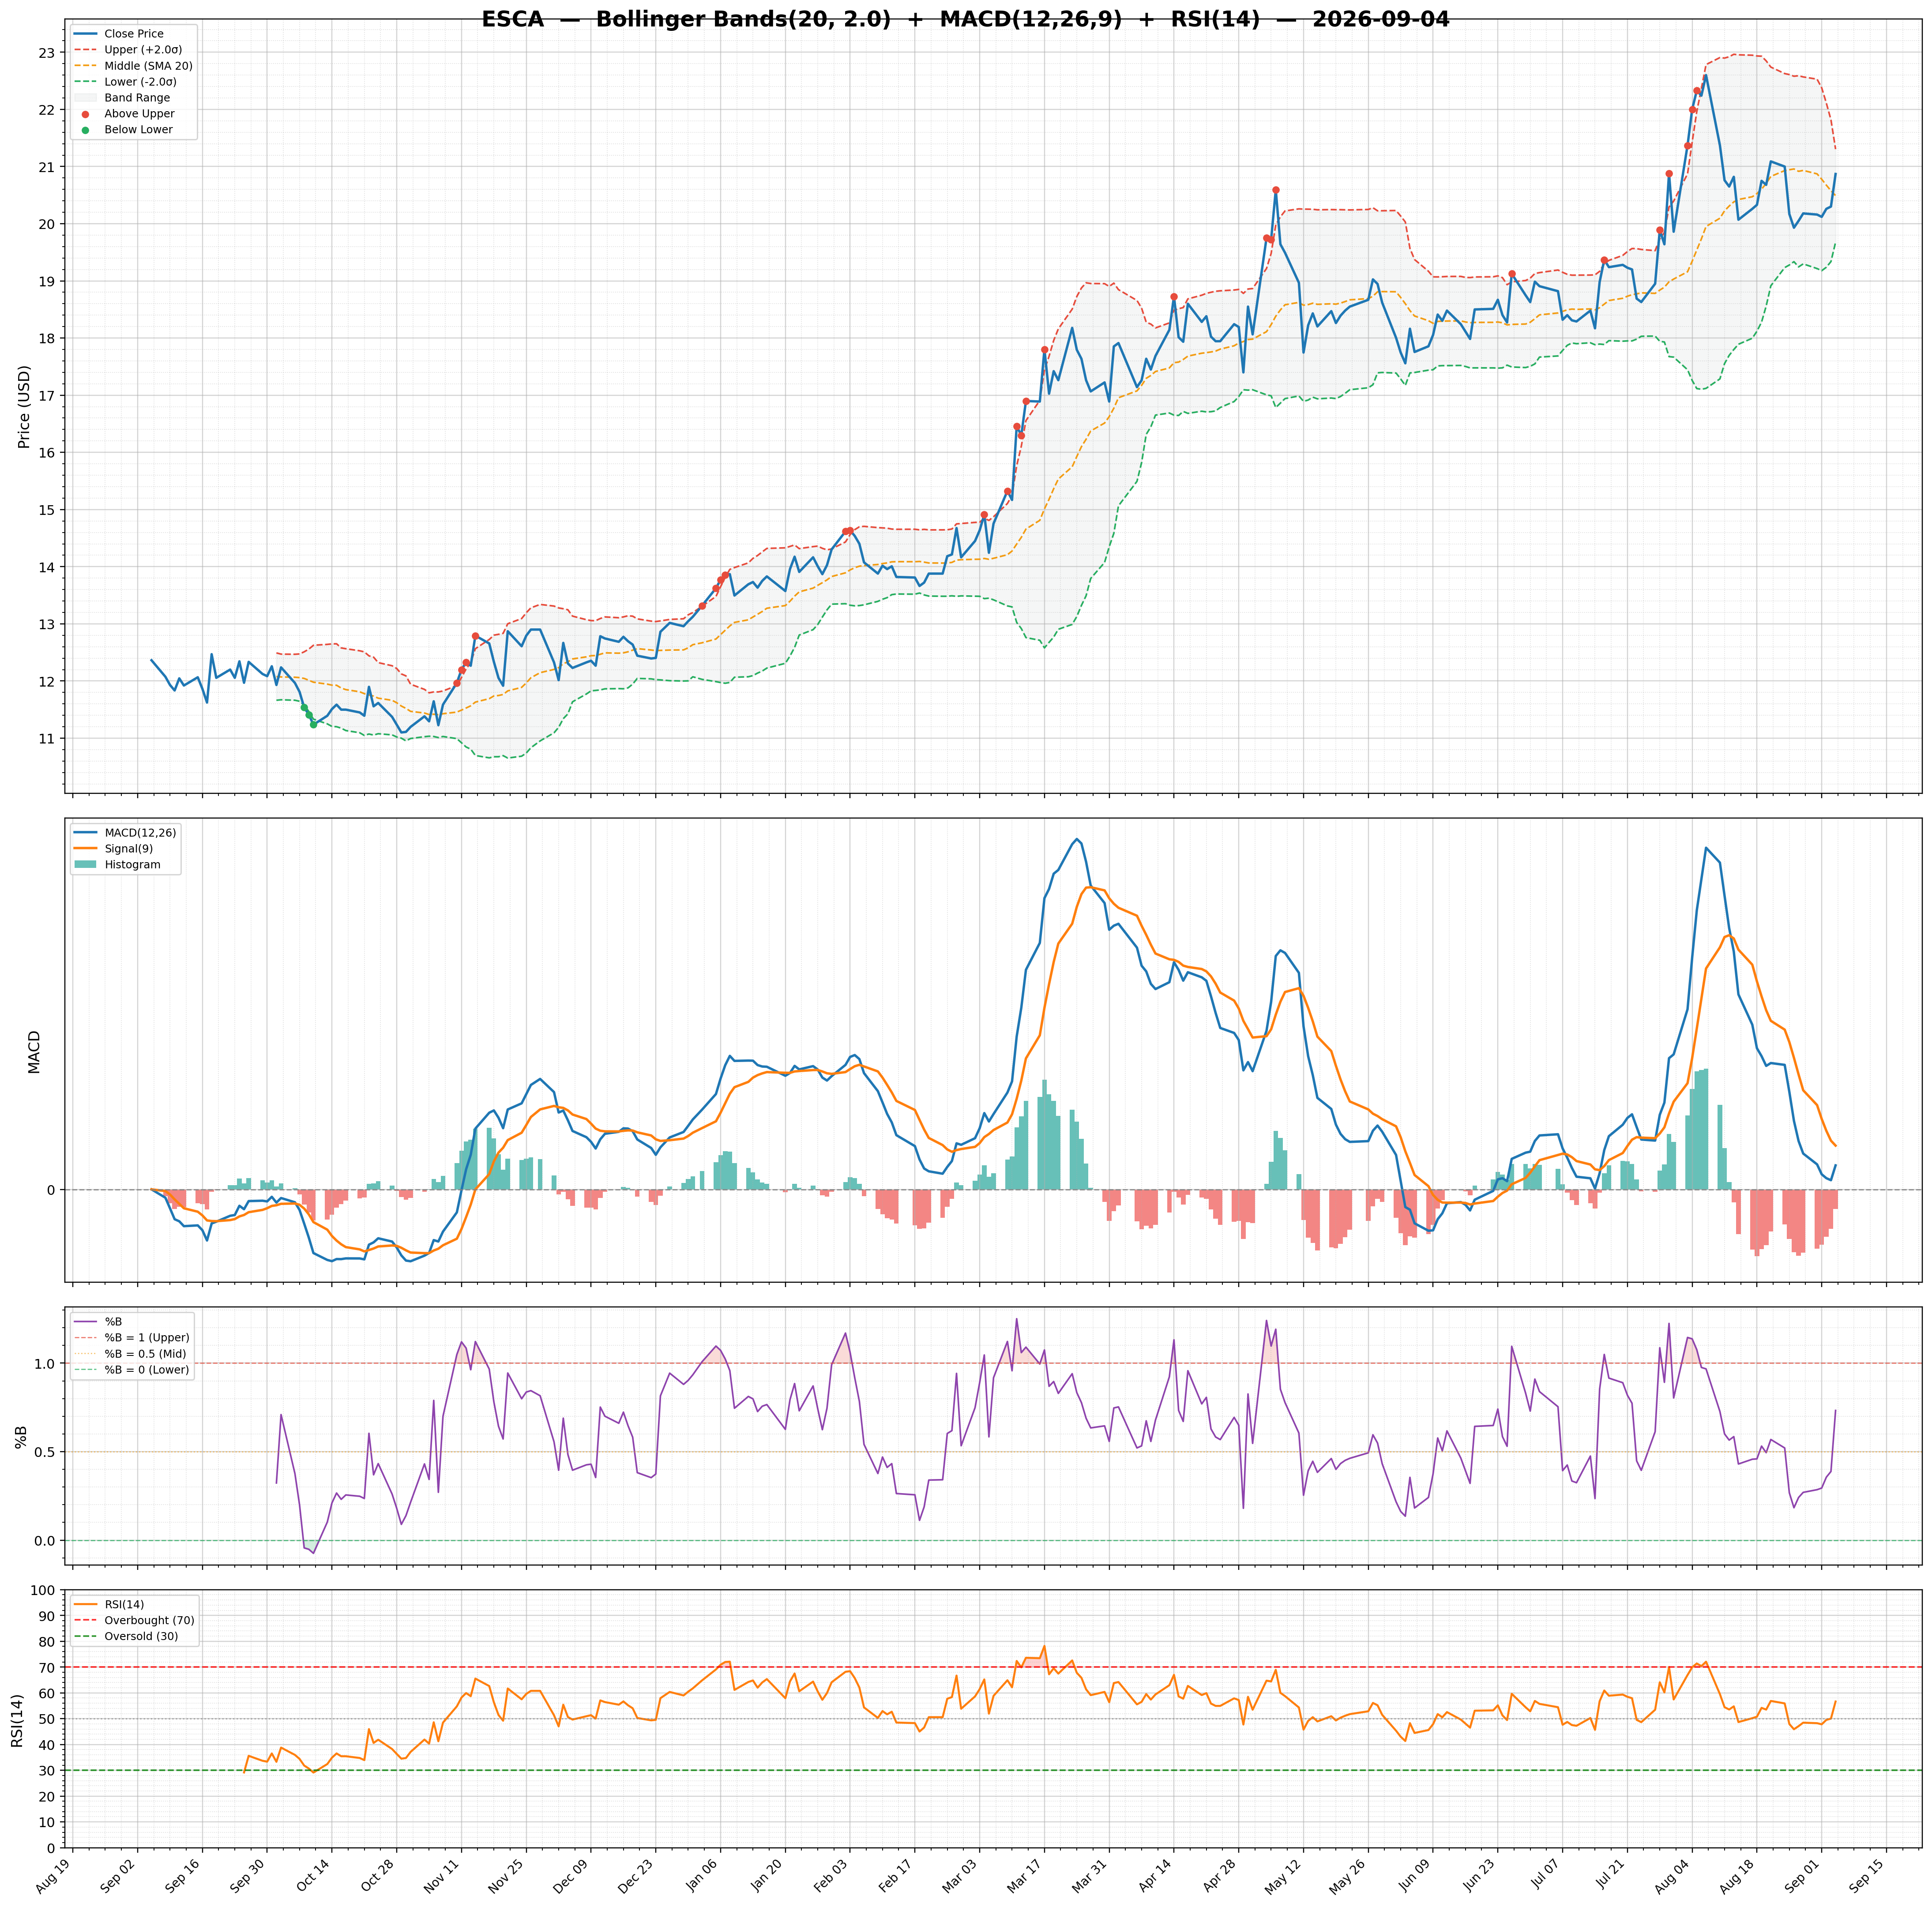
| MACD | -0.22 | Lower Band | 18.20 | Target Low | $24.00 |
| MACD Signal | -0.27 | Middle Band | 18.78 | Target Median | $24.00 |
| Histogram | 0.05 | Upper Band | 19.36 | Analysts | 1 |
| Previous Histogram | 0.02 | Bandwidth | 6.170 | Upside | 29.80% |
| Histogram Trend | Increasing | %B | 0.59 | ||