Euroseas Ltd. (ESEA)
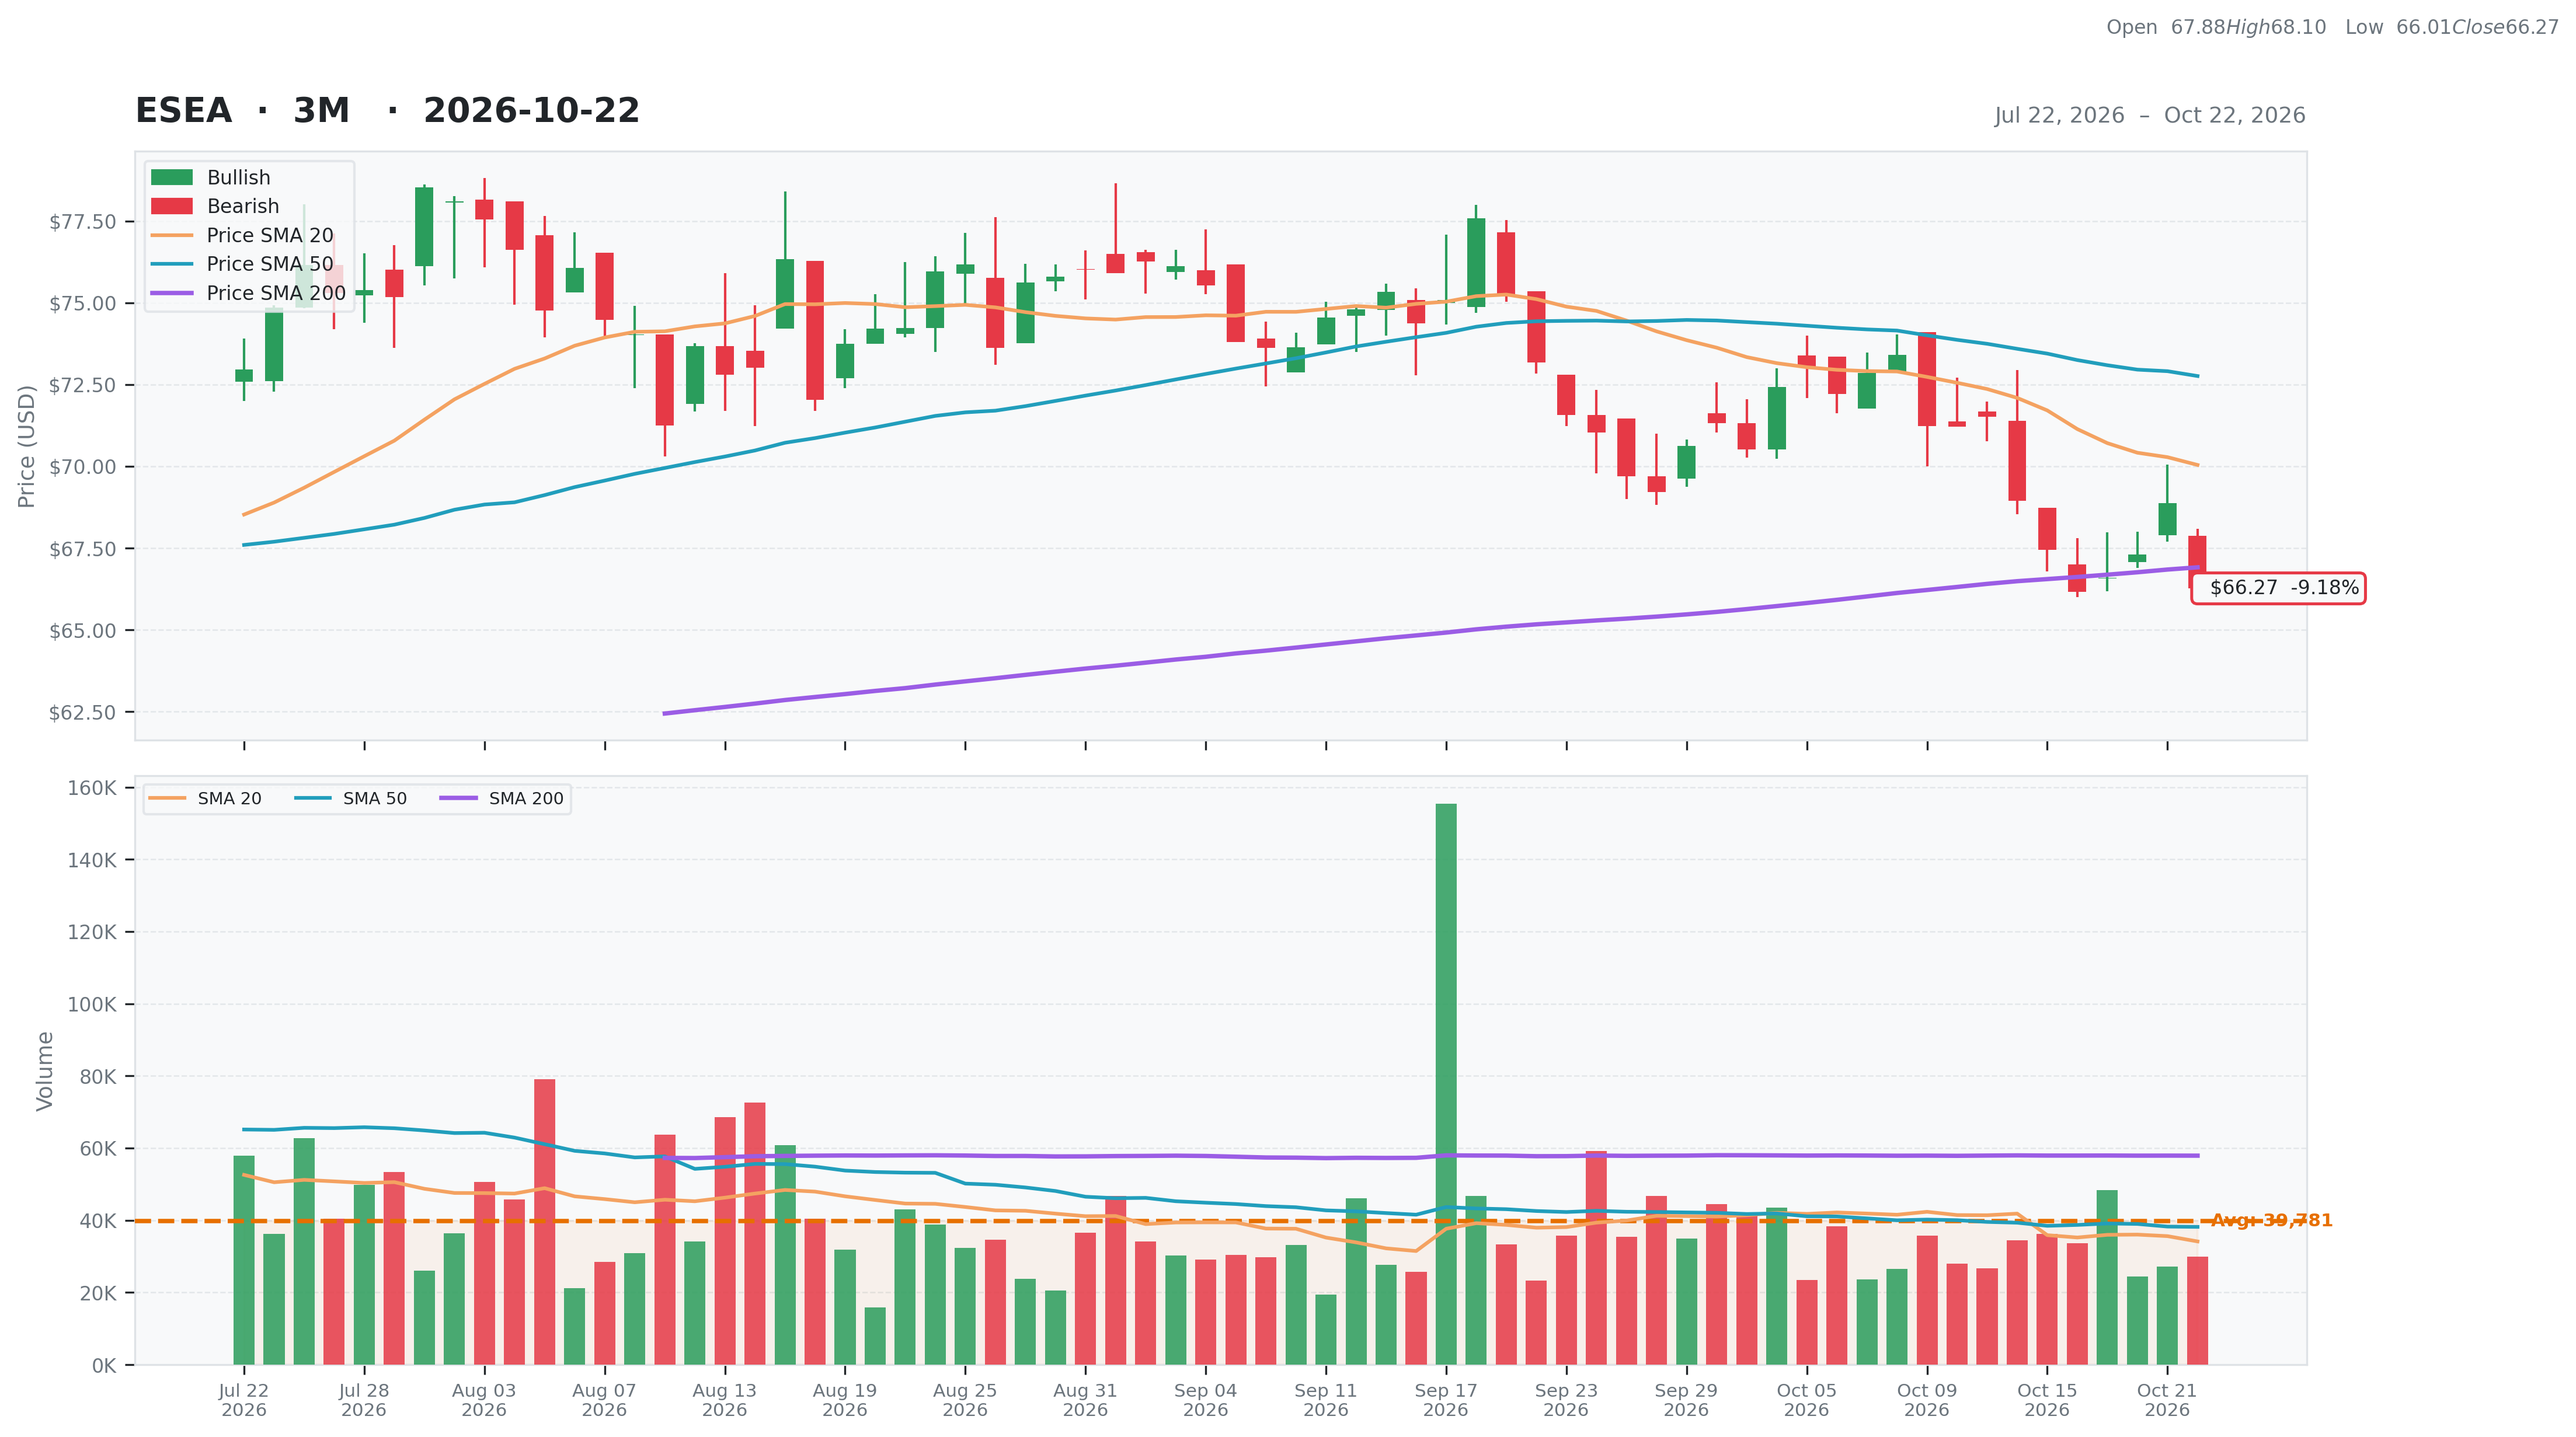
Industrials • Marine Shipping • $66.27 • MCap: 466,854,560
https://www.euroseas.gr • Euroseas Ltd. provides ocean-going transportation services in Greece and internationally. The company owns and operates containerships that transport dry and refrigerated containerized cargoes, including manufactured products and perishables. As of April 15, 2026, it had a fleet of 21 containerships, including 15 Feeder containerships and 6 Intermediate containerships with a cargo of 61,144 TEU. Euroseas Ltd. is based in Marousi, Greece.
AAII
| Score | Price | 52 Week & Averages | Relative Strength | Risk | |||||
|---|---|---|---|---|---|---|---|---|---|
| Total | 70 | Current | $66.27 | 52W High | $78.54 -15.62% | Relative Strength | 0.05 | Beta | 0.77 |
| Business Quality | 25 | Weekly | $67.45 -1.75% | 52W Low | $50.74 30.61% | 3M | -0.13 | Short % | 0.01 |
| Financial Strength | 14 | Monthly | $73.18 -9.44% | Above 50DMA | $72.76 -8.92% | 6M | -0.01 | Risk Score | |
| Growth Outlook | 5 | Quarterly | $76.16 -12.99% | Above 200DMA | $66.91 -0.96% | 9M | 0.28 | ||
| Momentum | 3 | Yearly | $52.46 26.32% | 12M | 0.25 | ||||
| Valuation | Financial Strength | Growth/Profitability | |||
|---|---|---|---|---|---|
| Trailing P/E | 3.39 | Cash | 196M | Revenue Growth | -0.01% |
| Forward P/E | 4.30 | Debt | 207M | Earnings Growth | 0.10% |
| PEG Ratio | 6.02 | Debt/Equity | 39.42 | Qtr Earnings Growth | 0.11% |
| Price/Sales | 2.06 | Current Ratio | 5.46 | Gross Margin | 0.78% |
| Price/Book | 0.90 | Quick Ratio | 5.34 | Operating Margin | 0.59% |
| EV/Revenue | 2.13 | Operating CF | 148M | Profit Margin | 0.60% |
| EV/EBITDA | 3.00 | Free CF | 77M | EBITDA Margin | 0.71% |
| Ent Value | 482M | Return on Assets | 0.12% | ||
| Return on Equity | 0.29% | ||||
| Technical | Volume & Bollinger Bands | Analyst | |||
|---|---|---|---|---|---|
| RSI | 36.40 | Volume | 0.03M | Rating | none |
| Previous RSI | 43.12 | Avg Volume 20D | 0.03M | Target Mean | $90.00 |
| RSI Trend | Down | Relative Volume | 0.78 | Target High | $93.00 |
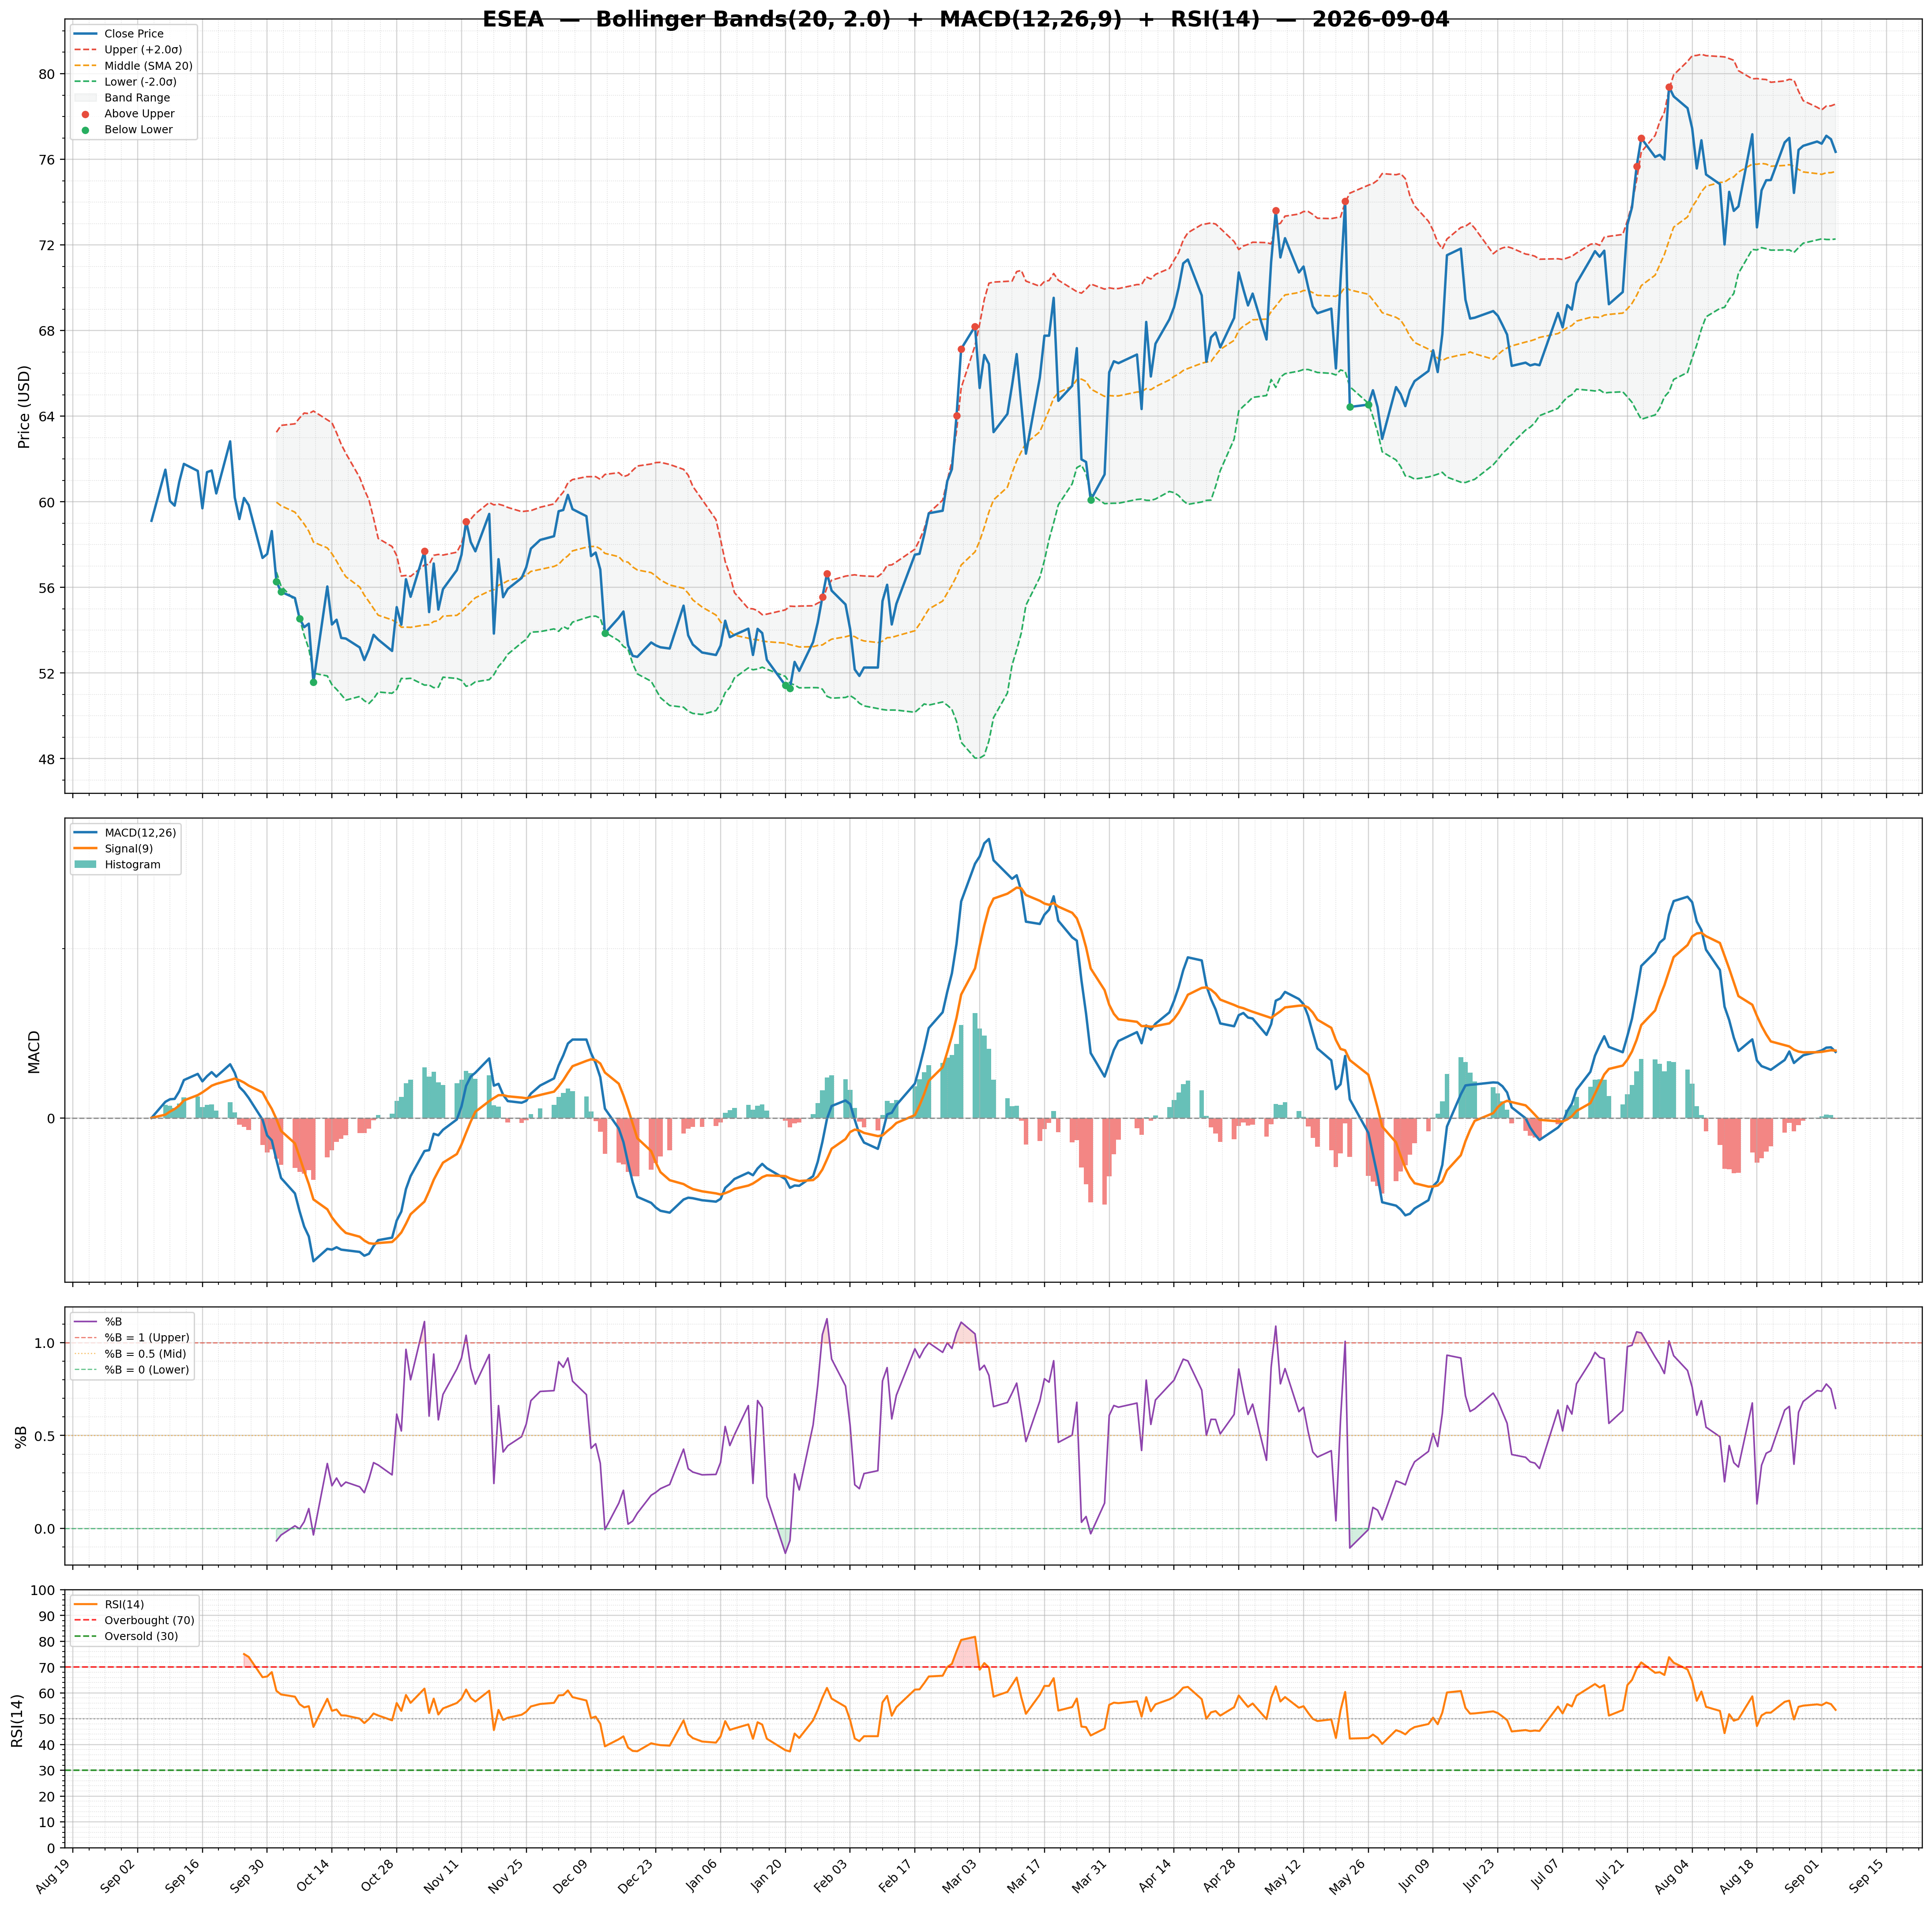
| MACD | -1.65 | Lower Band | 65.35 | Target Low | $85.00 |
| MACD Signal | -1.29 | Middle Band | 70.04 | Target Median | $91.00 |
| Histogram | -0.36 | Upper Band | 74.74 | Analysts | 4 |
| Previous Histogram | -0.33 | Bandwidth | 13.390 | Upside | 36.01% |
| Histogram Trend | Decreasing | %B | 0.10 | ||