FTAI Infrastructure Inc. (FIP)
Industrials • Conglomerates • $2.52 • MCap: 285,999,808
https://www.fipinc.com • FTAI Infrastructure Inc. engages in acquiring, developing, and operating assets and businesses that represent infrastructure for customers in the transportation, energy, and industrial products industries in North America. It operates through four segments: Railroad, Ports and Terminals, Power and Gas, and Sustainability and Energy Transition. The company operates a multi-modal crude oil and refined products terminal, and other related assets; and Jefferson Terminal and Repauno that develops or acquires industrial properties in strategic locations that store and handle for third parties various energy products, including crude oil, refined products, and clean fuels. It also has a 1,630-acre deep-water port located along the Delaware River with an underground storage cavern, a multipurpose dock, a rail-to-ship transloading system, and multiple industrial development opportunities; and a 1,660-acre multi-modal port located along the Ohio River with rail, dock, and multiple industrial development opportunities, including a power plant. In addition, the company owns and operates eight freight railroads and one switching company that provides rail service to certain manufacturing and production facilities. Further, it focuses on waste plastic to renewable fuel, hydrogen-fueled power plant, and carbon capture businesses. FTAI Infrastructure Inc. was incorporated in 2021 and is headquartered in New York, New York.
Watch List
| Score | Price | 52 Week & Averages | Relative Strength | Risk | |||||
|---|---|---|---|---|---|---|---|---|---|
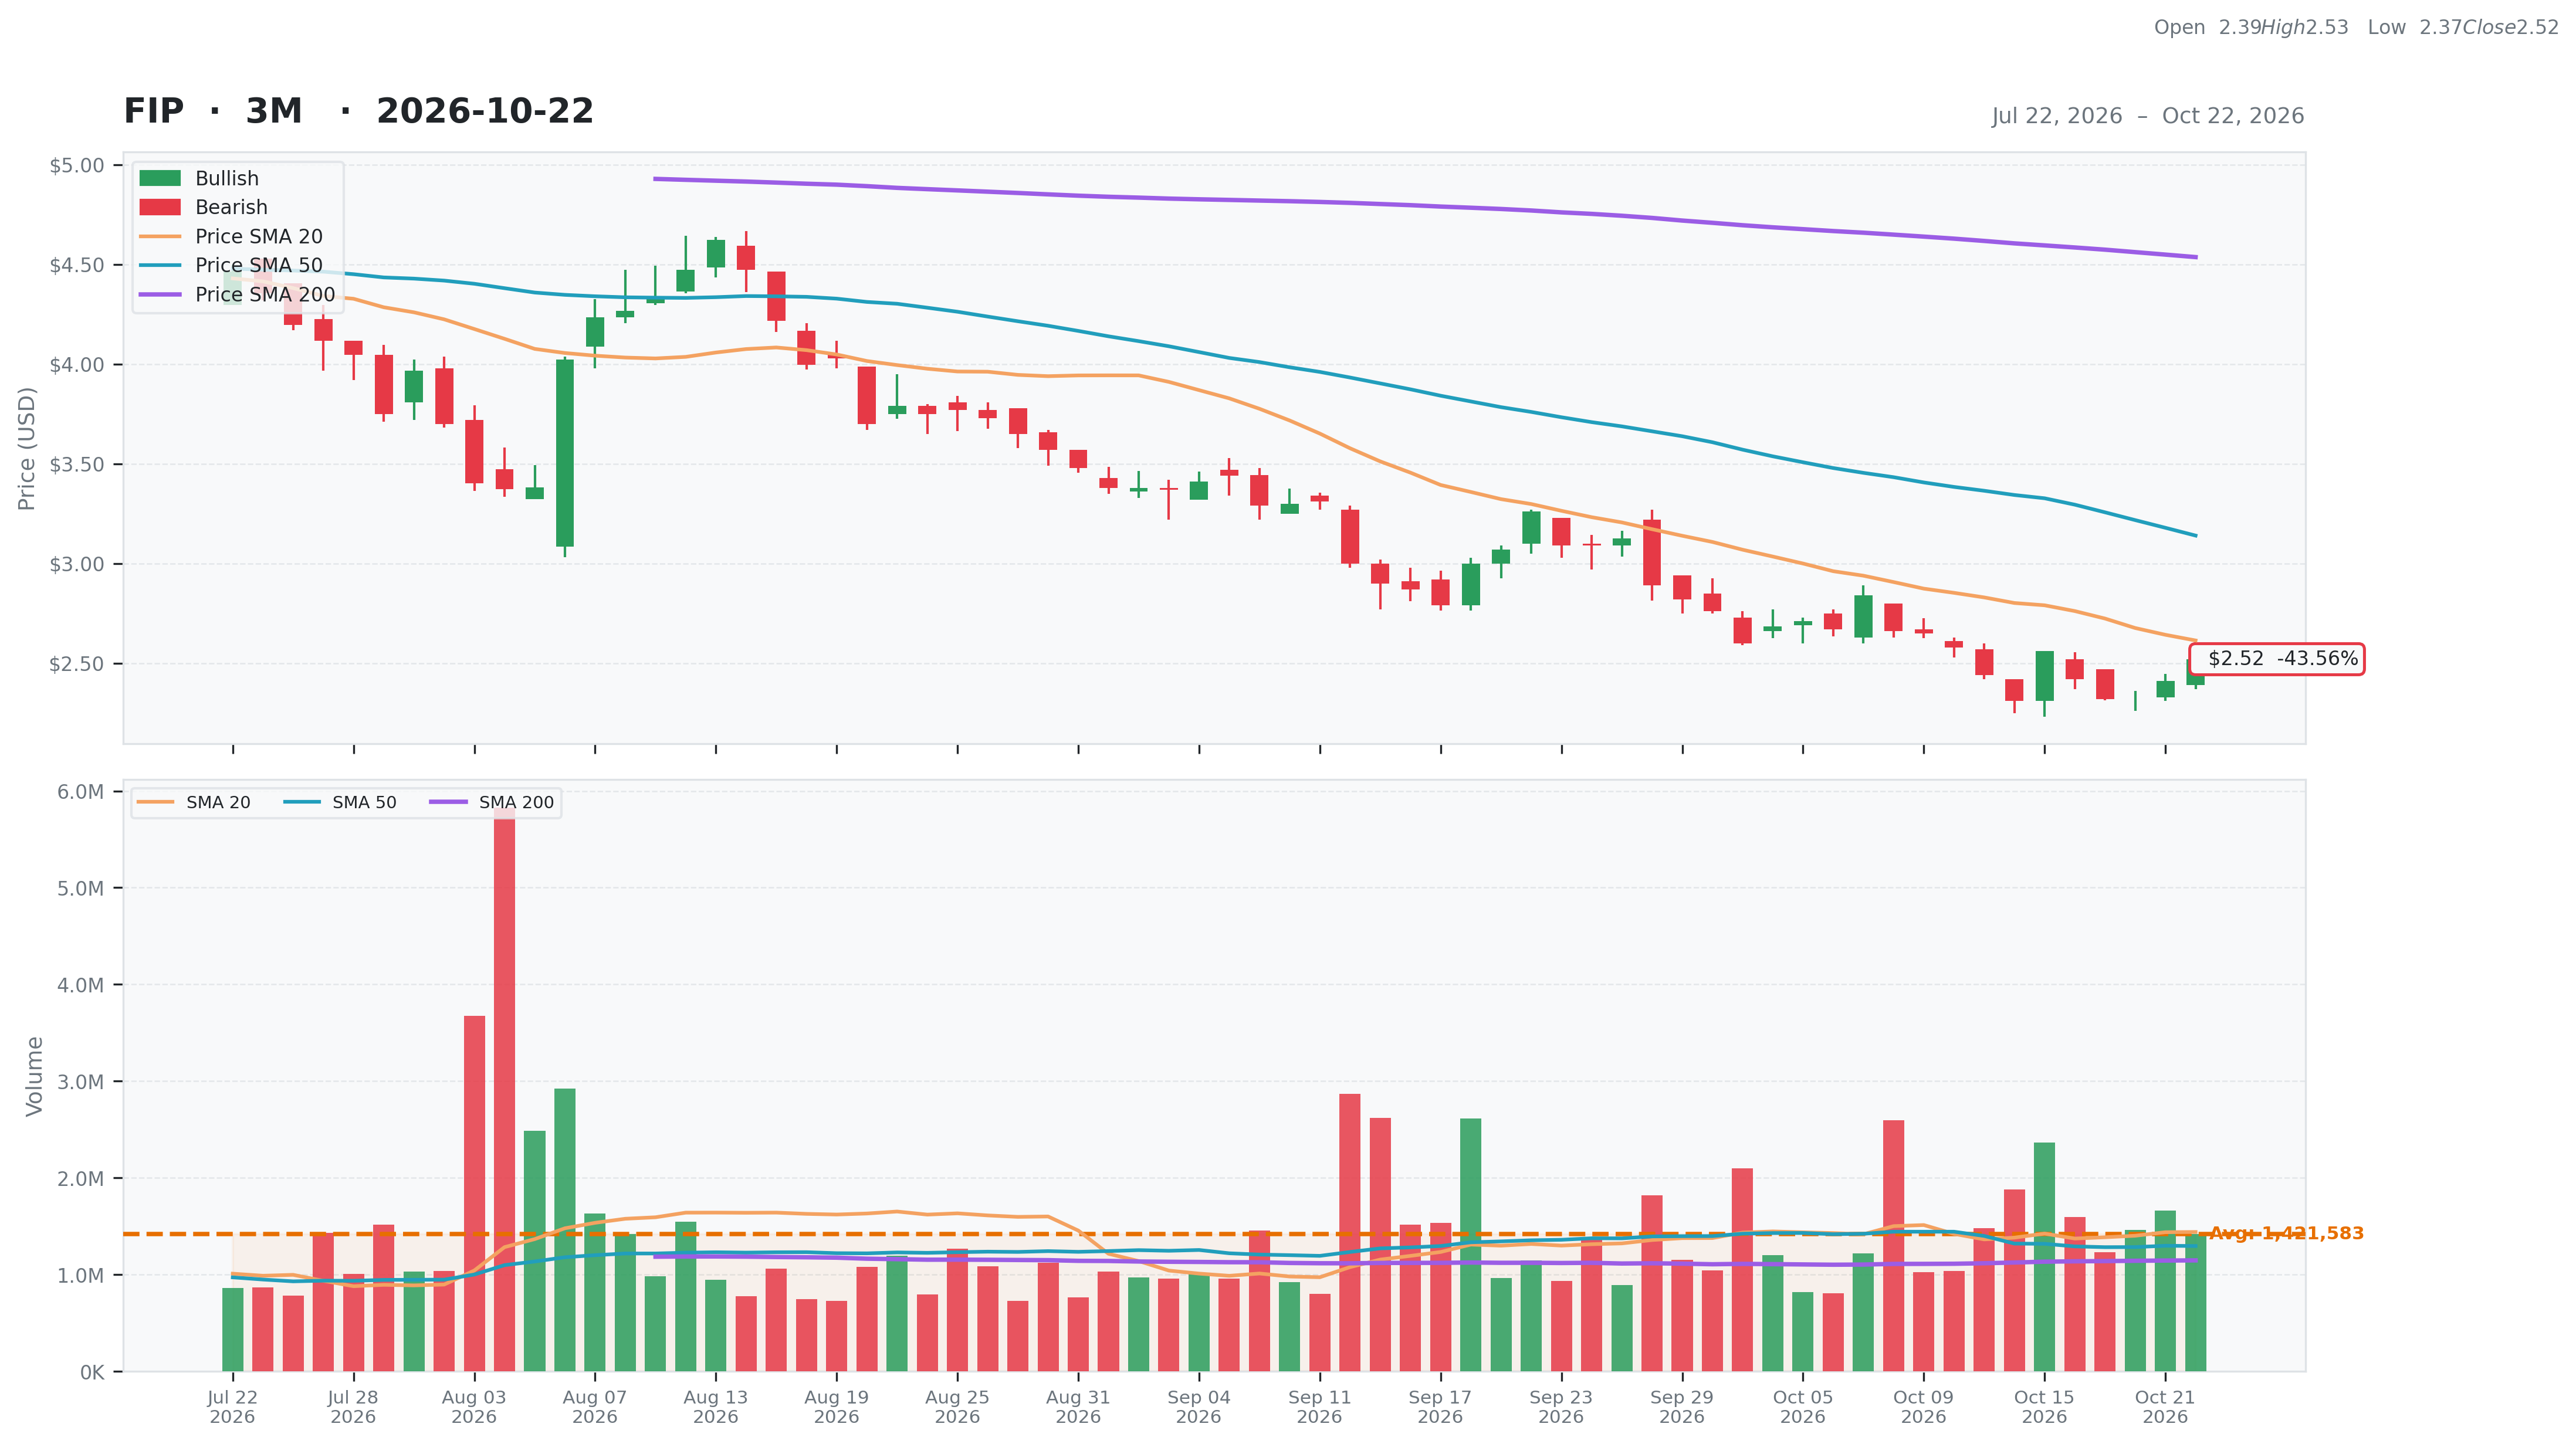
| Total | 40 | Current | $2.52 | 52W High | $6.31 -60.07% | Relative Strength | -0.49 | Beta | 1.93 |
| Business Quality | 12 | Weekly | $2.56 -1.56% | 52W Low | $2.31 9.09% | 3M | -0.40 | Short % | 0.26 |
| Financial Strength | 9 | Monthly | $3.26 -22.70% | Above 50DMA | $3.14 -19.75% | 6M | -0.54 | Risk Score | 10 |
| Growth Outlook | 1 | Quarterly | $4.20 -39.95% | Above 200DMA | $4.54 -44.46% | 9M | -0.59 | ||
| Momentum | 2 | Yearly | $5.33 -52.75% | 12M | -0.54 | ||||
| Valuation | Financial Strength | Growth/Profitability | |||
|---|---|---|---|---|---|
| Trailing P/E | N/A | Cash | 33M | Revenue Growth | 0.53% |
| Forward P/E | -1.83 | Debt | 2,893M | Earnings Growth | N/A |
| PEG Ratio | N/A | Debt/Equity | 453.17 | Qtr Earnings Growth | N/A |
| Price/Sales | 0.43 | Current Ratio | 0.28 | Gross Margin | 0.40% |
| Price/Book | -0.87 | Quick Ratio | 0.10 | Operating Margin | 0.12% |
| EV/Revenue | 6.24 | Operating CF | -57M | Profit Margin | -0.83% |
| EV/EBITDA | 18.15 | Free CF | 565M | EBITDA Margin | 0.34% |
| Ent Value | 4,114M | Return on Assets | 0.01% | ||
| Return on Equity | -0.84% | ||||
| Technical | Volume & Bollinger Bands | Analyst | |||
|---|---|---|---|---|---|
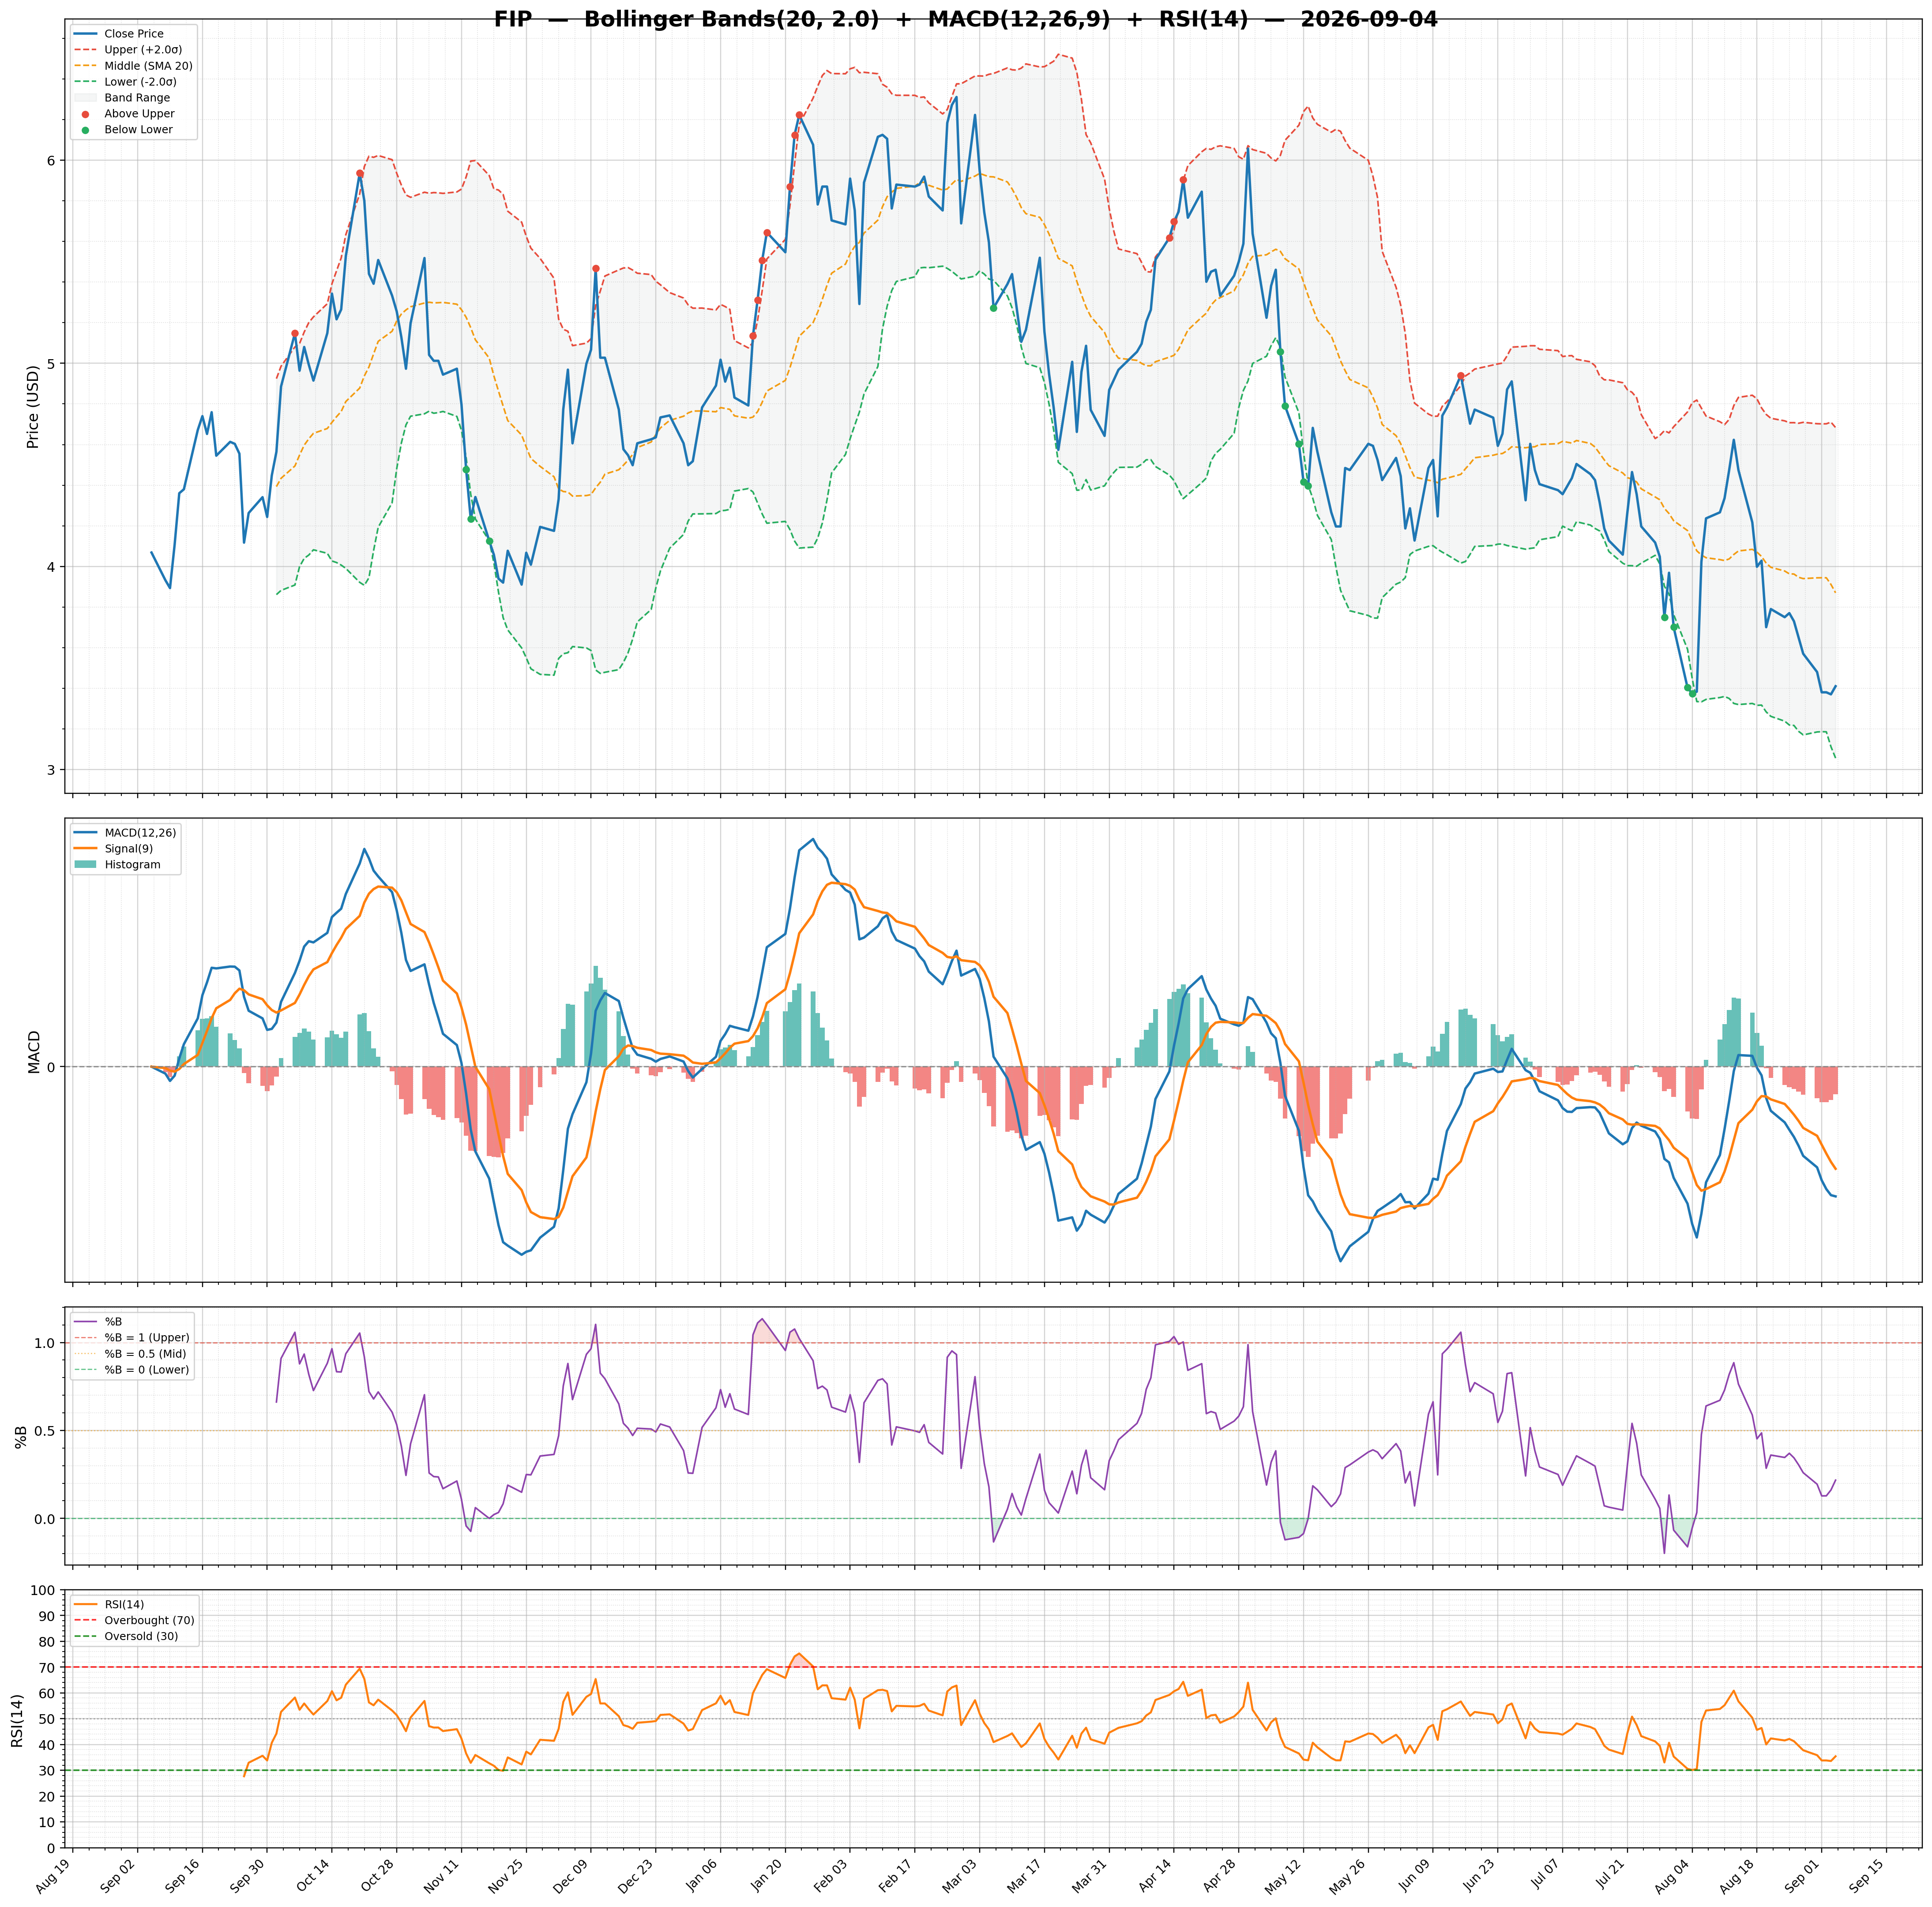
| RSI | 42.44 | Volume | 1.59M | Rating | strong_buy |
| Previous RSI | 37.86 | Avg Volume 20D | 1.44M | Target Mean | $9.94 |
| RSI Trend | Up | Relative Volume | 0.94 | Target High | $12.00 |
| MACD | -0.21 | Lower Band | 2.19 | Target Low | $8.75 |
| MACD Signal | -0.22 | Middle Band | 2.61 | Target Median | $9.50 |
| Histogram | 0.02 | Upper Band | 3.04 | Analysts | 4 |
| Previous Histogram | 0.00 | Bandwidth | 32.680 | Upside | 310.64% |
| Histogram Trend | Increasing | %B | 0.39 | ||