Floor & Decor Holdings, Inc. (FND)
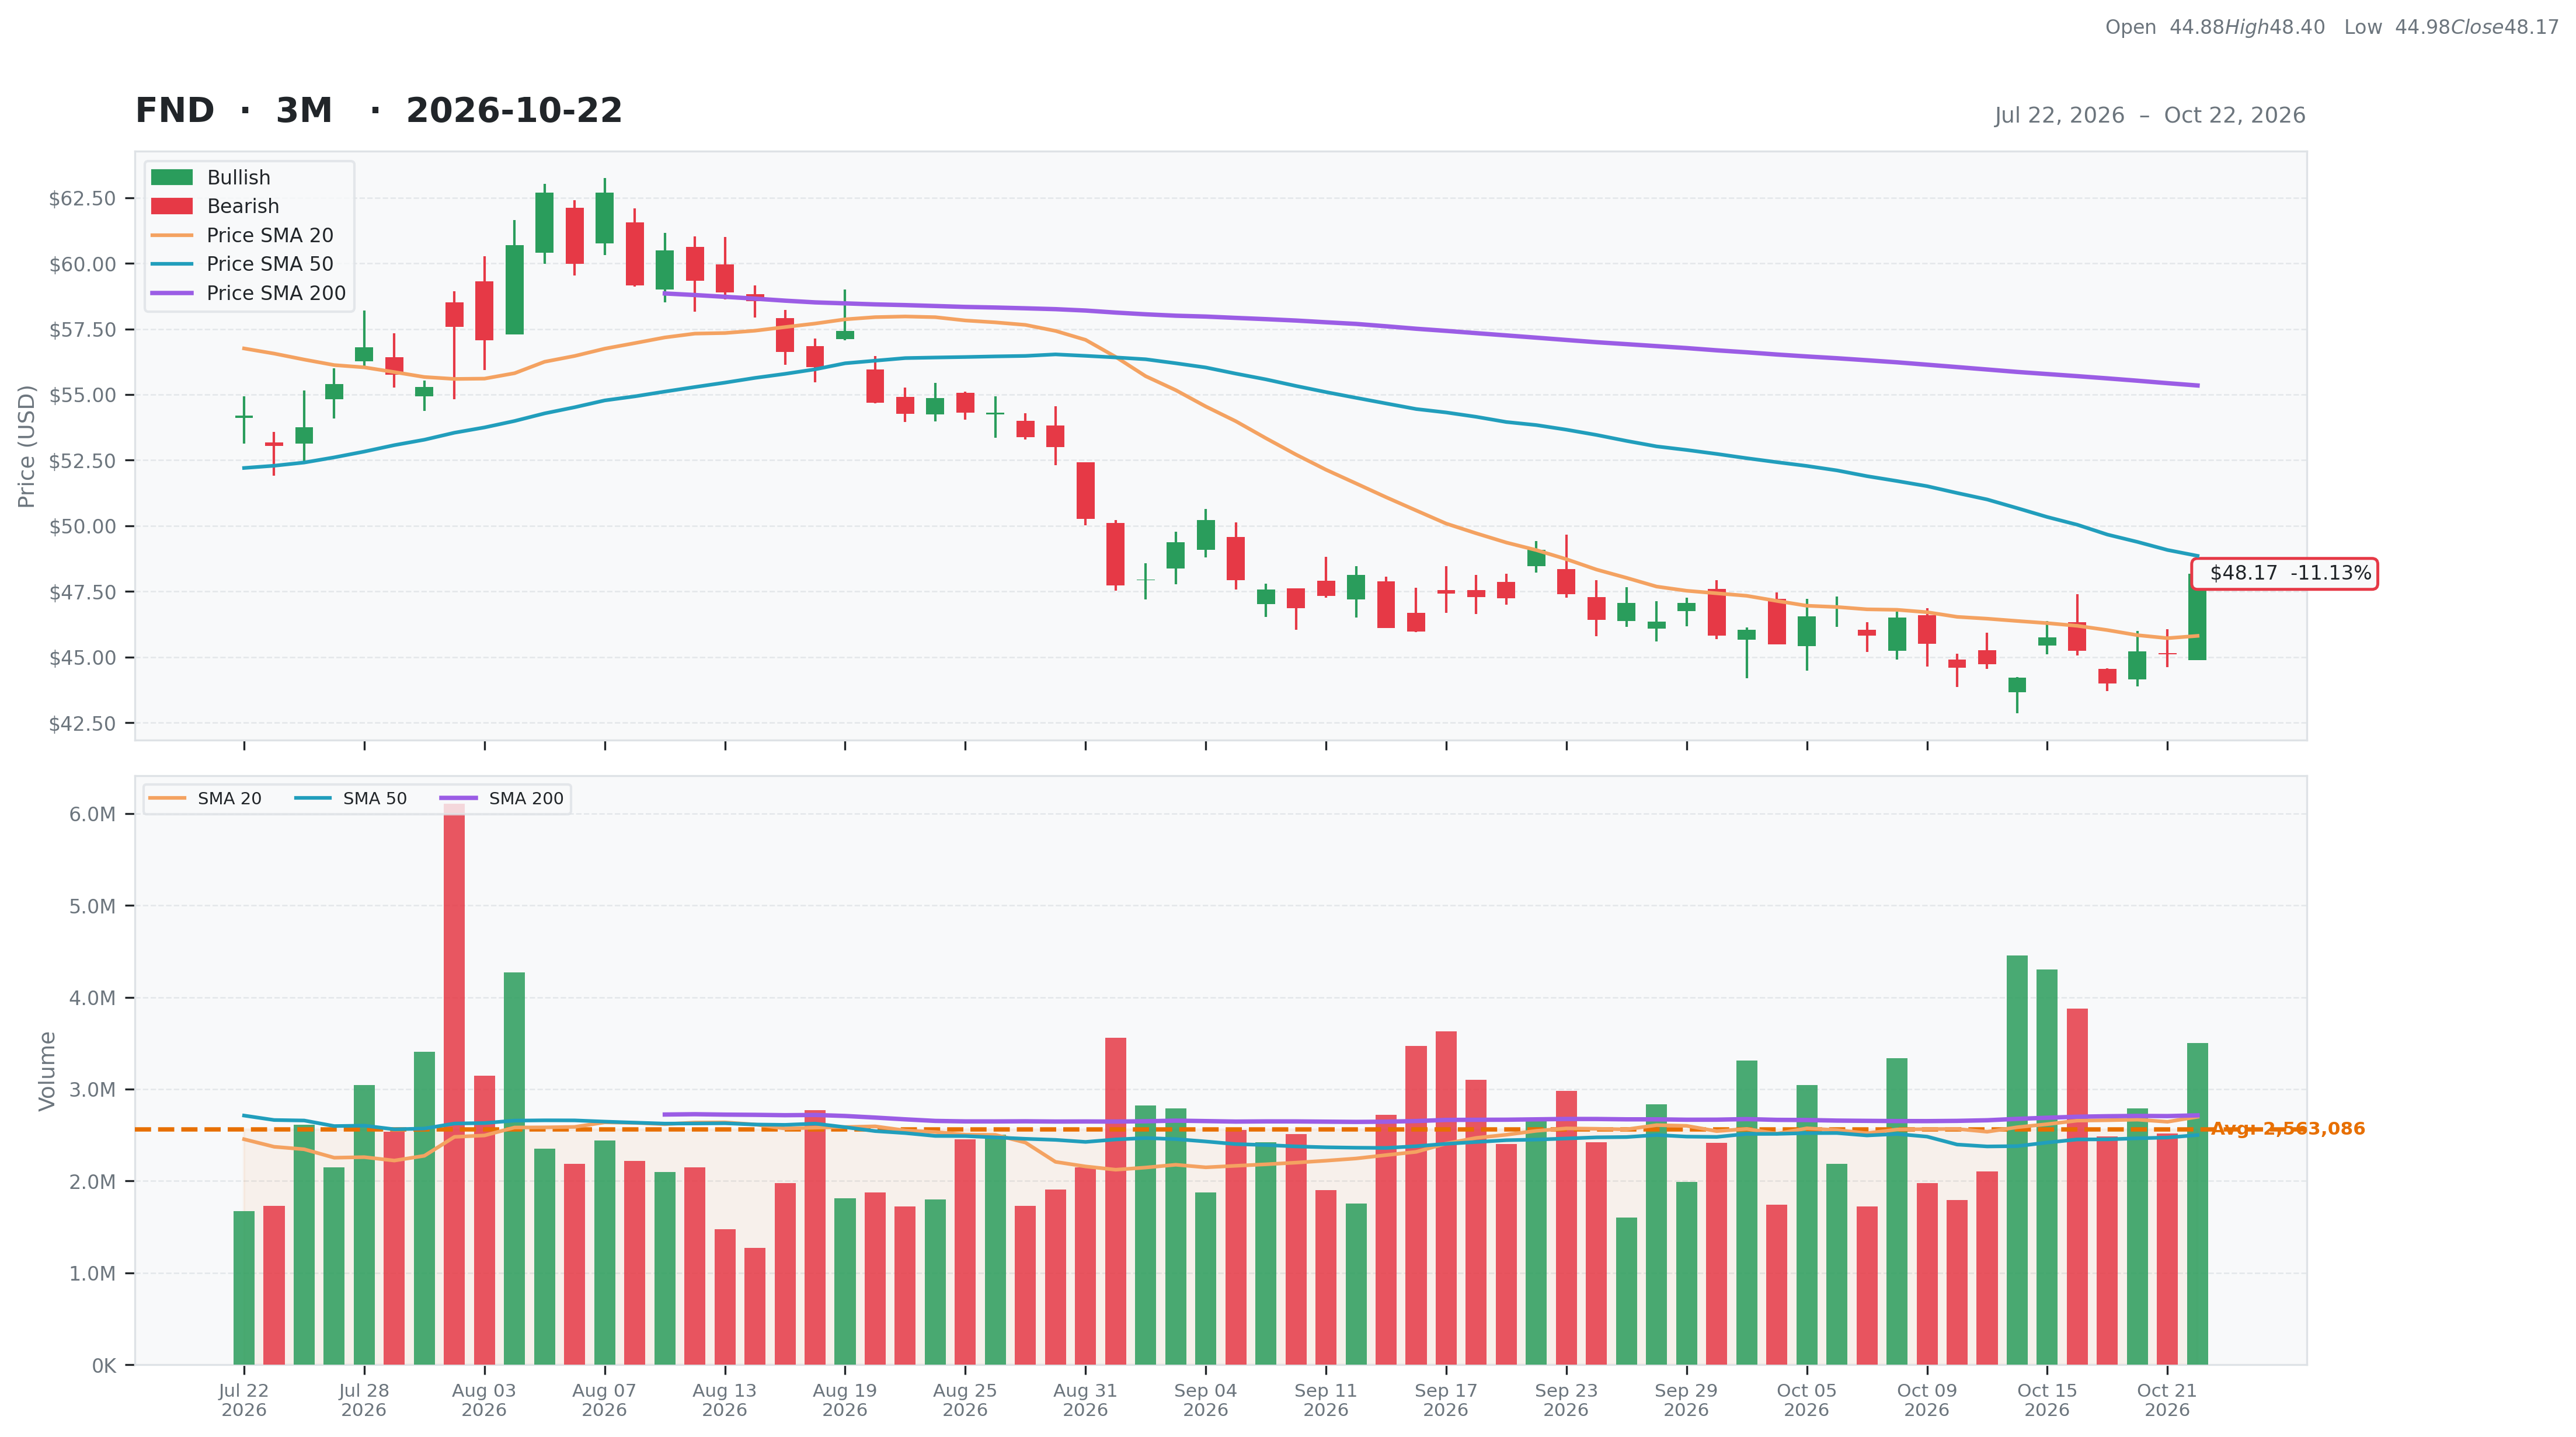
Consumer Cyclical • Home Improvement Retail • $48.17 • MCap: 4,818,671,104
https://www.flooranddecor.com • Floor & Decor Holdings, Inc., together with its subsidiaries, operates as a multi-channel specialty retailer of hard surface flooring and related accessories, and commercial surfaces seller in the United States. The company offers wood-based laminate flooring, vinyl, and engineered/composite rigid core vinyl; porcelain and ceramic tile, porcelain mosaics and tile slabs; grout, mortar, backer board, tools, adhesives, underlayments, moldings, and stair treads; and decorative tiles and mosaics, such as natural stone, porcelain, ceramic, glass, wall tile, and decorative trims. The company also provides solid prefinished and unfinished hardwood, engineered hardwood, bamboo, and wood countertops; marble, limestone, travertine, slate, ledger; and vanities, shower doors, bath accessories, faucets, sinks, custom countertops, bathroom mirrors, bathroom lighting, and kitchen cabinets. It sells products through its warehouse-format stores and five small-format design studios, as well as through Website, FloorandDecor.com. The company serves professional installers, commercial businesses, and homeowners. The company was formerly known as FDO Holdings, Inc. and changed its name to Floor & Decor Holdings, Inc. in April 2017. Floor & Decor Holdings, Inc. was founded in 2000 and is headquartered in Atlanta, Georgia.
Watch List
| Score | Price | 52 Week & Averages | Relative Strength | Risk | |||||
|---|---|---|---|---|---|---|---|---|---|
| Total | 48 | Current | $48.17 | 52W High | $76.65 -37.16% | Relative Strength | -0.19 | Beta | 1.60 |
| Business Quality | 9 | Weekly | $45.76 5.27% | 52W Low | $43.49 10.76% | 3M | -0.10 | Short % | 0.13 |
| Financial Strength | 7 | Monthly | $49.09 -1.87% | Above 50DMA | $48.86 -1.41% | 6M | -0.05 | Risk Score | 2 |
| Growth Outlook | 12 | Quarterly | $53.75 -10.38% | Above 200DMA | $55.35 -12.97% | 9M | -0.37 | ||
| Momentum | 2 | Yearly | $72.60 -33.65% | 12M | -0.34 | ||||
| Valuation | Financial Strength | Growth/Profitability | |||
|---|---|---|---|---|---|
| Trailing P/E | 21.14 | Cash | 321M | Revenue Growth | 0.03% |
| Forward P/E | 20.72 | Debt | 2,013M | Earnings Growth | 0.53% |
| PEG Ratio | N/A | Debt/Equity | 80.64 | Qtr Earnings Growth | 0.52% |
| Price/Sales | 1.02 | Current Ratio | 1.33 | Gross Margin | 0.45% |
| Price/Book | 1.94 | Quick Ratio | 0.41 | Operating Margin | 0.05% |
| EV/Revenue | 1.38 | Operating CF | 505M | Profit Margin | 0.05% |
| EV/EBITDA | 13.28 | Free CF | 140M | EBITDA Margin | 0.10% |
| Ent Value | 6,511M | Return on Assets | 0.03% | ||
| Return on Equity | 0.10% | ||||
| Technical | Volume & Bollinger Bands | Analyst | |||
|---|---|---|---|---|---|
| RSI | 55.87 | Volume | 3.88M | Rating | hold |
| Previous RSI | 43.73 | Avg Volume 20D | 2.7M | Target Mean | $58.14 |
| RSI Trend | Up | Relative Volume | 1.30 | Target High | $75.00 |
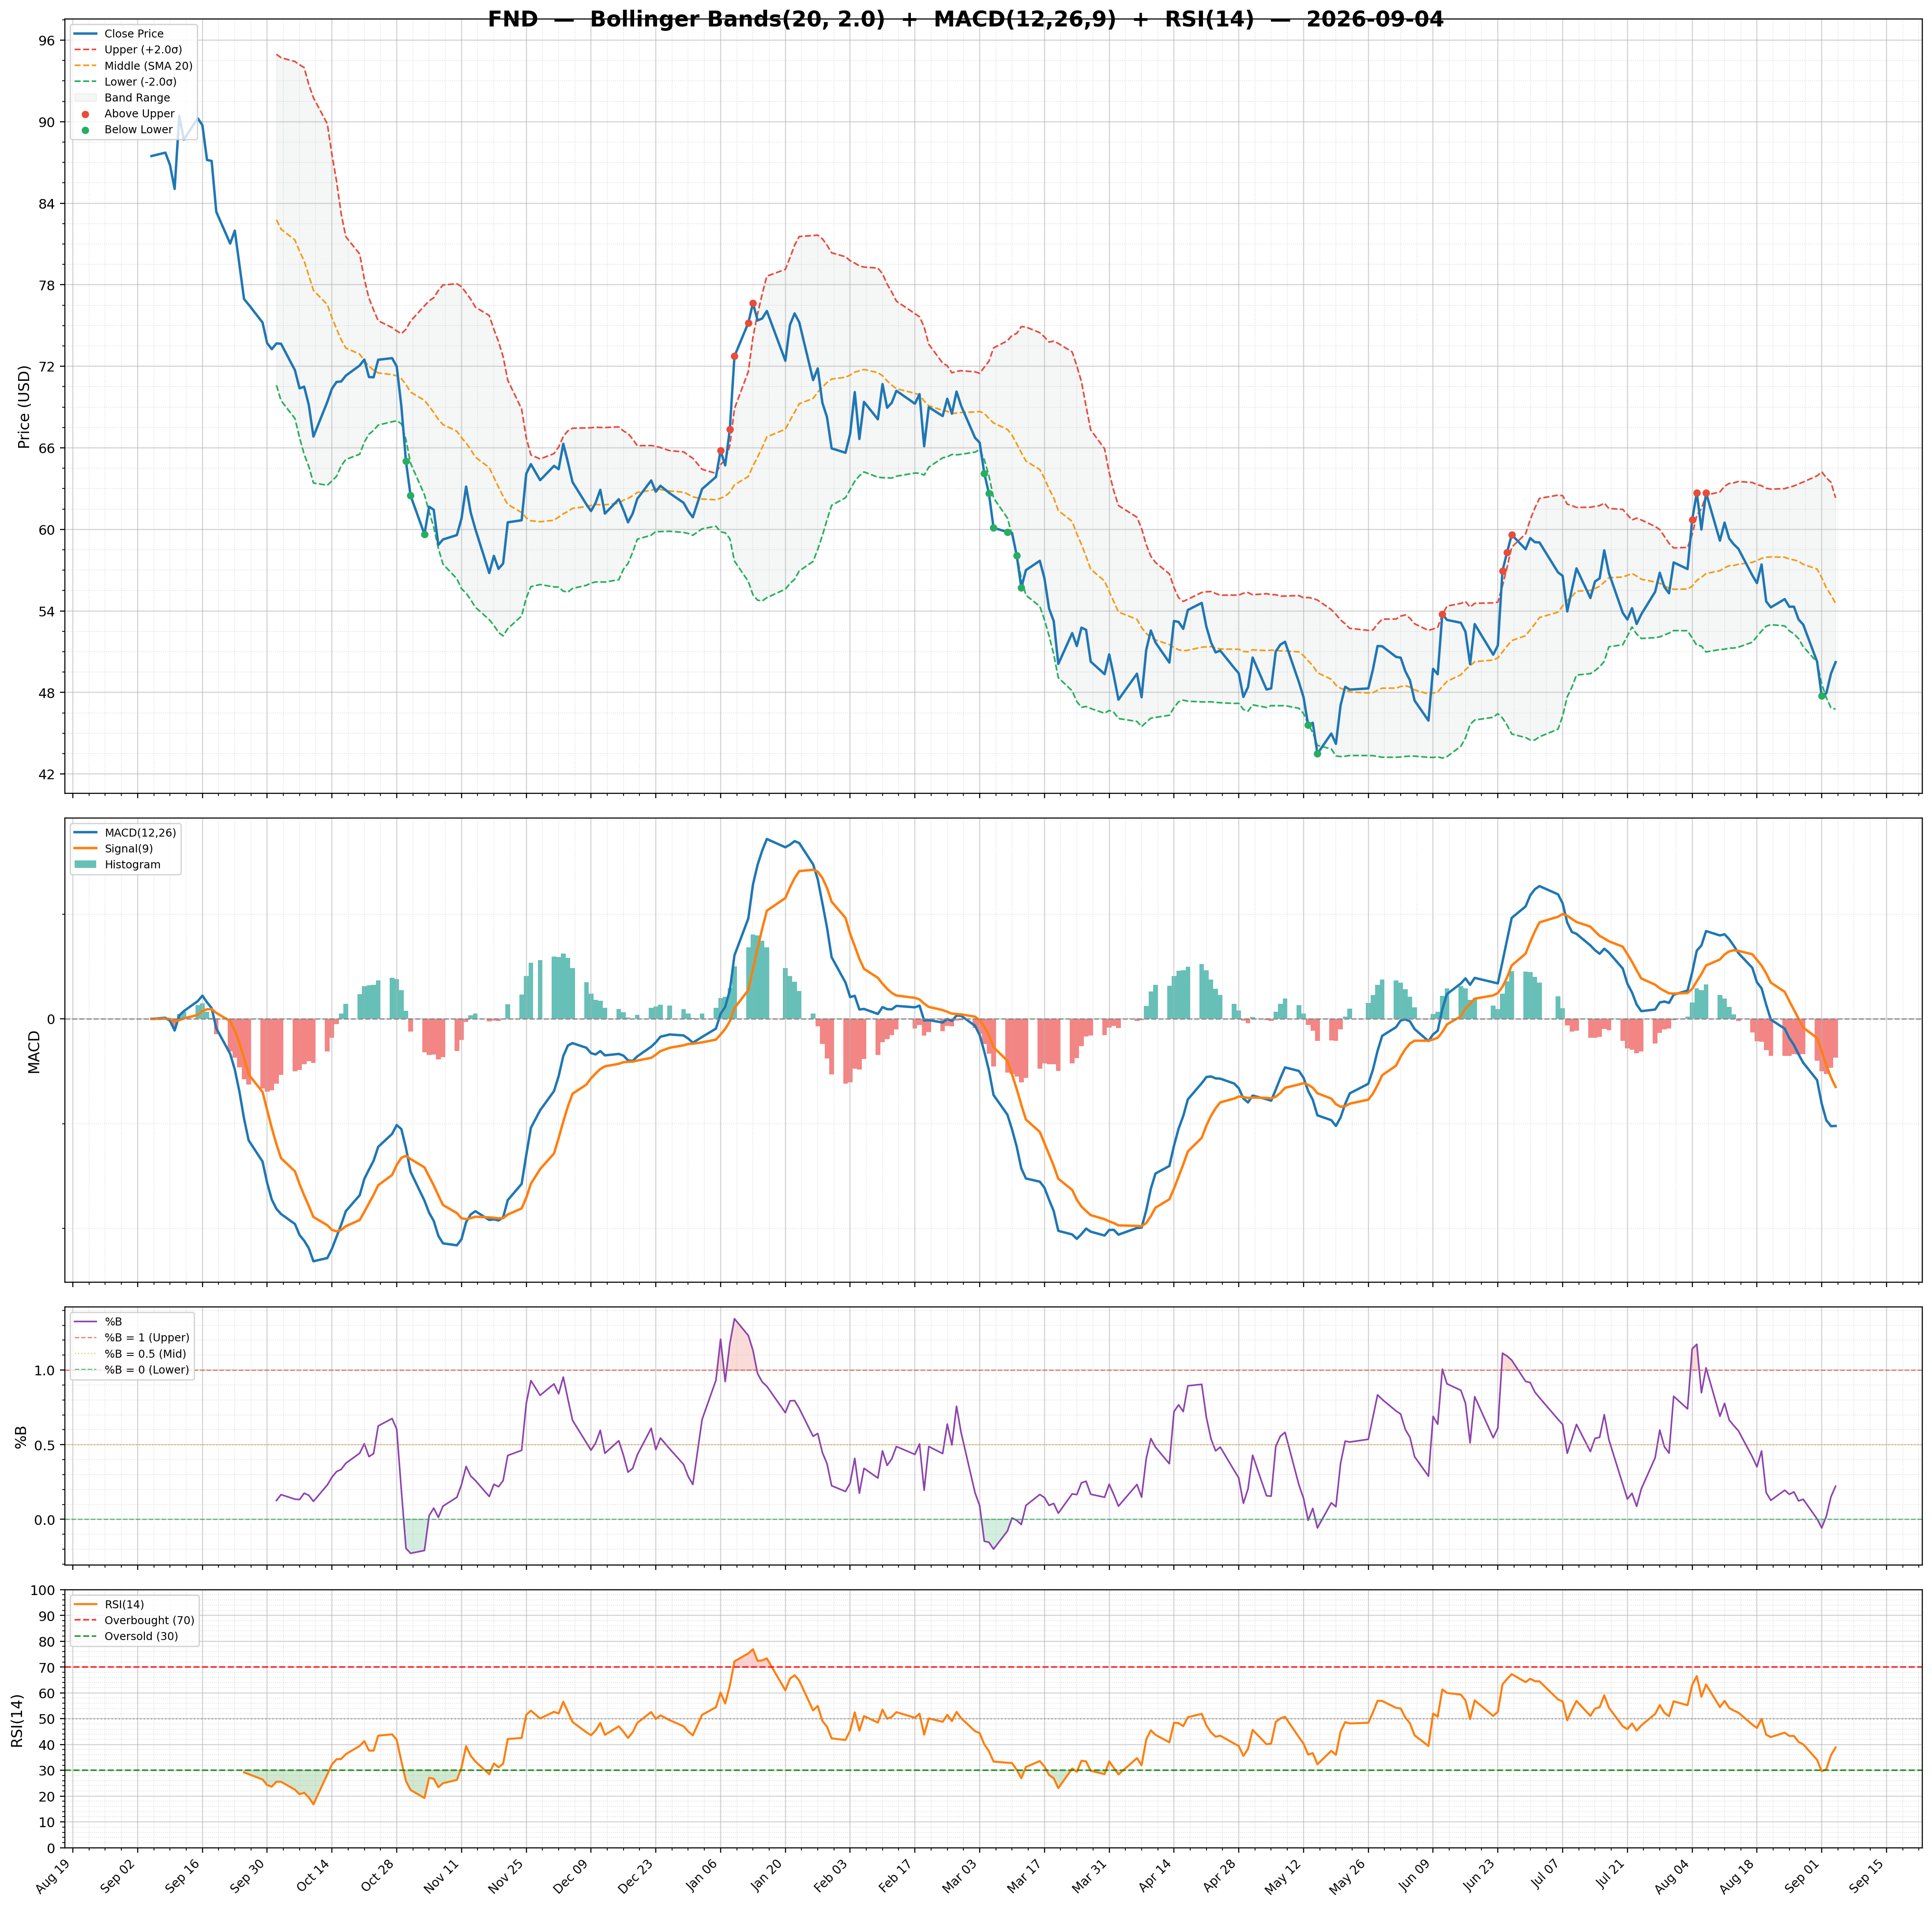
| MACD | -0.80 | Lower Band | 43.69 | Target Low | $38.00 |
| MACD Signal | -1.18 | Middle Band | 45.81 | Target Median | $58.50 |
| Histogram | 0.38 | Upper Band | 47.93 | Analysts | 22 |
| Previous Histogram | 0.16 | Bandwidth | 9.240 | Upside | 28.48% |
| Histogram Trend | Increasing | %B | 1.06 | ||