Funko, Inc. (FNKO)
Consumer Cyclical • Leisure • $7.04 • MCap: 371,251,936
https://www.funko.com • Funko, Inc., a pop culture consumer products company, designs, manufactures, and markets licensed pop culture products in the United States, Europe, and internationally. It offers media and entertainment content, including movies, television (TV) shows, video games, music, and sports; figures, handbags, backpacks, wallets, apparel, accessories, plush products, homewares, and digital tokens; and art prints and vinyl records, posters, toys, apparel, books, games, and other collectibles. The company markets its products under the Pop!, Loungefly, Funko, Mystery Minis, Bitty Pop!, Funko action figures, Funko Plush, and Funko Soda brands; and licenses its properties under the classic evergreen, movie release, current TV, and current video game categories. The company sells its products through specialty retailers, mass-market retailers, e-commerce sites, and distributors; and at specialty licensing and comic book shows, conventions, and exhibitions, as well as through its e-commerce business. The company was founded in 1998 and is headquartered in Everett, Washington.
Test1
| Score | Price | 52 Week & Averages | Relative Strength | Risk | |||||
|---|---|---|---|---|---|---|---|---|---|
| Total | 37 | Current | $7.04 | 52W High | $7.10 -0.92% | Relative Strength | 0.56 | Beta | 0.96 |
| Business Quality | 7 | Weekly | $6.82 3.08% | 52W Low | $2.81 150.36% | 3M | 0.22 | Short % | 0.18 |
| Financial Strength | 7 | Monthly | $5.62 25.18% | Above 50DMA | $6.05 16.29% | 6M | 0.61 | Risk Score | 8 |
| Growth Outlook | 1 | Quarterly | $5.79 21.50% | Above 200DMA | $5.03 39.82% | 9M | 0.60 | ||
| Momentum | 4 | Yearly | $3.16 122.63% | 12M | 1.14 | ||||
| Valuation | Financial Strength | Growth/Profitability | |||
|---|---|---|---|---|---|
| Trailing P/E | N/A | Cash | 41M | Revenue Growth | 0.07% |
| Forward P/E | 15.07 | Debt | 261M | Earnings Growth | N/A |
| PEG Ratio | N/A | Debt/Equity | 139.01 | Qtr Earnings Growth | N/A |
| Price/Sales | 0.40 | Current Ratio | 1.16 | Gross Margin | 0.42% |
| Price/Book | 1.98 | Quick Ratio | 0.57 | Operating Margin | -0.02% |
| EV/Revenue | 0.64 | Operating CF | 63M | Profit Margin | 0.00% |
| EV/EBITDA | 9.98 | Free CF | 49M | EBITDA Margin | 0.06% |
| Ent Value | 592M | Return on Assets | 0.00% | ||
| Return on Equity | -0.01% | ||||
| Technical | Volume & Bollinger Bands | Analyst | |||
|---|---|---|---|---|---|
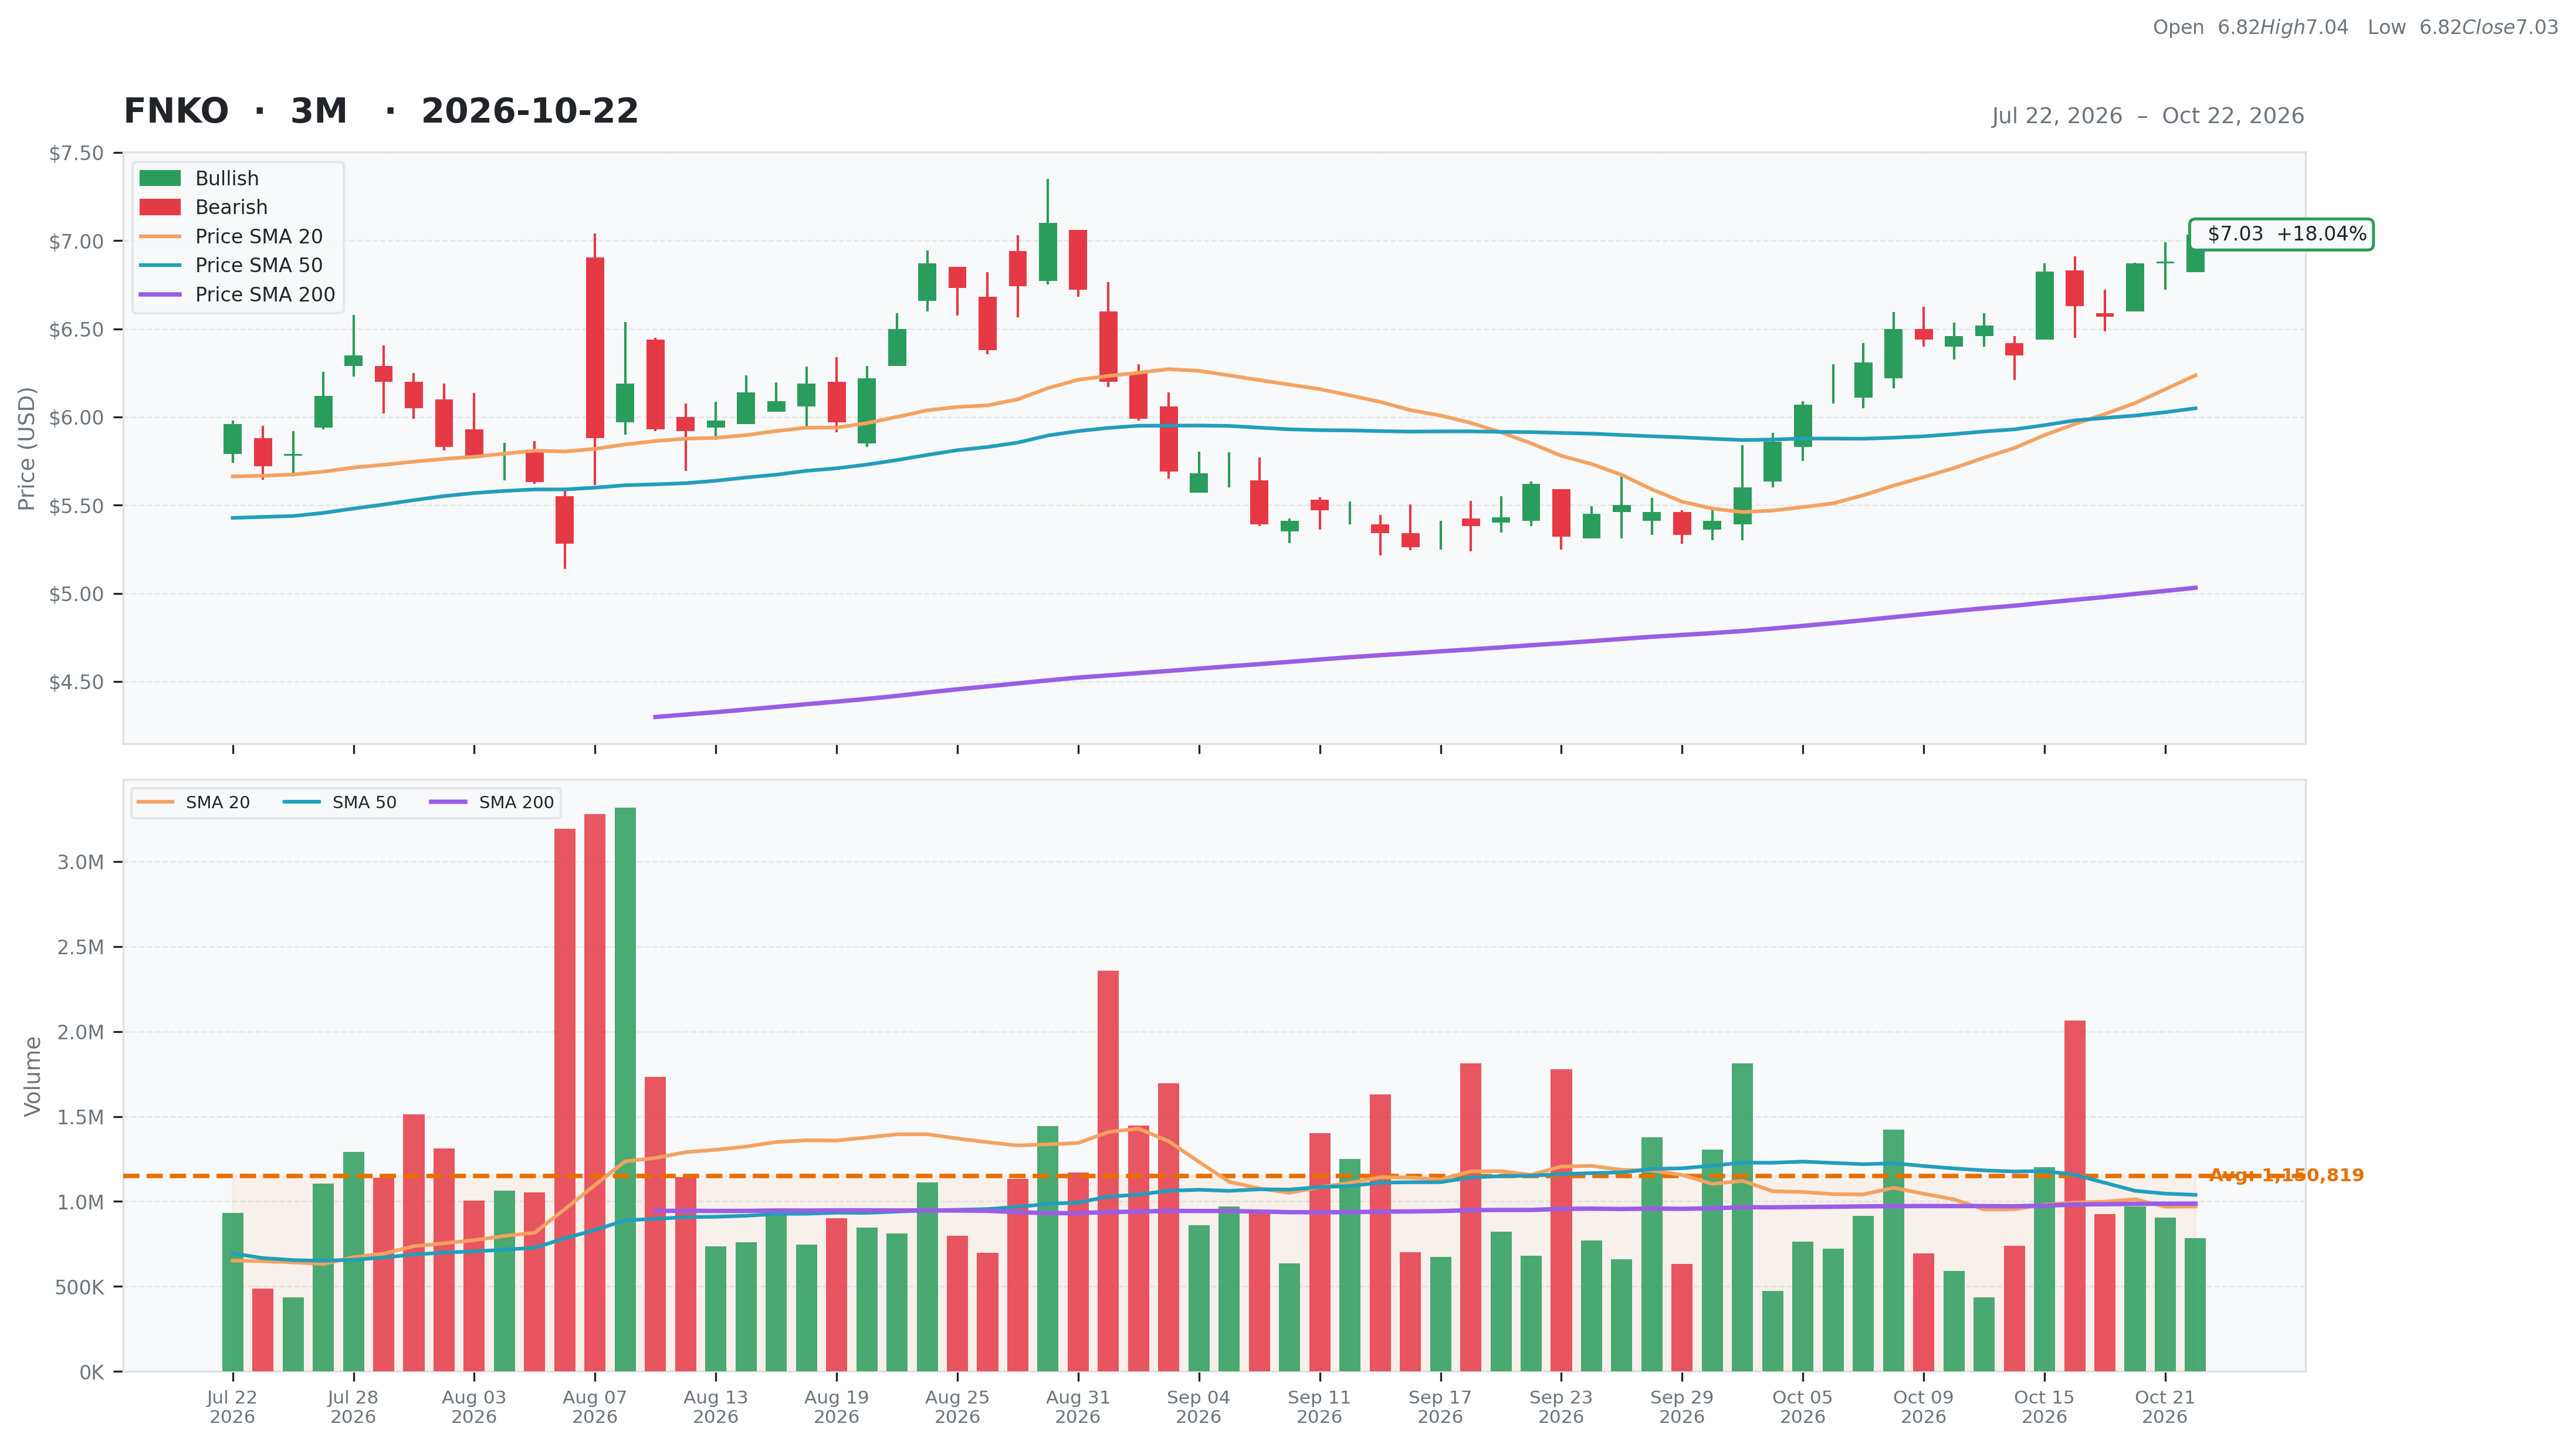
| RSI | 69.08 | Volume | 1.82M | Rating | buy |
| Previous RSI | 66.68 | Avg Volume 20D | 0.97M | Target Mean | $7.25 |
| RSI Trend | Up | Relative Volume | 0.76 | Target High | $8.00 |
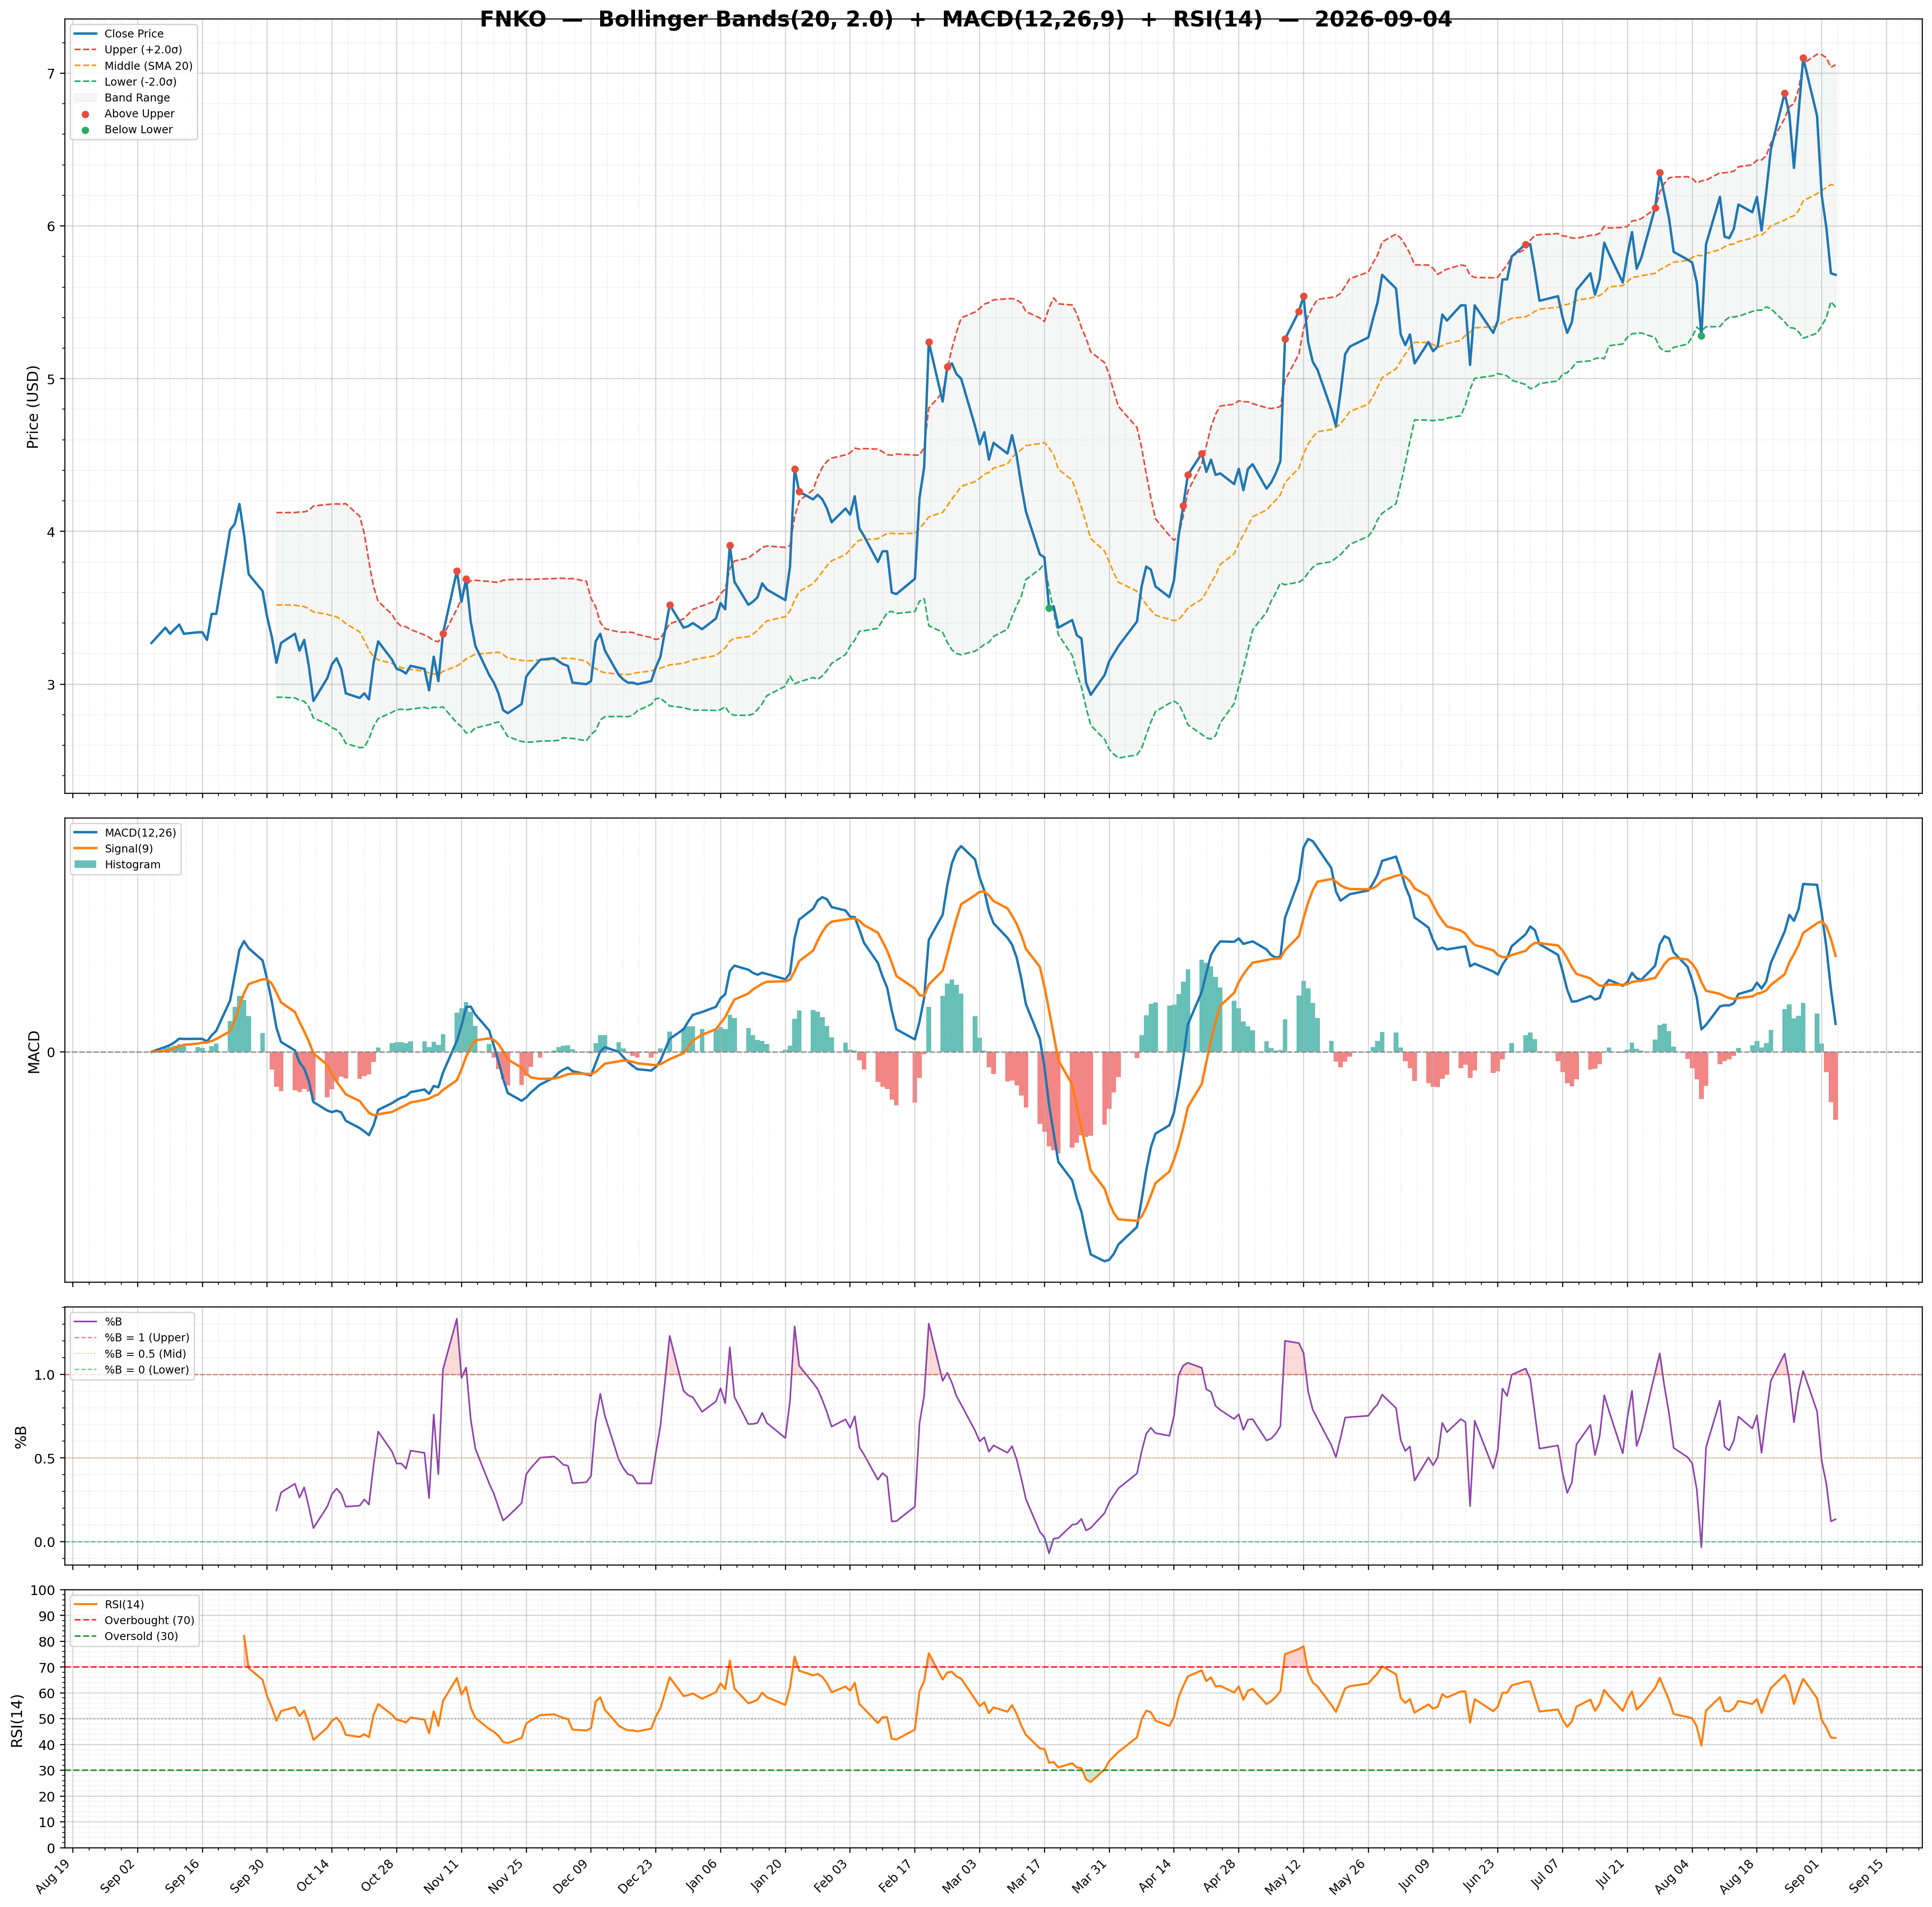
| MACD | 0.30 | Lower Band | 5.15 | Target Low | $6.50 |
| MACD Signal | 0.22 | Middle Band | 6.24 | Target Median | $7.25 |
| Histogram | 0.08 | Upper Band | 7.32 | Analysts | 2 |
| Previous Histogram | 0.08 | Bandwidth | 34.710 | Upside | 9.35% |
| Histogram Trend | Increasing | %B | 0.87 | ||