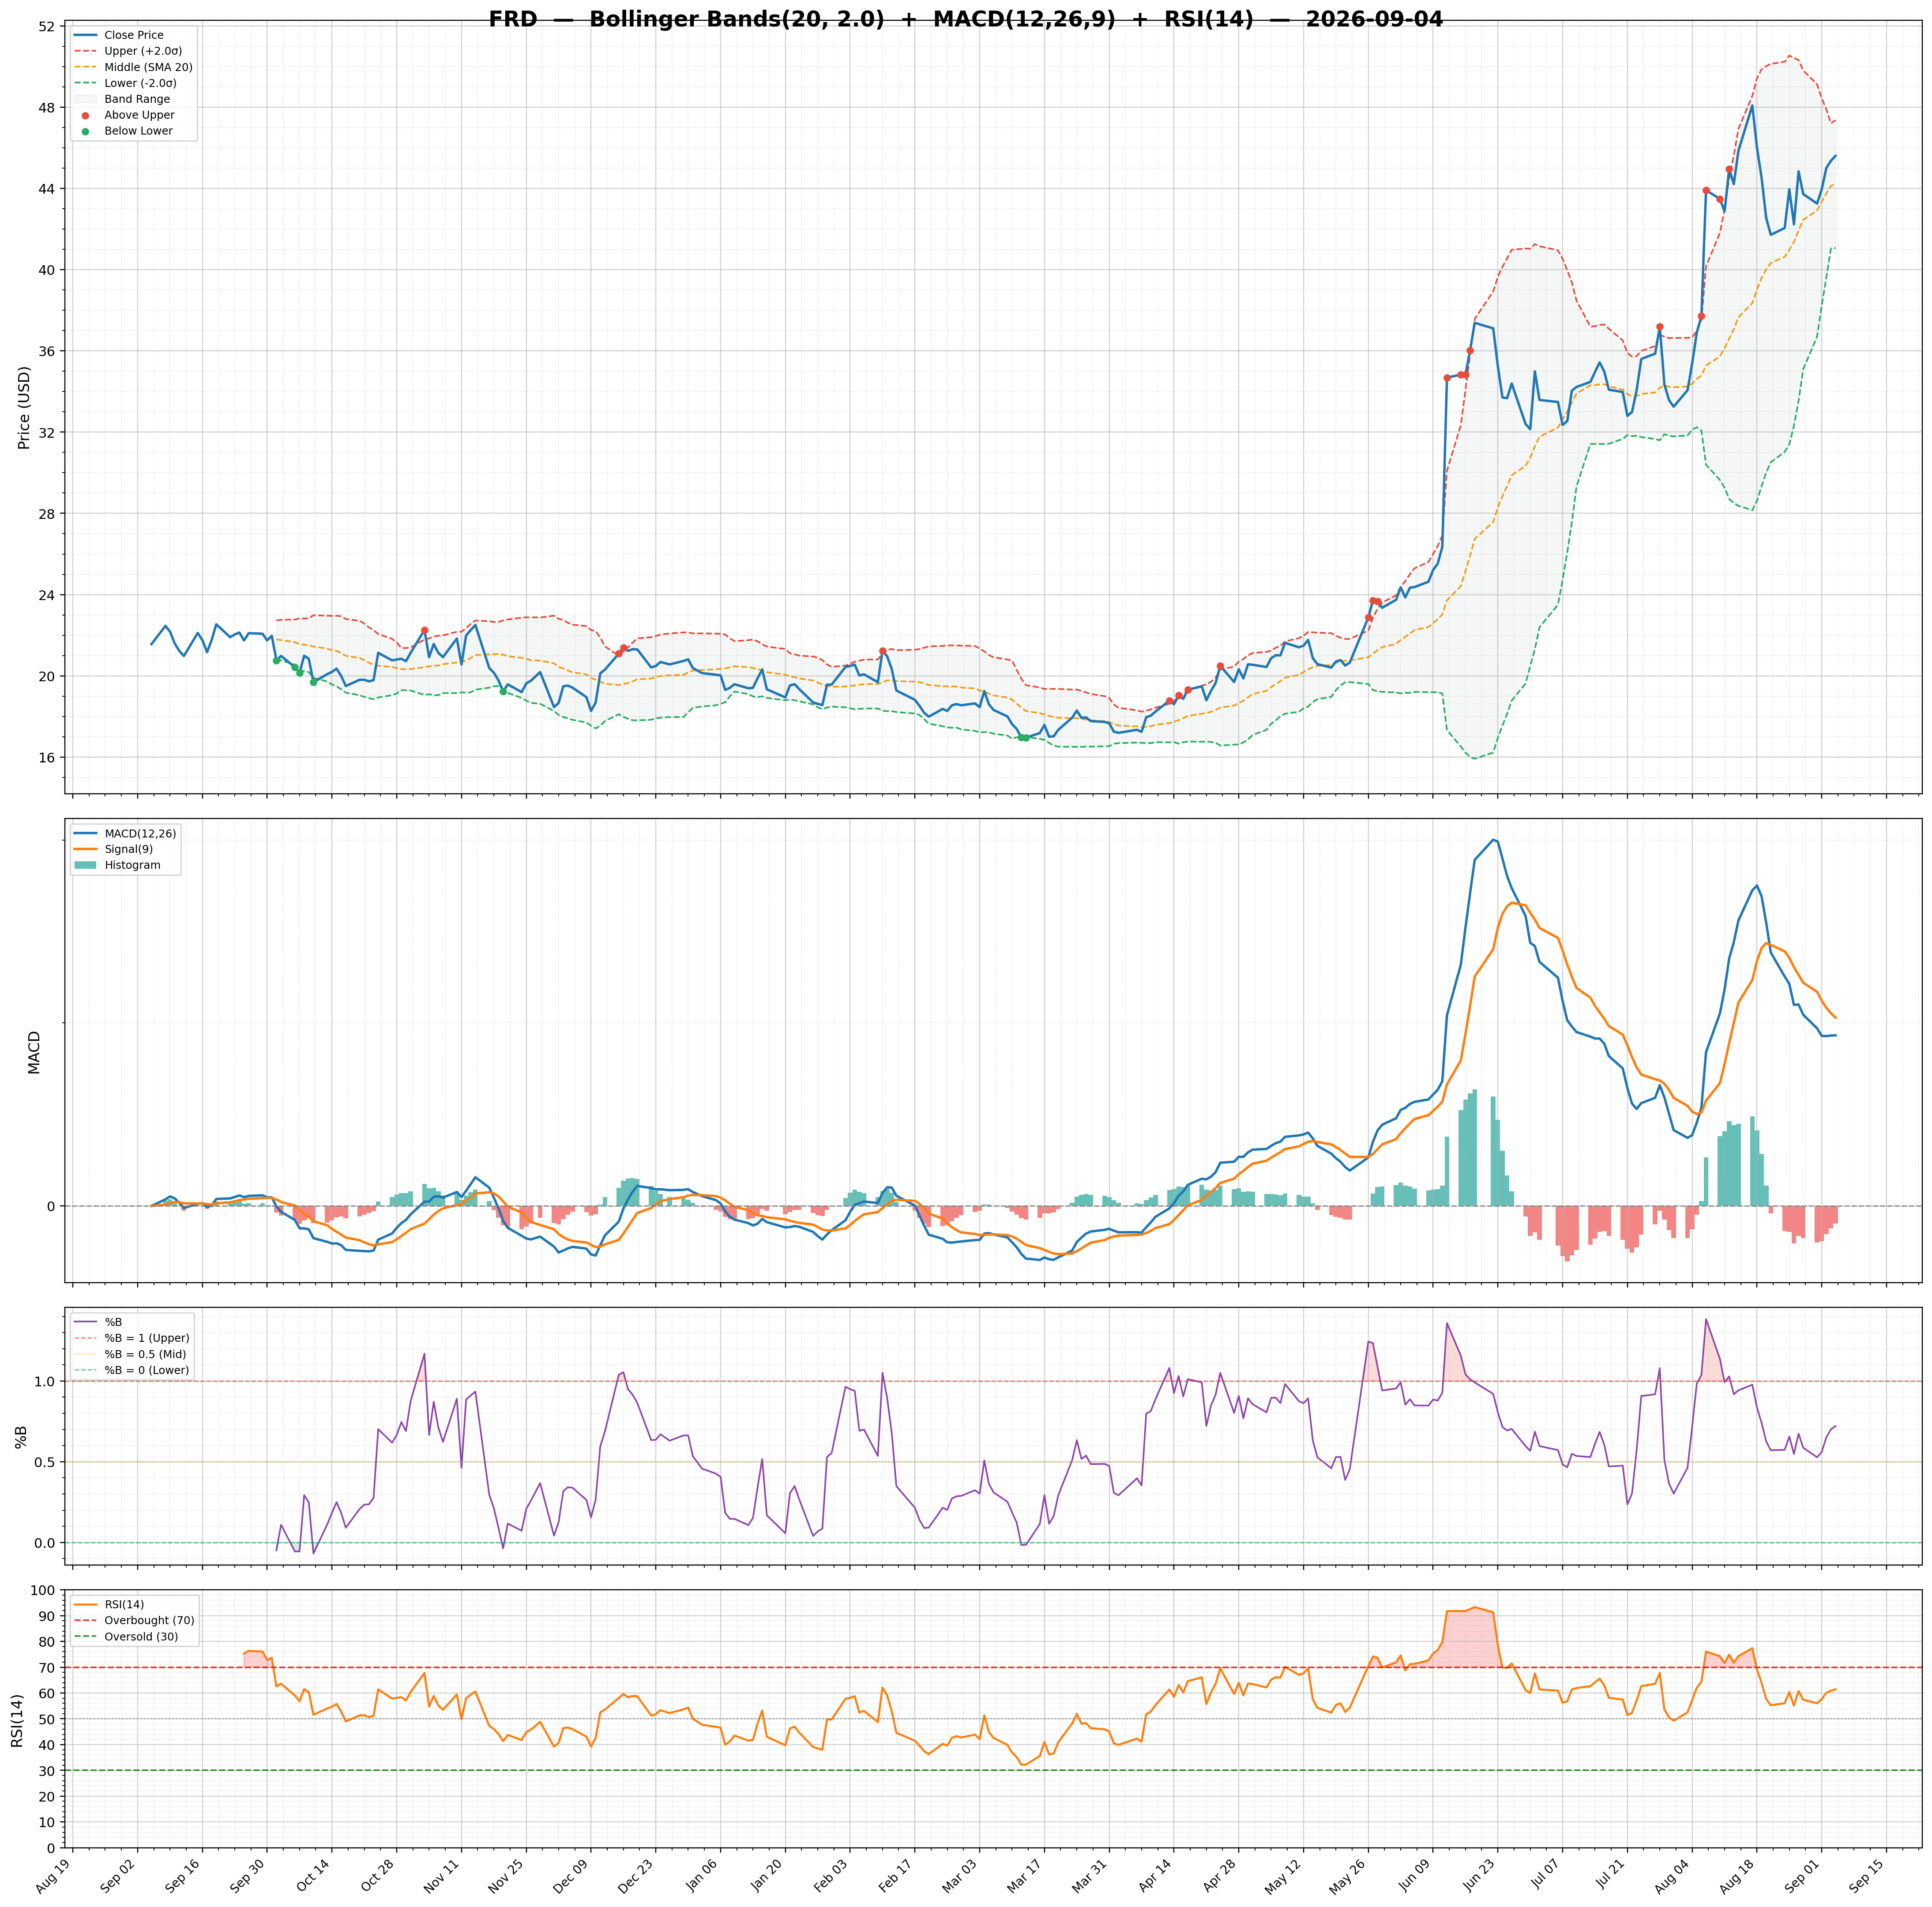
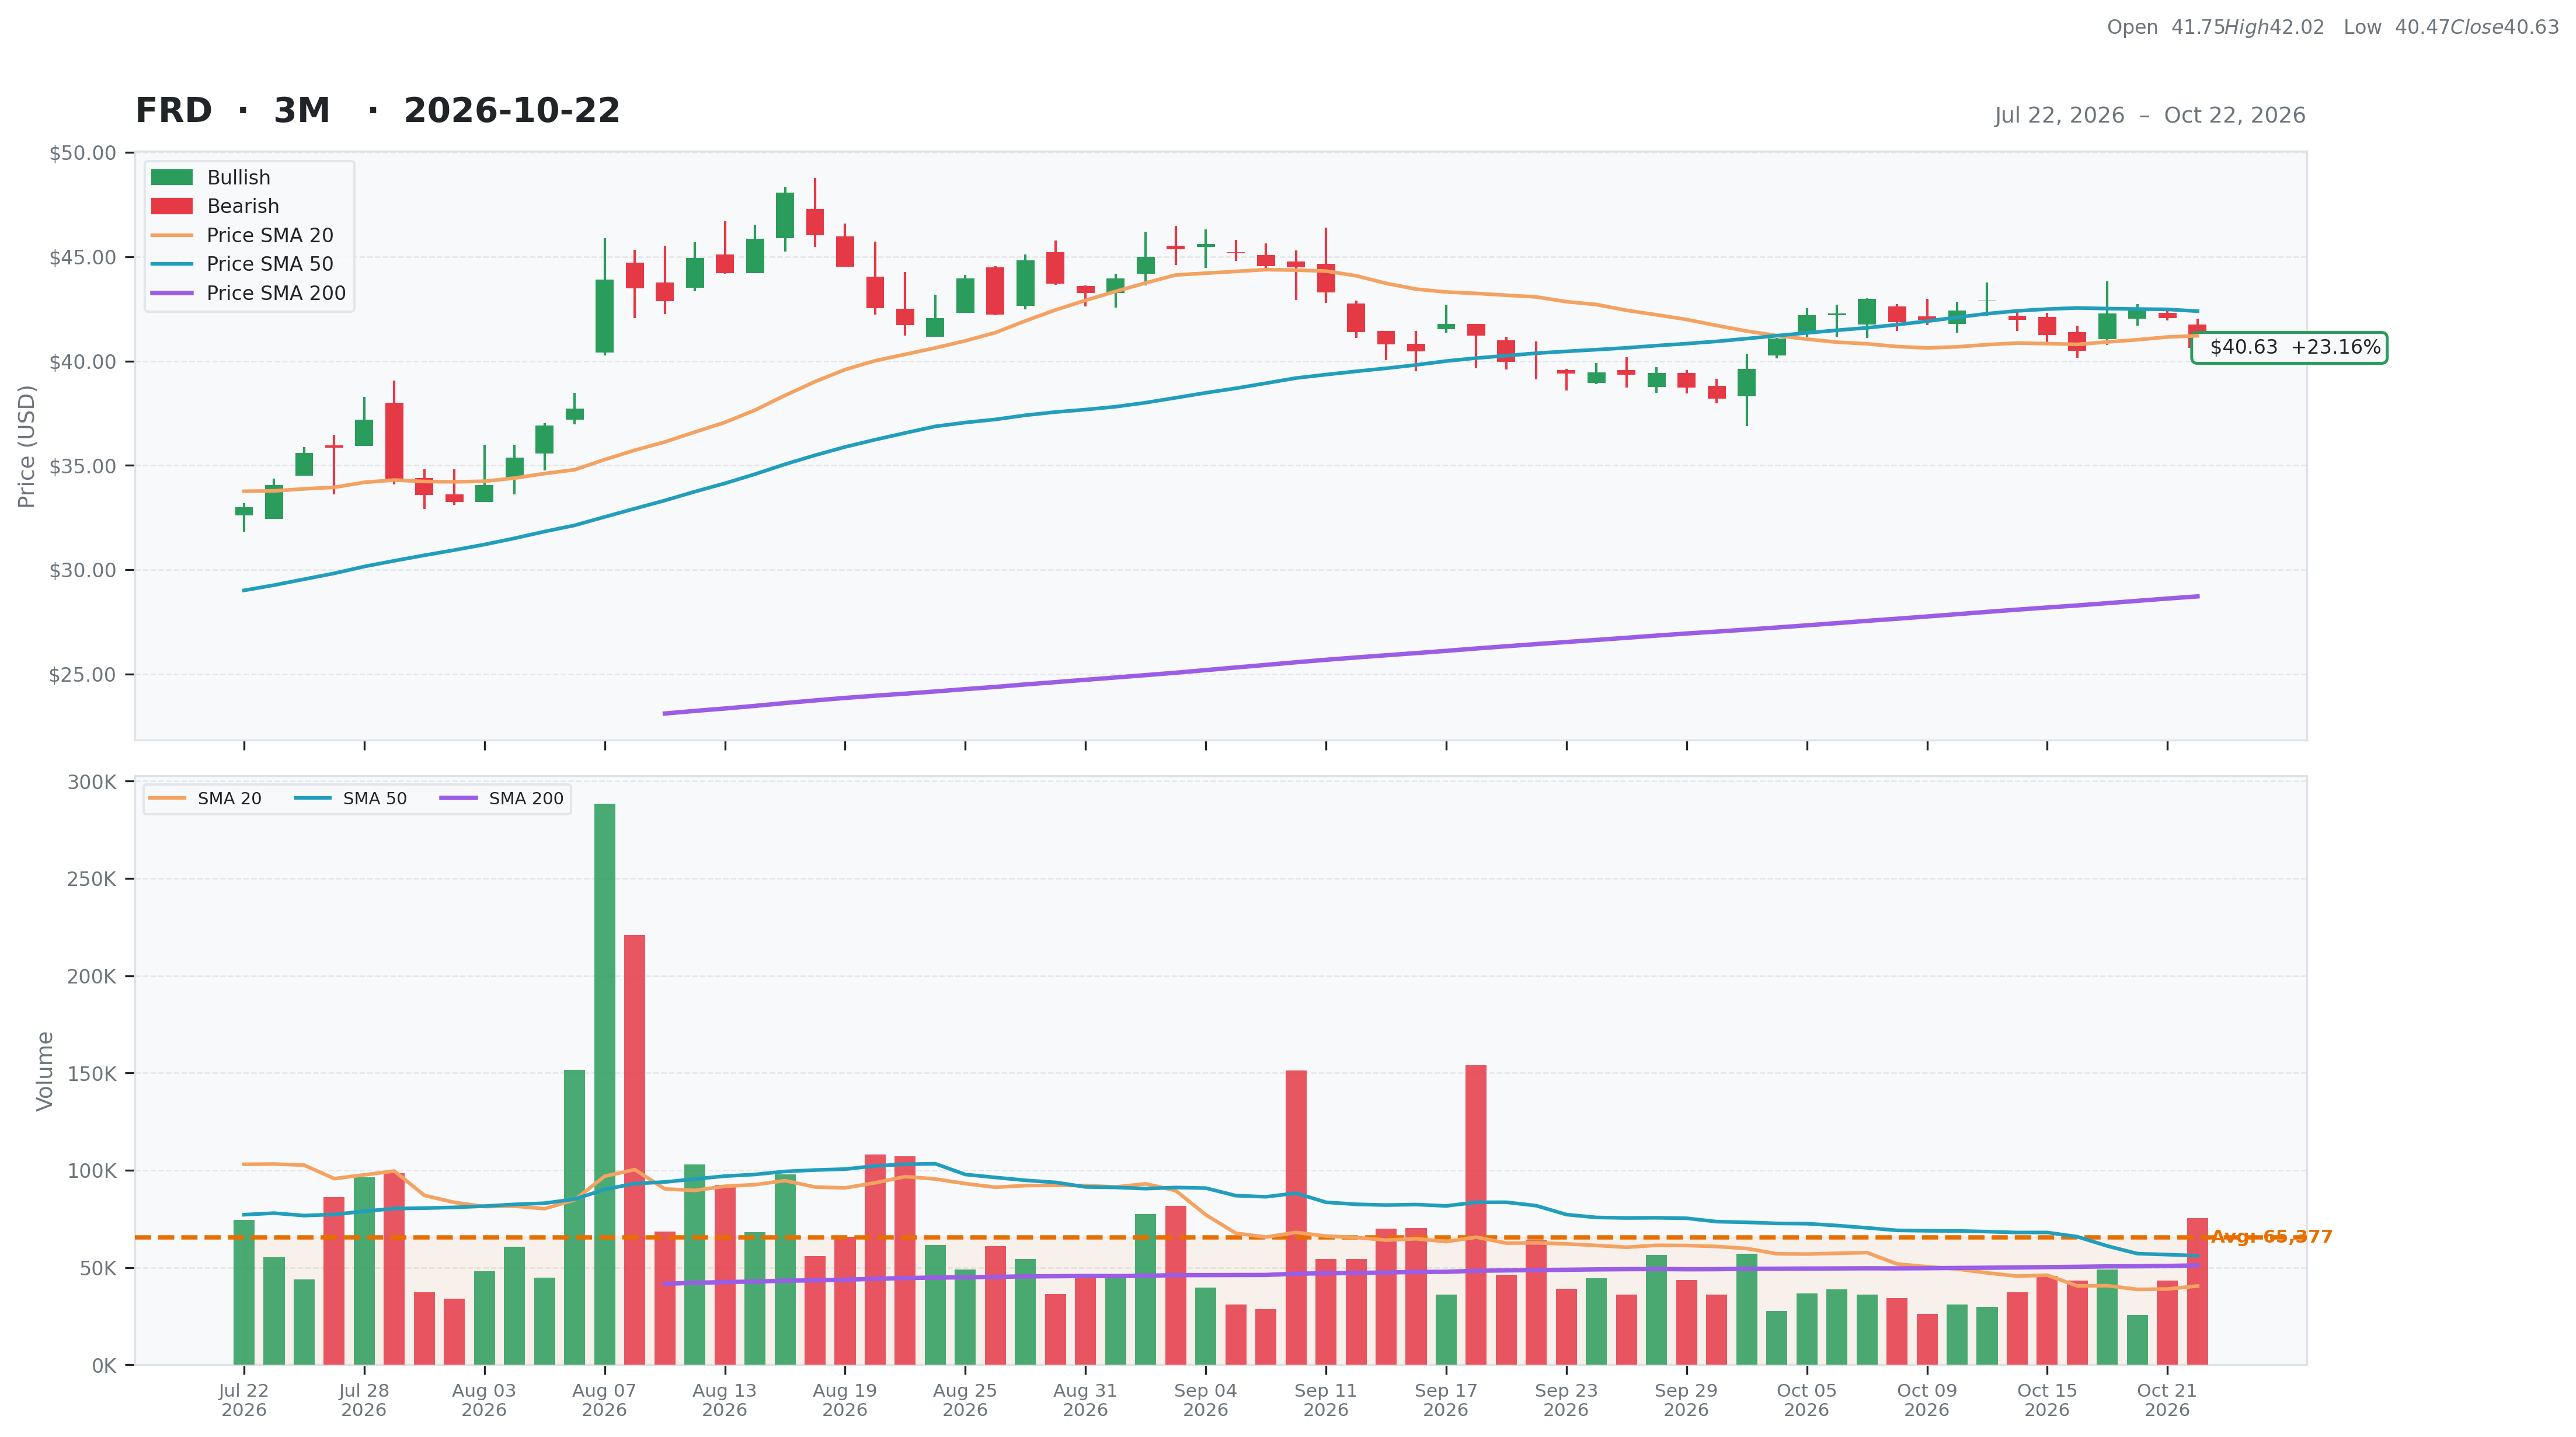
Friedman Industries Inc. (FRD)
Basic Materials • Steel • $40.63 • MCap: 291,973,792
https://friedmanindustries.com • Friedman Industries, Incorporated engages in the manufacture and processing of steel products in the United States. The company operates in two segments, Flat-Roll Products and Tubular Products. The Flat-Roll Product segment is involved in the operation of hot-rolled coil processing facilities to cut the coils into sheets and plates, as well as the provision of process and storage services for customer-owned coils on a fee basis. The Tubular Product segment manufactures line and oil country pipes, as well as pipes for structural applications. The company serves metals distributors and customers manufacturing products, such as metal buildings, railcars, heavy equipment, tanks and containers, trailers, component parts, and other fabricated metal products. Friedman Industries, Incorporated was incorporated in 1965 and is headquartered in Longview, Texas.
AAII
| Score | Price | 52 Week & Averages | Relative Strength | Risk | |||||
|---|---|---|---|---|---|---|---|---|---|
| Total | 54 | Current | $40.63 | 52W High | $48.08 -15.50% | Relative Strength | 0.67 | Beta | 1.65 |
| Business Quality | 3 | Weekly | $41.26 -1.53% | 52W Low | $16.96 139.62% | 3M | 0.14 | Short % | 0.02 |
| Financial Strength | 15 | Monthly | $40.39 0.59% | Above 50DMA | $42.39 -4.15% | 6M | 1.07 | Risk Score | 7 |
| Growth Outlook | 11 | Quarterly | $35.60 14.13% | Above 200DMA | $28.72 41.46% | 9M | 1.07 | ||
| Momentum | 3 | Yearly | $20.76 95.68% | 12M | 0.92 | ||||
| Valuation | Financial Strength | Growth/Profitability | |||
|---|---|---|---|---|---|
| Trailing P/E | 10.54 | Cash | 5M | Revenue Growth | 0.78% |
| Forward P/E | N/A | Debt | 101M | Earnings Growth | 1.52% |
| PEG Ratio | N/A | Debt/Equity | 61.72 | Qtr Earnings Growth | 1.54% |
| Price/Sales | 0.39 | Current Ratio | 2.90 | Gross Margin | 0.15% |
| Price/Book | 1.78 | Quick Ratio | 0.95 | Operating Margin | 0.09% |
| EV/Revenue | 0.52 | Operating CF | 0M | Profit Margin | 0.04% |
| EV/EBITDA | 8.63 | Free CF | -51M | EBITDA Margin | 0.06% |
| Ent Value | 388M | Return on Assets | 0.09% | ||
| Return on Equity | 0.18% | ||||
| Technical | Volume & Bollinger Bands | Analyst | |||
|---|---|---|---|---|---|
| RSI | 45.82 | Volume | 0.04M | Rating | none |
| Previous RSI | 52.39 | Avg Volume 20D | 0.04M | Target Mean | N/A |
| RSI Trend | Down | Relative Volume | 1.57 | Target High | N/A |
| MACD | 0.09 | Lower Band | 38.31 | Target Low | N/A |
| MACD Signal | 0.10 | Middle Band | 41.21 | Target Median | N/A |
| Histogram | -0.01 | Upper Band | 44.11 | Analysts | N/A |
| Previous Histogram | 0.10 | Bandwidth | 14.080 | Upside | N/A |
| Histogram Trend | Decreasing | %B | 0.40 | ||