Fermi Inc. (FRMI)
Real Estate • REIT - Specialty • $2.65 • MCap: 2,026,380,800
https://www.fermiamerica.com • Fermi Inc. develops next-generation private electric grids that deliver highly redundant power at gigawatt scale to support next-generation intelligence and AI compute. The company combines cutting-edge technology with a deep bench of proven world-class multidisciplinary leaders with a combined 25 GW of experience to create one of the world's largest 17 GW next-generation private grids, helping ensure America's energy and AI dominance. The behind-the-meter Project Matador campus is expected to integrate the nation's largest combined-cycle natural gas project, one of the largest clean new nuclear power complexes in America, utility grid power, solar power, and battery energy storage to support hyperscale AI and advanced computing. The company was incorporated in 2025 is headquartered in Amarillo, Texas.
Watch List
| Score | Price | 52 Week & Averages | Relative Strength | Risk | |||||
|---|---|---|---|---|---|---|---|---|---|
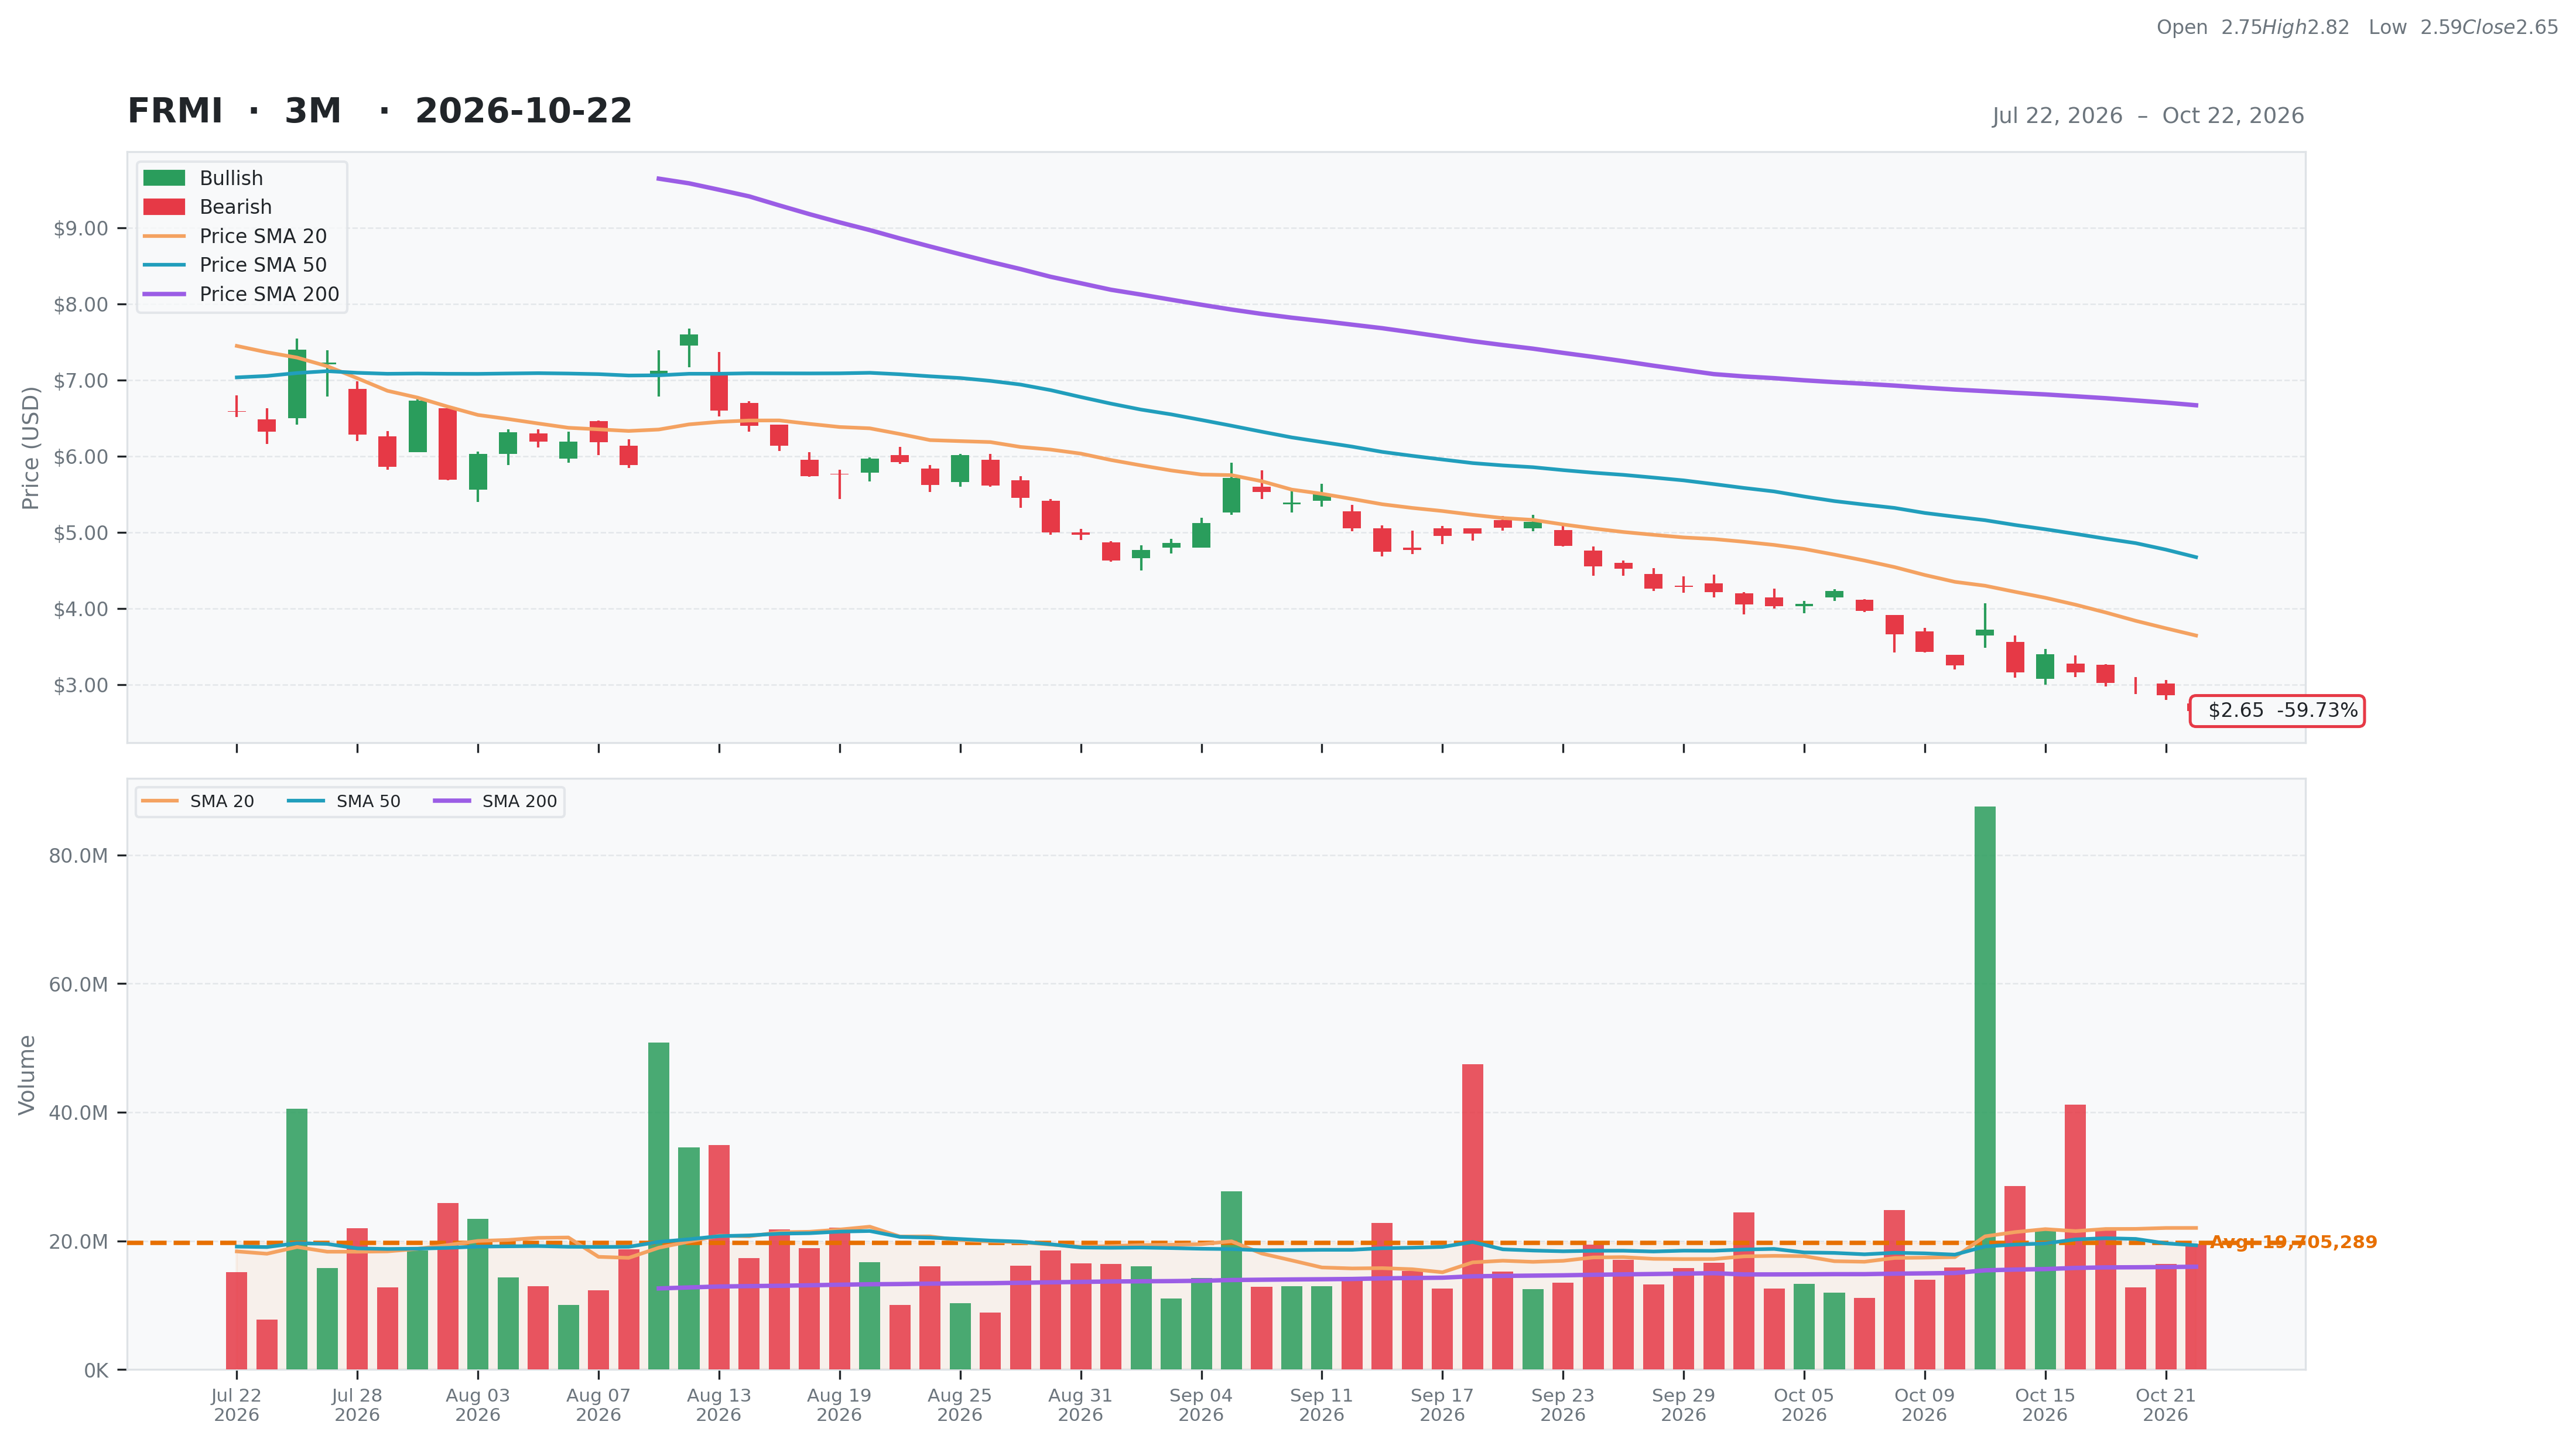
| Total | 31 | Current | $2.65 | 52W High | $29.86 -91.13% | Relative Strength | -0.69 | Beta | N/A |
| Business Quality | 1 | Weekly | $3.39 -21.94% | 52W Low | $2.65 0.00% | 3M | -0.64 | Short % | 0.17 |
| Financial Strength | 5 | Monthly | $5.14 -48.44% | Above 50DMA | $4.67 -43.28% | 6M | -0.55 | Risk Score | 10 |
| Growth Outlook | 1 | Quarterly | $7.40 -64.19% | Above 200DMA | $6.67 -60.26% | 9M | -0.71 | ||
| Momentum | 3 | Yearly | $23.83 -88.88% | 12M | -0.89 | ||||
| Valuation | Financial Strength | Growth/Profitability | |||
|---|---|---|---|---|---|
| Trailing P/E | N/A | Cash | 63M | Revenue Growth | N/A |
| Forward P/E | 14.21 | Debt | 576M | Earnings Growth | N/A |
| PEG Ratio | N/A | Debt/Equity | 55.87 | Qtr Earnings Growth | N/A |
| Price/Sales | N/A | Current Ratio | 1.10 | Gross Margin | 0.00% |
| Price/Book | 1.95 | Quick Ratio | 0.41 | Operating Margin | 0.00% |
| EV/Revenue | N/A | Operating CF | -88M | Profit Margin | 0.00% |
| EV/EBITDA | N/A | Free CF | N/A | EBITDA Margin | 0.00% |
| Ent Value | 2,538M | Return on Assets | N/A | ||
| Return on Equity | N/A | ||||
| Technical | Volume & Bollinger Bands | Analyst | |||
|---|---|---|---|---|---|
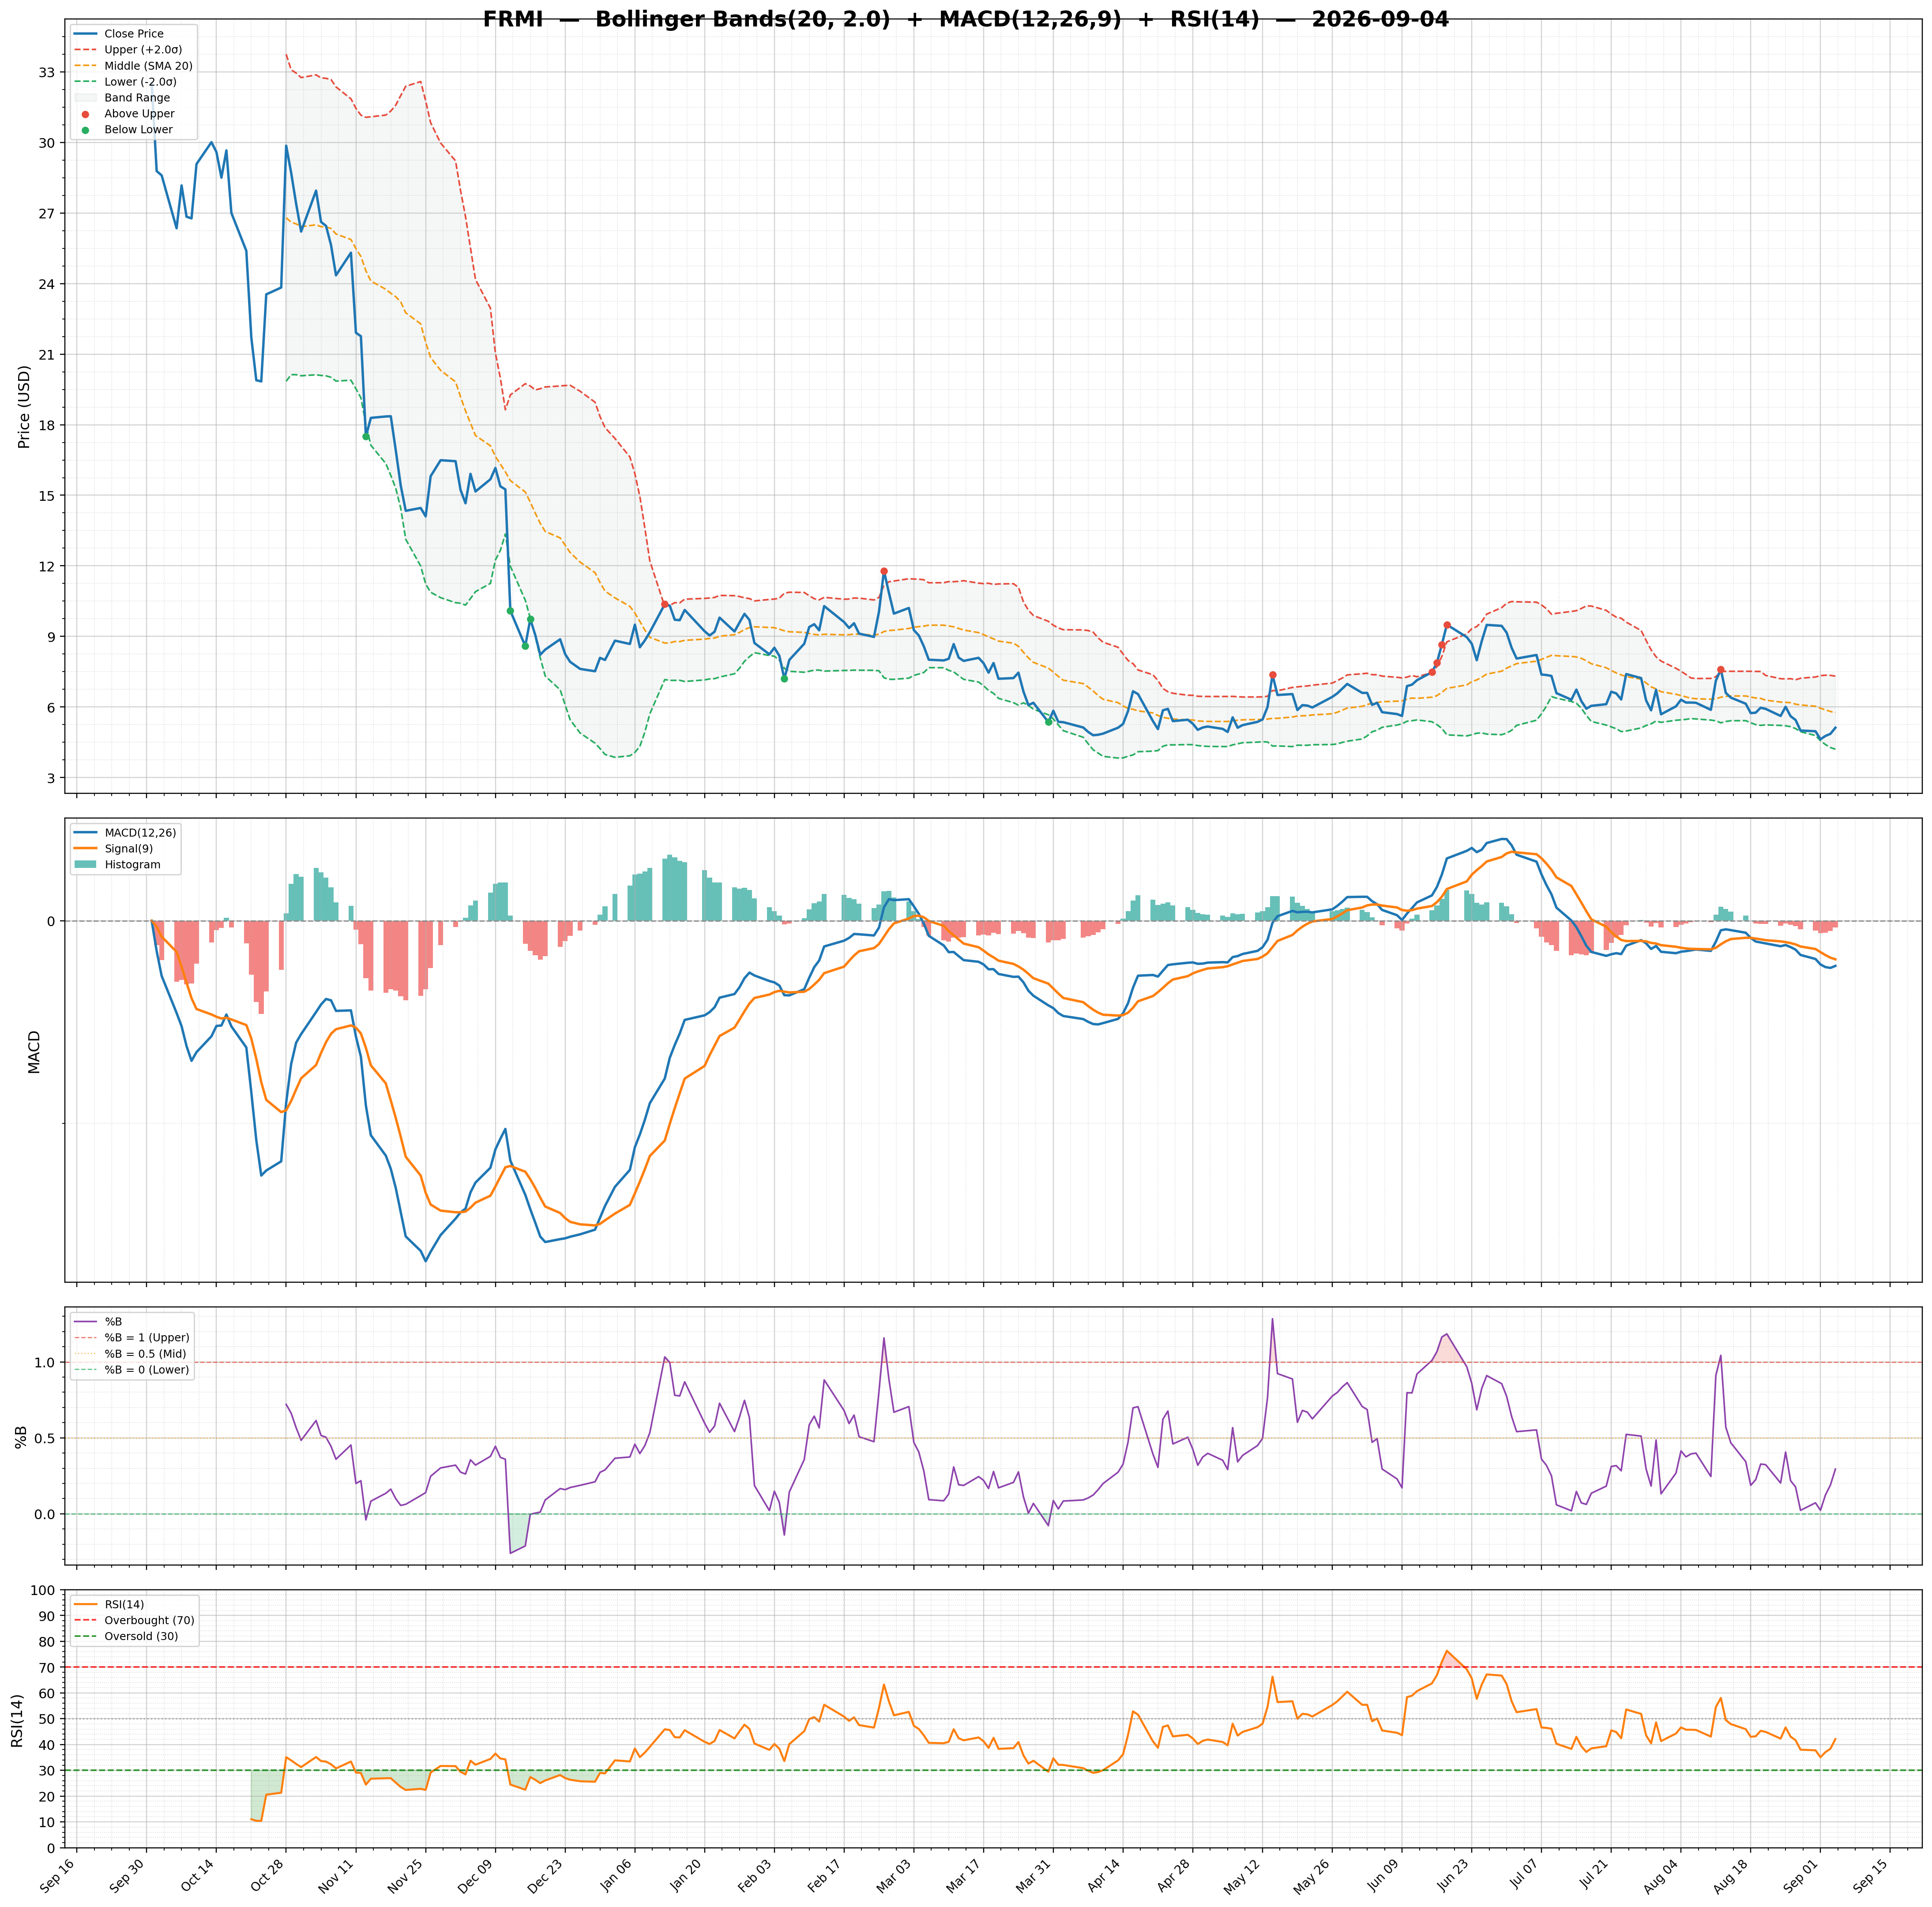
| RSI | 28.00 | Volume | 41.13M | Rating | buy |
| Previous RSI | 30.15 | Avg Volume 20D | 22.01M | Target Mean | $16.62 |
| RSI Trend | Down | Relative Volume | 0.93 | Target High | $35.00 |
| MACD | -0.55 | Lower Band | 2.52 | Target Low | $6.00 |
| MACD Signal | -0.51 | Middle Band | 3.64 | Target Median | $13.00 |
| Histogram | -0.05 | Upper Band | 4.77 | Analysts | 8 |
| Previous Histogram | -0.04 | Bandwidth | 61.880 | Upside | 426.11% |
| Histogram Trend | Decreasing | %B | 0.06 | ||