FTAI Aviation Ltd. (FTAI)
Industrials • Aerospace & Defense • $157.5 • MCap: 16,891,208,704
https://www.ftaiaviation.com • FTAI Aviation Ltd. owns, acquires, and sells aviation equipment for the transportation of goods and people worldwide. It operates in two segments, Aviation Leasing and Aerospace Products. The Aviation Leasing segment owns, leases, manages, and sells aircraft and aircraft engines. As of December 31, 2025, this segment owned and managed 290 aviation assets consisting of 47 commercial aircraft and 243 engines, including eight aircraft and seventeen engines in Russia. The Aerospace Products segment develops, manufactures, repairs/refurbishes, and sells aircraft engines and aftermarket components for the commercial aircraft engines. It also engages in the offshore energy business, which consists of vessels and equipment that support offshore oil and gas activities and production. FTAI Aviation Ltd. has a strategic collaboration with Aeronautical Engineers, Inc. The company was founded in 2011 and is headquartered in New York, New York.
Google_BUY_Rating
| Score | Price | 52 Week & Averages | Relative Strength | Risk | |||||
|---|---|---|---|---|---|---|---|---|---|
| Total | 57 | Current | $157.50 | 52W High | $308.31 -48.91% | Relative Strength | -0.29 | Beta | 1.57 |
| Business Quality | 17 | Weekly | $168.56 -6.56% | 52W Low | $151.95 3.65% | 3M | -0.27 | Short % | 0.09 |
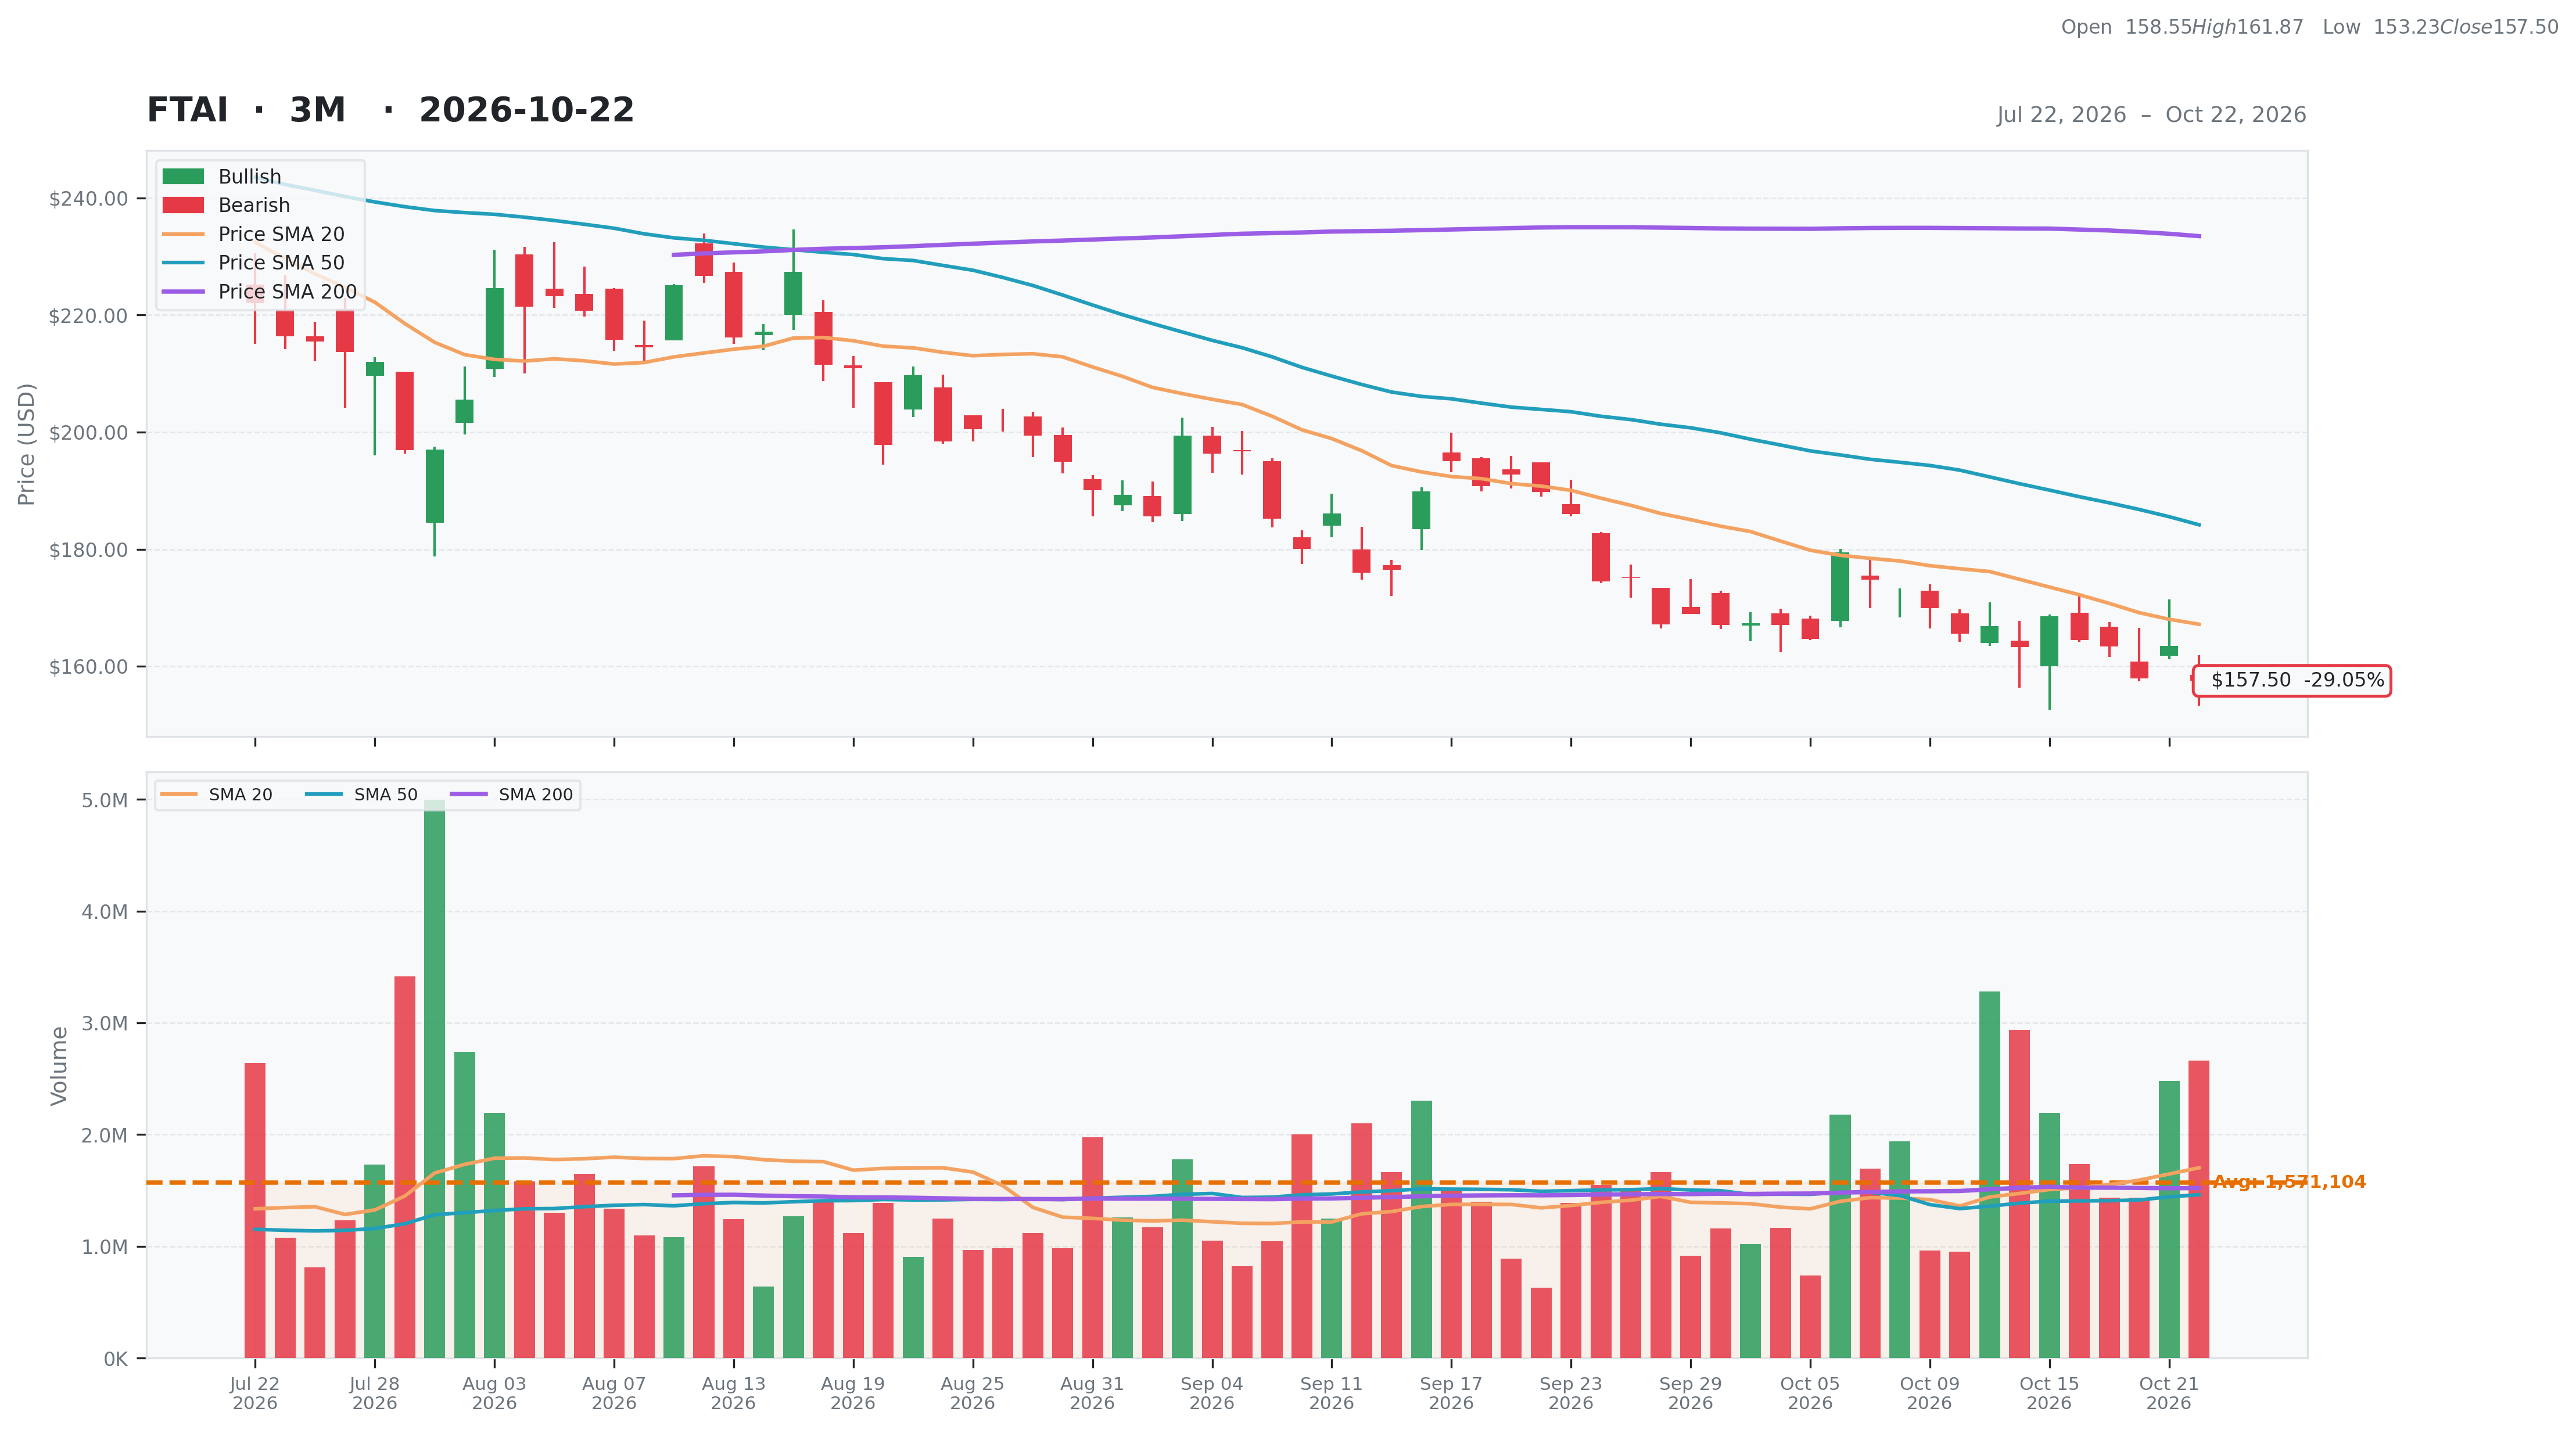
| Financial Strength | 14 | Monthly | $189.74 -16.99% | Above 50DMA | $184.17 -14.48% | 6M | -0.33 | Risk Score | 6 |
| Growth Outlook | 4 | Quarterly | $215.50 -26.91% | Above 200DMA | $233.49 -32.55% | 9M | -0.46 | ||
| Momentum | 3 | Yearly | $183.66 -14.25% | 12M | -0.13 | ||||
| Valuation | Financial Strength | Growth/Profitability | |||
|---|---|---|---|---|---|
| Trailing P/E | 35.75 | Cash | 337M | Revenue Growth | 0.41% |
| Forward P/E | 12.64 | Debt | 3,496M | Earnings Growth | -0.28% |
| PEG Ratio | N/A | Debt/Equity | 865.45 | Qtr Earnings Growth | -0.24% |
| Price/Sales | 5.43 | Current Ratio | 5.28 | Gross Margin | 0.32% |
| Price/Book | 41.78 | Quick Ratio | 1.12 | Operating Margin | 0.21% |
| EV/Revenue | 6.44 | Operating CF | -440M | Profit Margin | 0.16% |
| EV/EBITDA | 20.14 | Free CF | -525M | EBITDA Margin | 0.32% |
| Ent Value | 20,050M | Return on Assets | 0.11% | ||
| Return on Equity | 1.74% | ||||
| Technical | Volume & Bollinger Bands | Analyst | |||
|---|---|---|---|---|---|
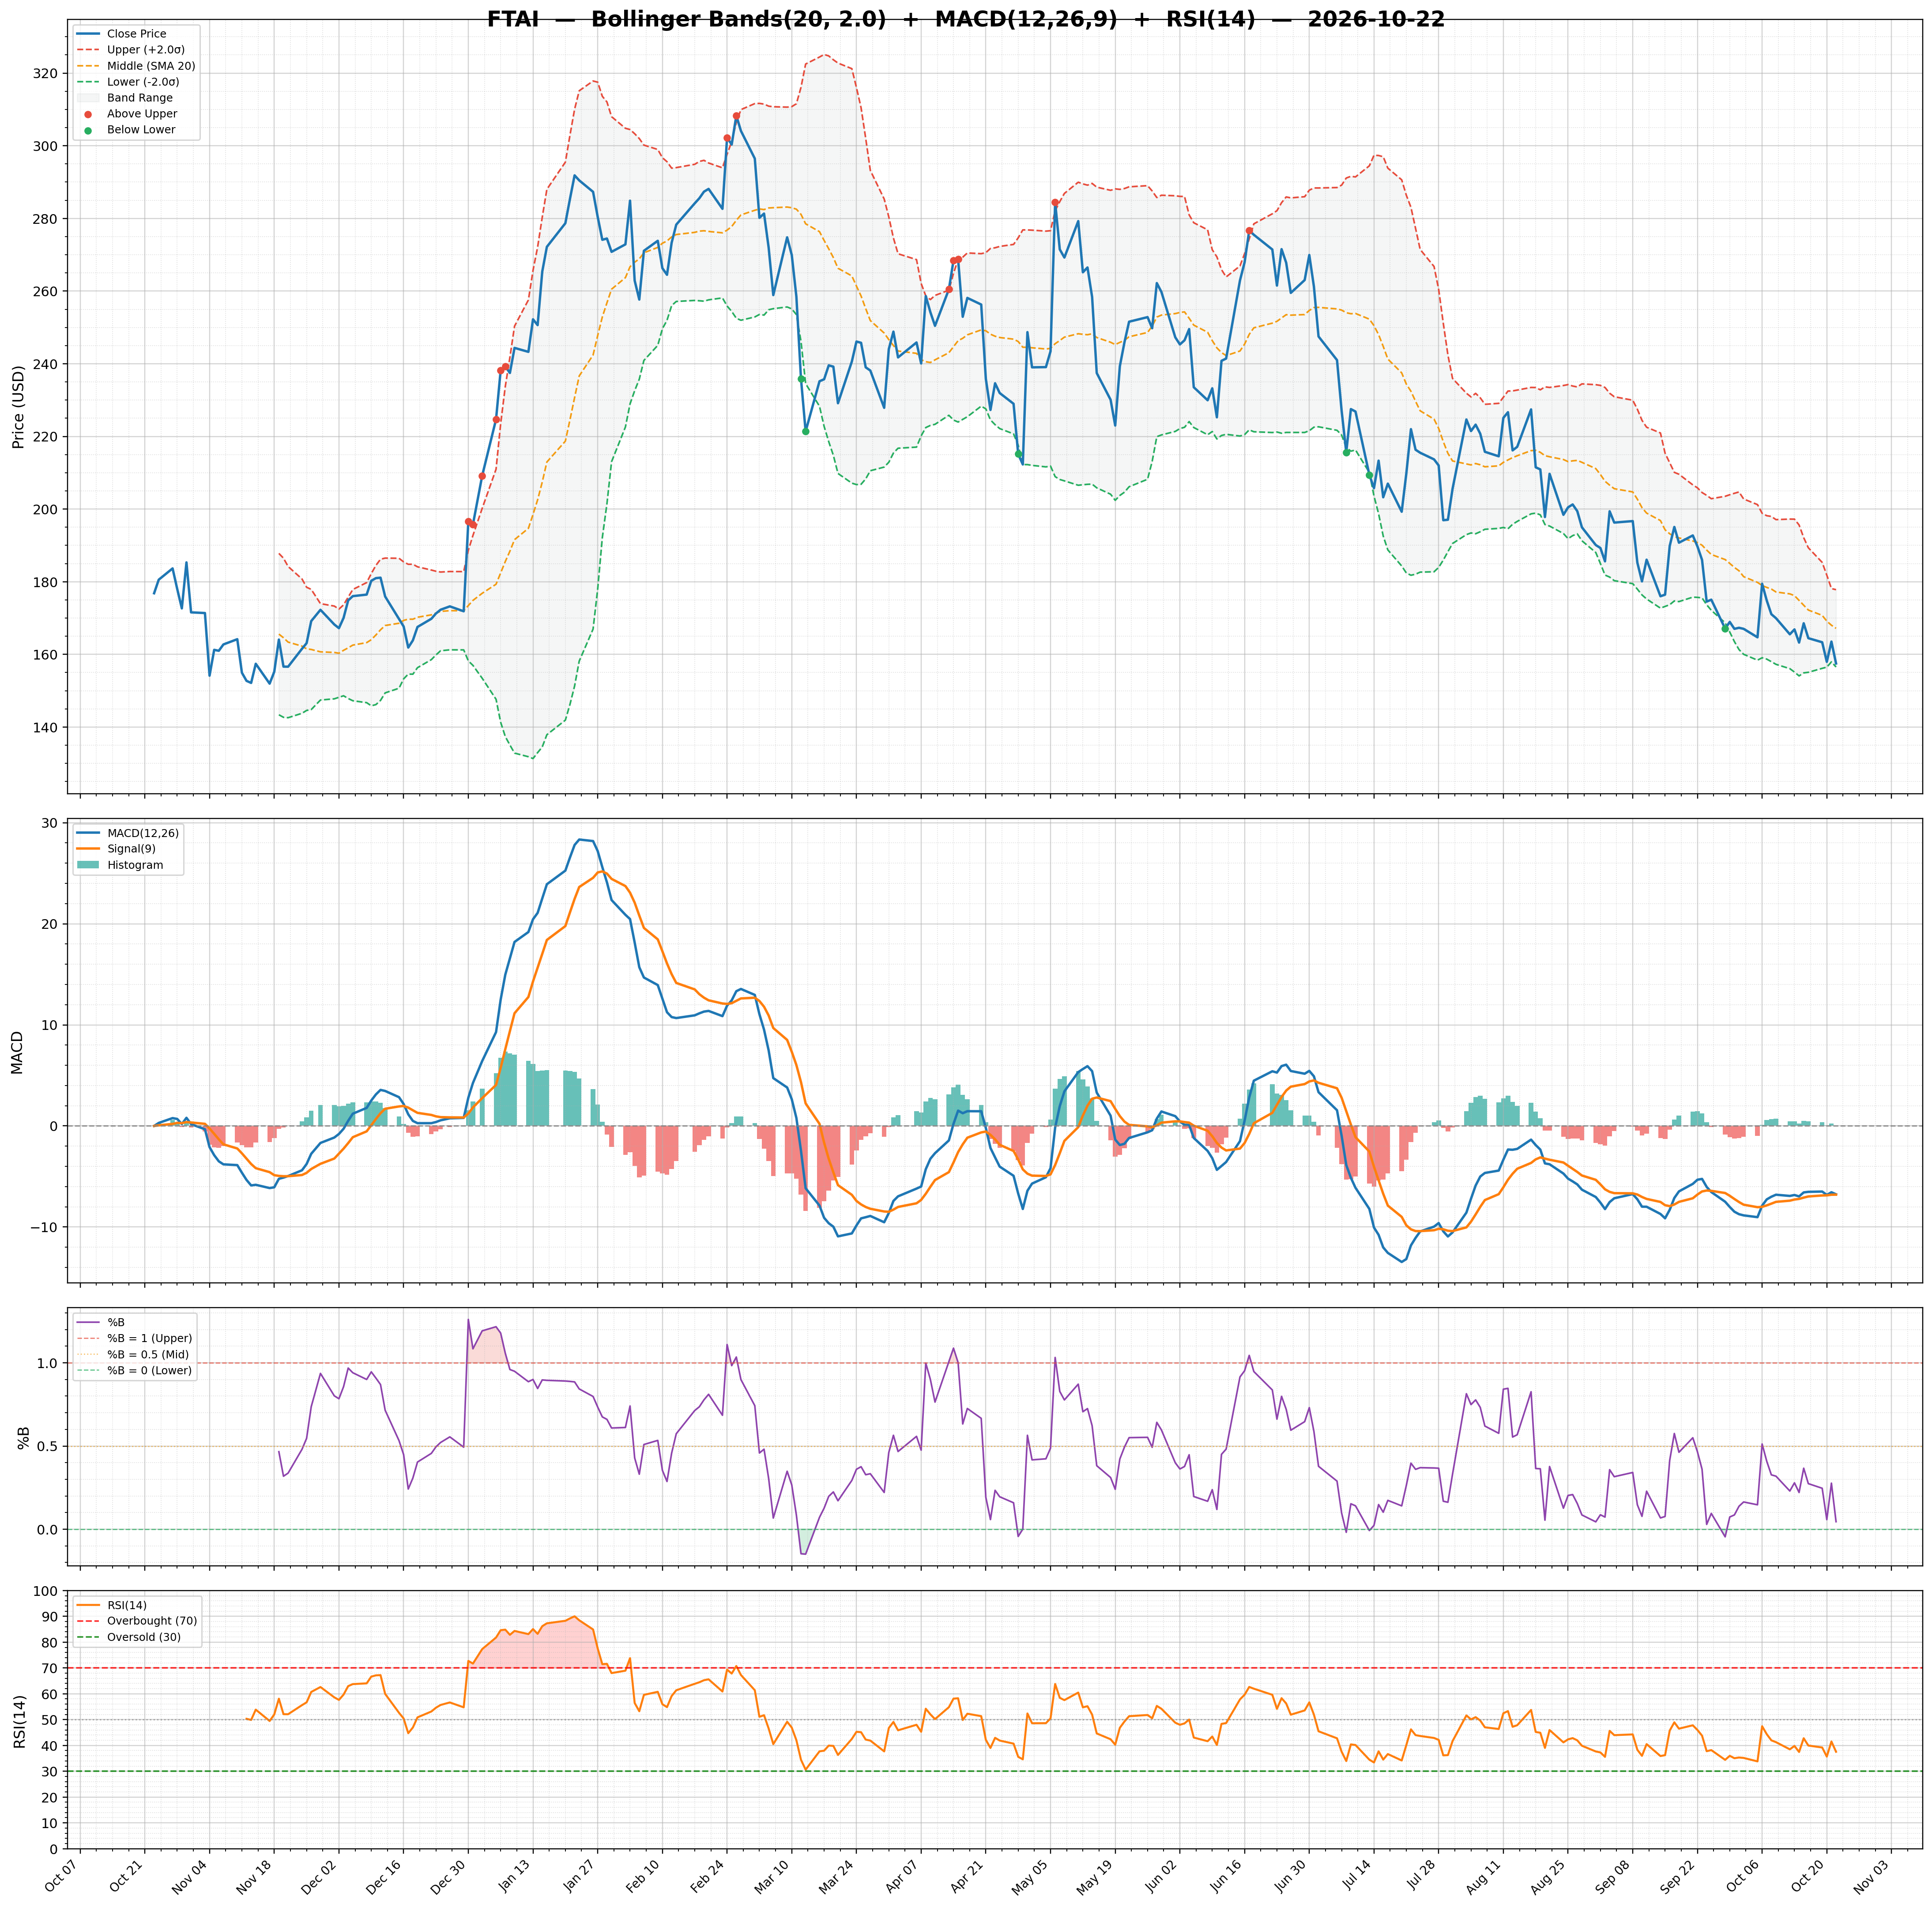
| RSI | 37.55 | Volume | 1.74M | Rating | strong_buy |
| Previous RSI | 41.52 | Avg Volume 20D | 1.7M | Target Mean | $346.45 |
| RSI Trend | Down | Relative Volume | 1.64 | Target High | $540.00 |
| MACD | -6.76 | Lower Band | 156.53 | Target Low | $275.00 |
| MACD Signal | -6.80 | Middle Band | 167.17 | Target Median | $310.00 |
| Histogram | 0.04 | Upper Band | 177.81 | Analysts | 11 |
| Previous Histogram | 0.24 | Bandwidth | 12.730 | Upside | 110.66% |
| Histogram Trend | Decreasing | %B | 0.04 | ||