Graham Corporation (GHM)
Industrials • Specialty Industrial Machinery • $64.41 • MCap: 803,752,064
https://grahamcorp.com • Graham Corporation designs and manufactures fluid, power, heat transfer, and vacuum technologies for chemical and petrochemical processing, defense, space, petroleum refining, cryogenic, and energy industries. The company offers power plant systems, including ejectors and surface condensers, as well as torpedo ejection, propulsion, and power systems comprising turbines, alternators, regulators, pumps, and blowers for the defense industry. It also provides heat transfer and vacuum systems that include ejectors, process and surface condensers, liquid ring pumps, and heat exchangers, as well as nozzles and power generation systems, such as turbines, generators, compressors, and pumps for the energy and process industry. In addition, the company offers rocket propulsion systems, including turbopumps, fuel, cryogenic, and nuclear propellant pumps; cooling systems comprising pumps, compressors, fans, and blowers; and life support systems that consist of fans, pumps, and blowers for the space industry. Further, it provides thermal management systems, such as pumps, blowers, and electronics for the defense and energy sector; advanced mixing systems, including bladeless centrifugal mixers, accessories, services, and consumables; and spare parts for its equipment. It serves customers in the United States, Asia, Canada, the Middle East, South America, and internationally. Graham Corporation was founded in 1936 and is headquartered in Batavia, New York.
Reversal Strategy
Notes
10/23/2026
AVOID opening new buy positions right now
| Score | Price | 52 Week & Averages | Relative Strength | Risk | |||||
|---|---|---|---|---|---|---|---|---|---|
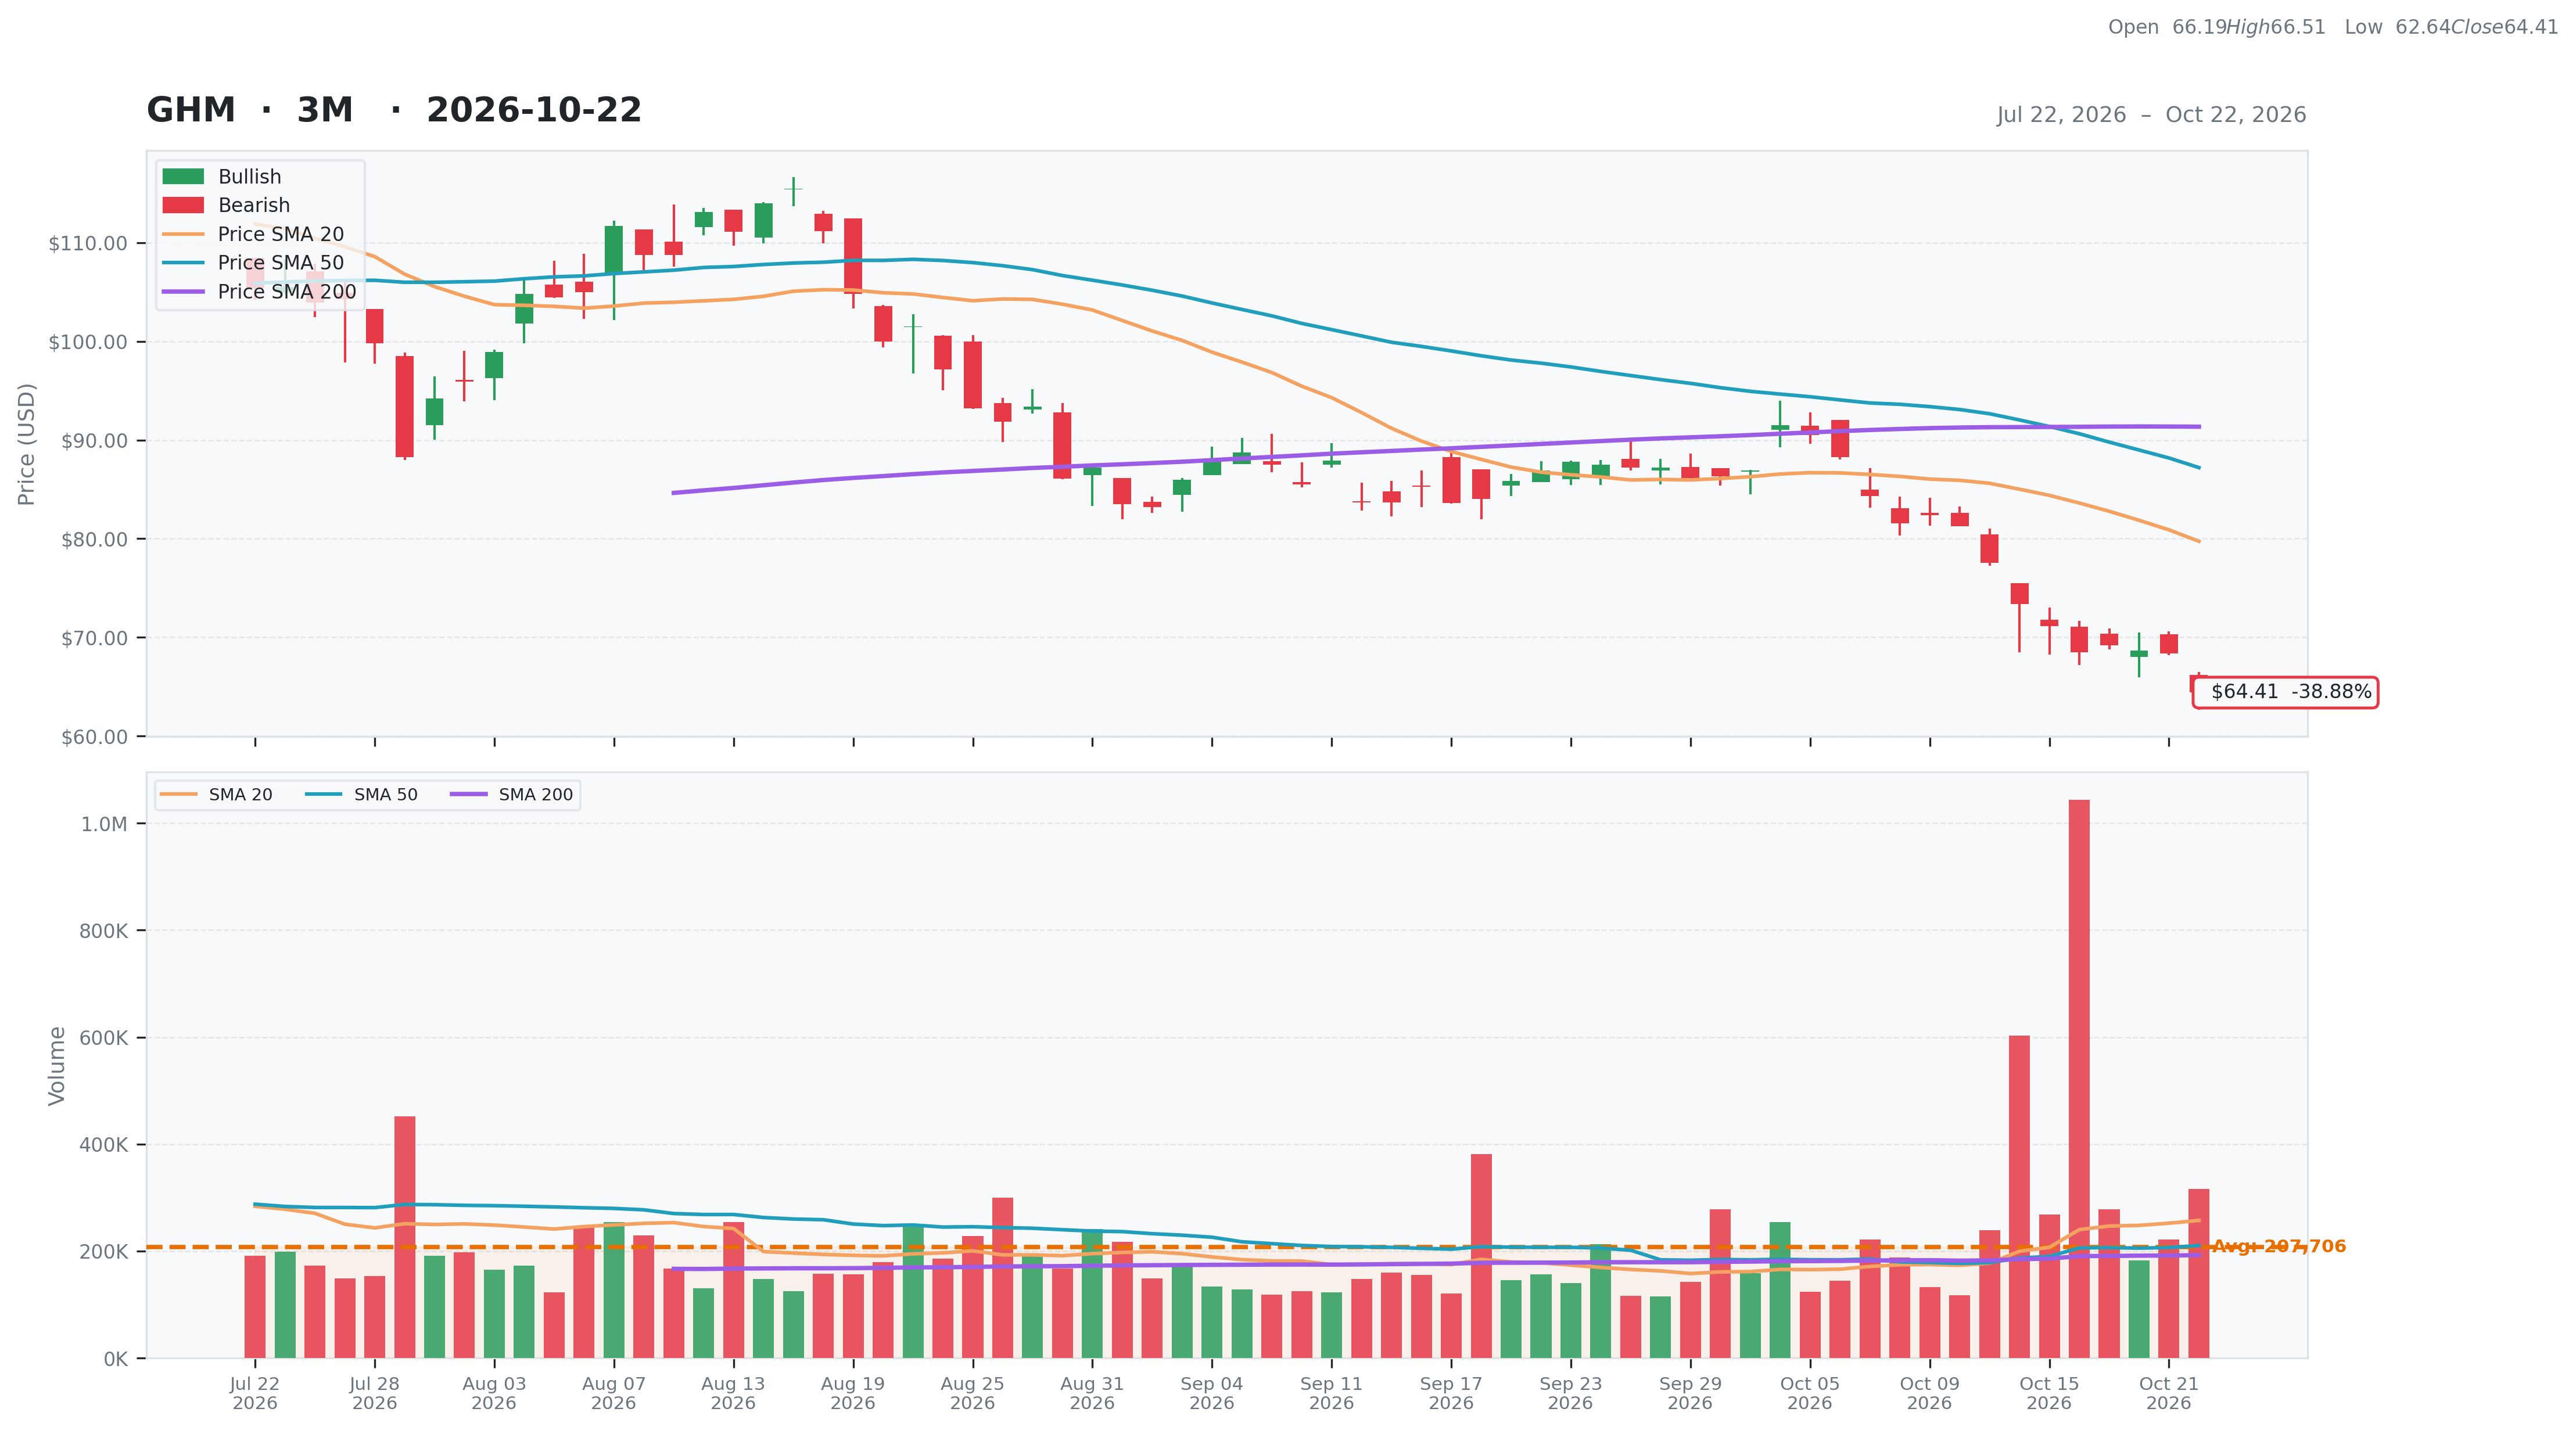
| Total | 37 | Current | $64.41 | 52W High | $123.79 -47.97% | Relative Strength | -0.24 | Beta | 1.08 |
| Business Quality | 6 | Weekly | $71.15 -9.47% | 52W Low | $53.56 20.26% | 3M | -0.38 | Short % | 0.09 |
| Financial Strength | 13 | Monthly | $86.94 -25.91% | Above 50DMA | $87.20 -26.14% | 6M | -0.34 | Risk Score | 4 |
| Growth Outlook | 4 | Quarterly | $103.93 -38.03% | Above 200DMA | $91.35 -29.49% | 9M | -0.14 | ||
| Momentum | 3 | Yearly | $59.25 8.71% | 12M | 0.03 | ||||
| Valuation | Financial Strength | Growth/Profitability | |||
|---|---|---|---|---|---|
| Trailing P/E | 66.49 | Cash | 27M | Revenue Growth | 0.29% |
| Forward P/E | 30.09 | Debt | 7M | Earnings Growth | -0.21% |
| PEG Ratio | 2.07 | Debt/Equity | 3.53 | Qtr Earnings Growth | -0.15% |
| Price/Sales | 3.08 | Current Ratio | 1.23 | Gross Margin | 0.23% |
| Price/Book | 4.18 | Quick Ratio | 0.89 | Operating Margin | 0.07% |
| EV/Revenue | 3.00 | Operating CF | 6M | Profit Margin | 0.05% |
| EV/EBITDA | 31.86 | Free CF | -6M | EBITDA Margin | 0.09% |
| Ent Value | 784M | Return on Assets | 0.03% | ||
| Return on Equity | 0.07% | ||||
| Technical | Volume & Bollinger Bands | Analyst | |||
|---|---|---|---|---|---|
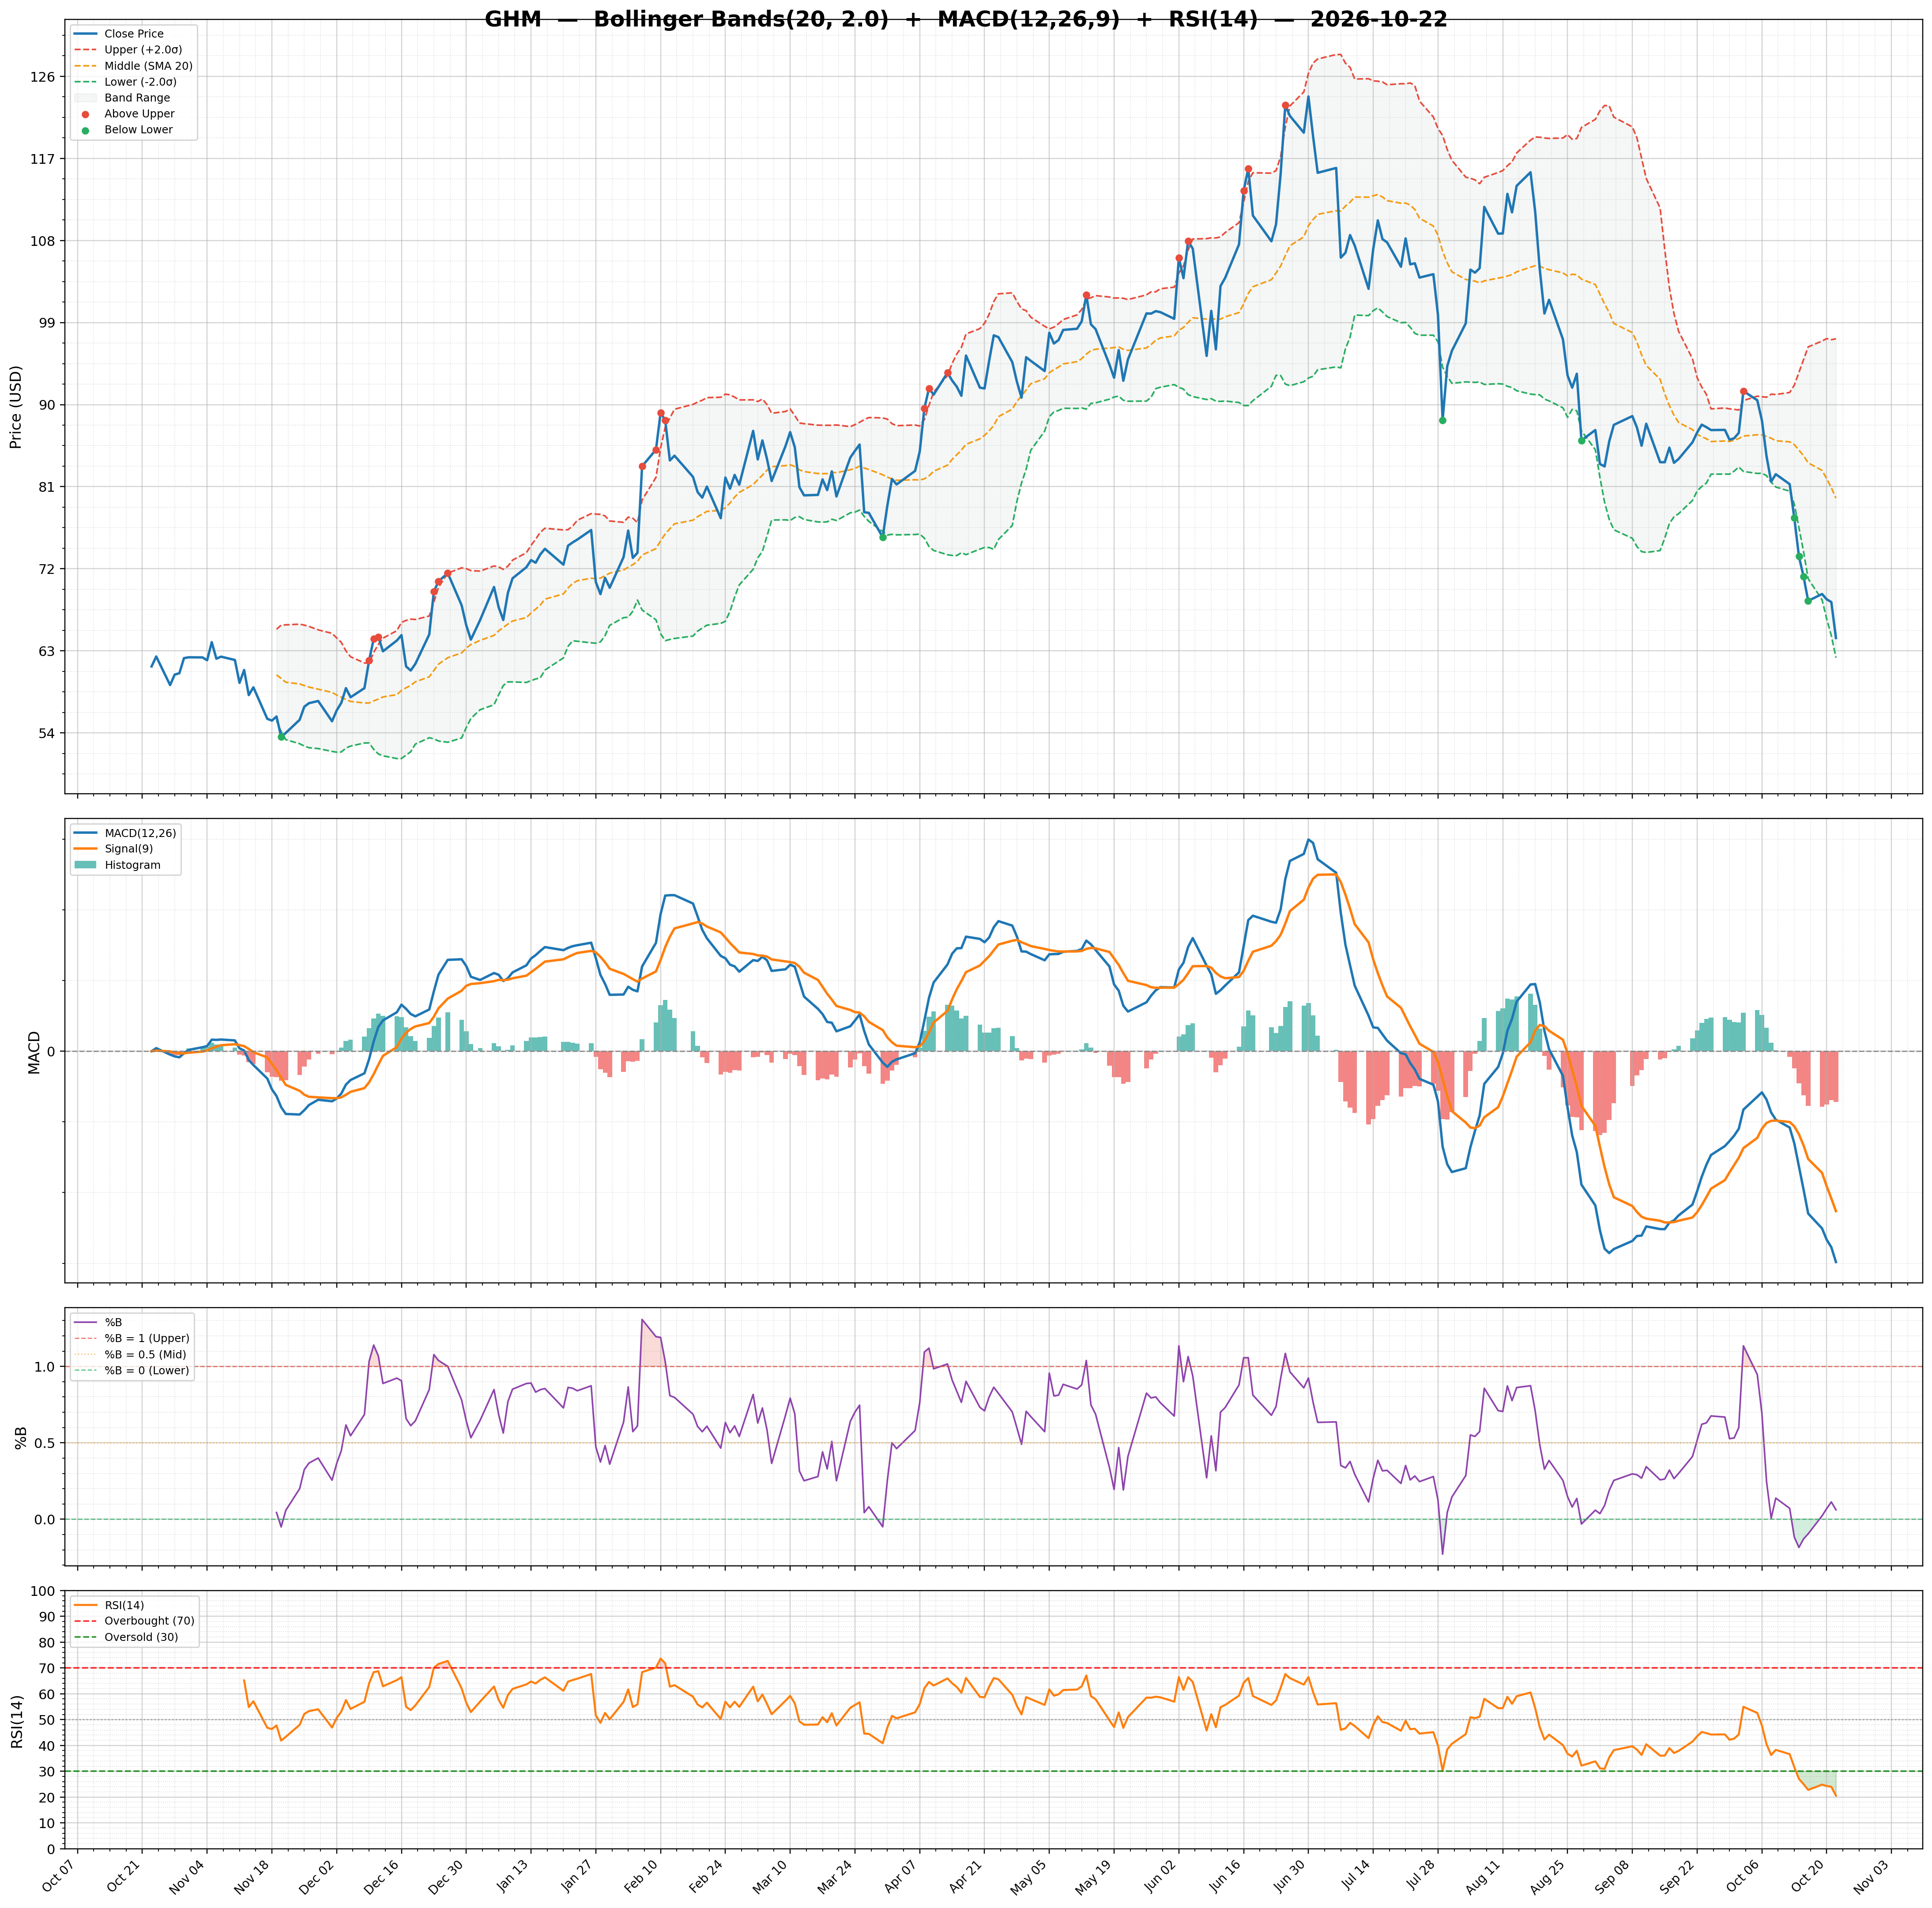
| RSI | 20.56 | Volume | 0.95M | Rating | buy |
| Previous RSI | 23.99 | Avg Volume 20D | 0.26M | Target Mean | $125.60 |
| RSI Trend | Down | Relative Volume | 1.38 | Target High | $135.00 |
| MACD | -5.96 | Lower Band | 62.26 | Target Low | $115.00 |
| MACD Signal | -4.53 | Middle Band | 79.74 | Target Median | $128.00 |
| Histogram | -1.44 | Upper Band | 97.22 | Analysts | 5 |
| Previous Histogram | -1.38 | Bandwidth | 43.850 | Upside | 83.41% |
| Histogram Trend | Decreasing | %B | 0.06 | ||