Happen, Inc. (HAPN)
Financial Services • Banks - Regional • $14.5 • MCap: 1,672,254,080
https://www.happen.com • Happen, Inc. operates as a bank holding company that provides financial and lending services in the United States. The company offers deposit products, including savings accounts, checking accounts, money market accounts, and certificates of deposit; consumer loan products, such as unsecured loans, fixed-rate and fixed-term consumer loans, major purchase finance, and auto refinance; personal loans for credit card refinancing and debt consolidation; financing for health and wellness; and balance transfer, credit card and debt consolidation, emergency, funeral, home improvement, moving, small, and wedding loans. It also provides commercial lending, including small business and SBA loans. In addition, the company operates a lending marketplace platform. It serves individual consumers and small businesses. The company was formerly known as LendingClub Corporation and changed its name to Happen, Inc. in June 2026. Happen, Inc. was incorporated in 2006 and is headquartered in San Francisco, California.
ET
| Score | Price | 52 Week & Averages | Relative Strength | Risk | |||||
|---|---|---|---|---|---|---|---|---|---|
| Total | 72 | Current | $14.50 | 52W High | $21.58 -32.78% | Relative Strength | -0.22 | Beta | 1.89 |
| Business Quality | 20 | Weekly | $14.67 -1.12% | 52W Low | $13.32 8.90% | 3M | -0.20 | Short % | 0.06 |
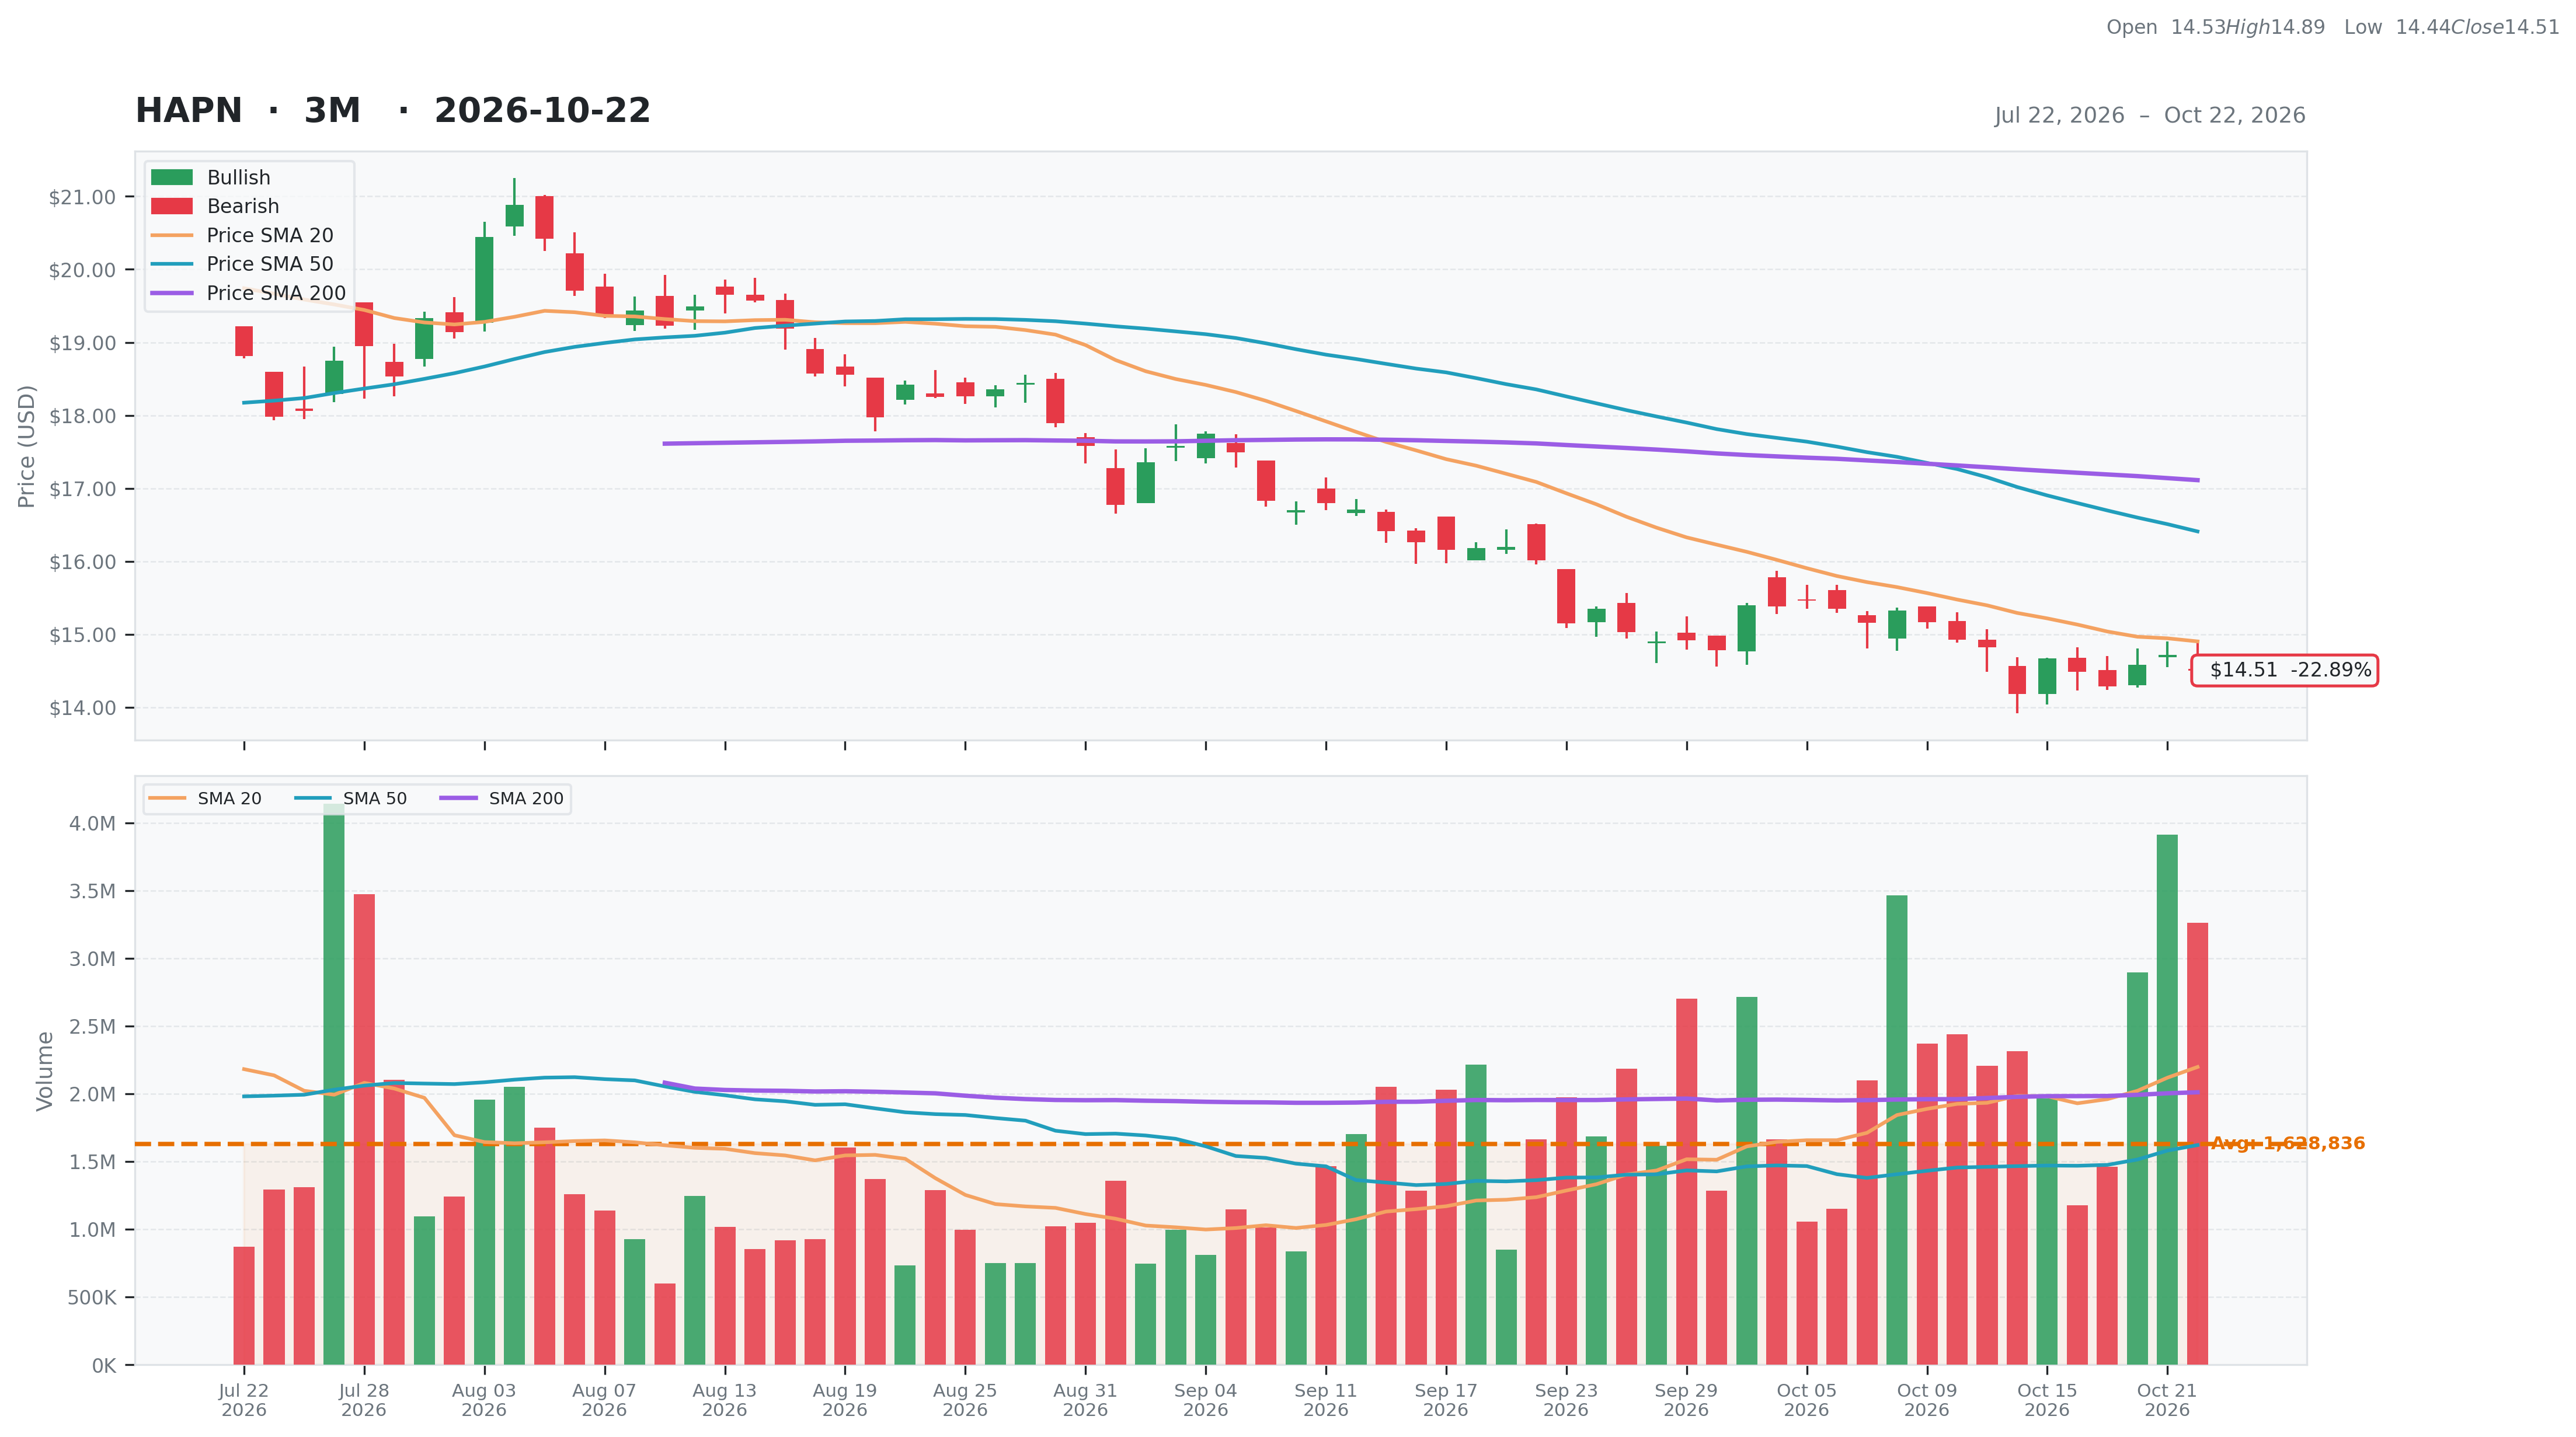
| Financial Strength | 16 | Monthly | $16.01 -9.40% | Above 50DMA | $16.41 -11.61% | 6M | -0.16 | Risk Score | 2 |
| Growth Outlook | 15 | Quarterly | $18.06 -19.68% | Above 200DMA | $17.11 -15.24% | 9M | -0.33 | ||
| Momentum | 3 | Yearly | $18.33 -20.87% | 12M | -0.21 | ||||
| Valuation | Financial Strength | Growth/Profitability | |||
|---|---|---|---|---|---|
| Trailing P/E | 8.73 | Cash | 913M | Revenue Growth | 0.06% |
| Forward P/E | 6.11 | Debt | 11M | Earnings Growth | 0.52% |
| PEG Ratio | N/A | Debt/Equity | 0.72 | Qtr Earnings Growth | 0.52% |
| Price/Sales | 1.20 | Current Ratio | 3.45 | Gross Margin | 0.42% |
| Price/Book | 1.07 | Quick Ratio | 2.38 | Operating Margin | 0.21% |
| EV/Revenue | 0.55 | Operating CF | -2,866M | Profit Margin | 0.14% |
| EV/EBITDA | 2.44 | Free CF | 1,209M | EBITDA Margin | 0.23% |
| Ent Value | 771M | Return on Assets | 0.01% | ||
| Return on Equity | 0.13% | ||||
| Technical | Volume & Bollinger Bands | Analyst | |||
|---|---|---|---|---|---|
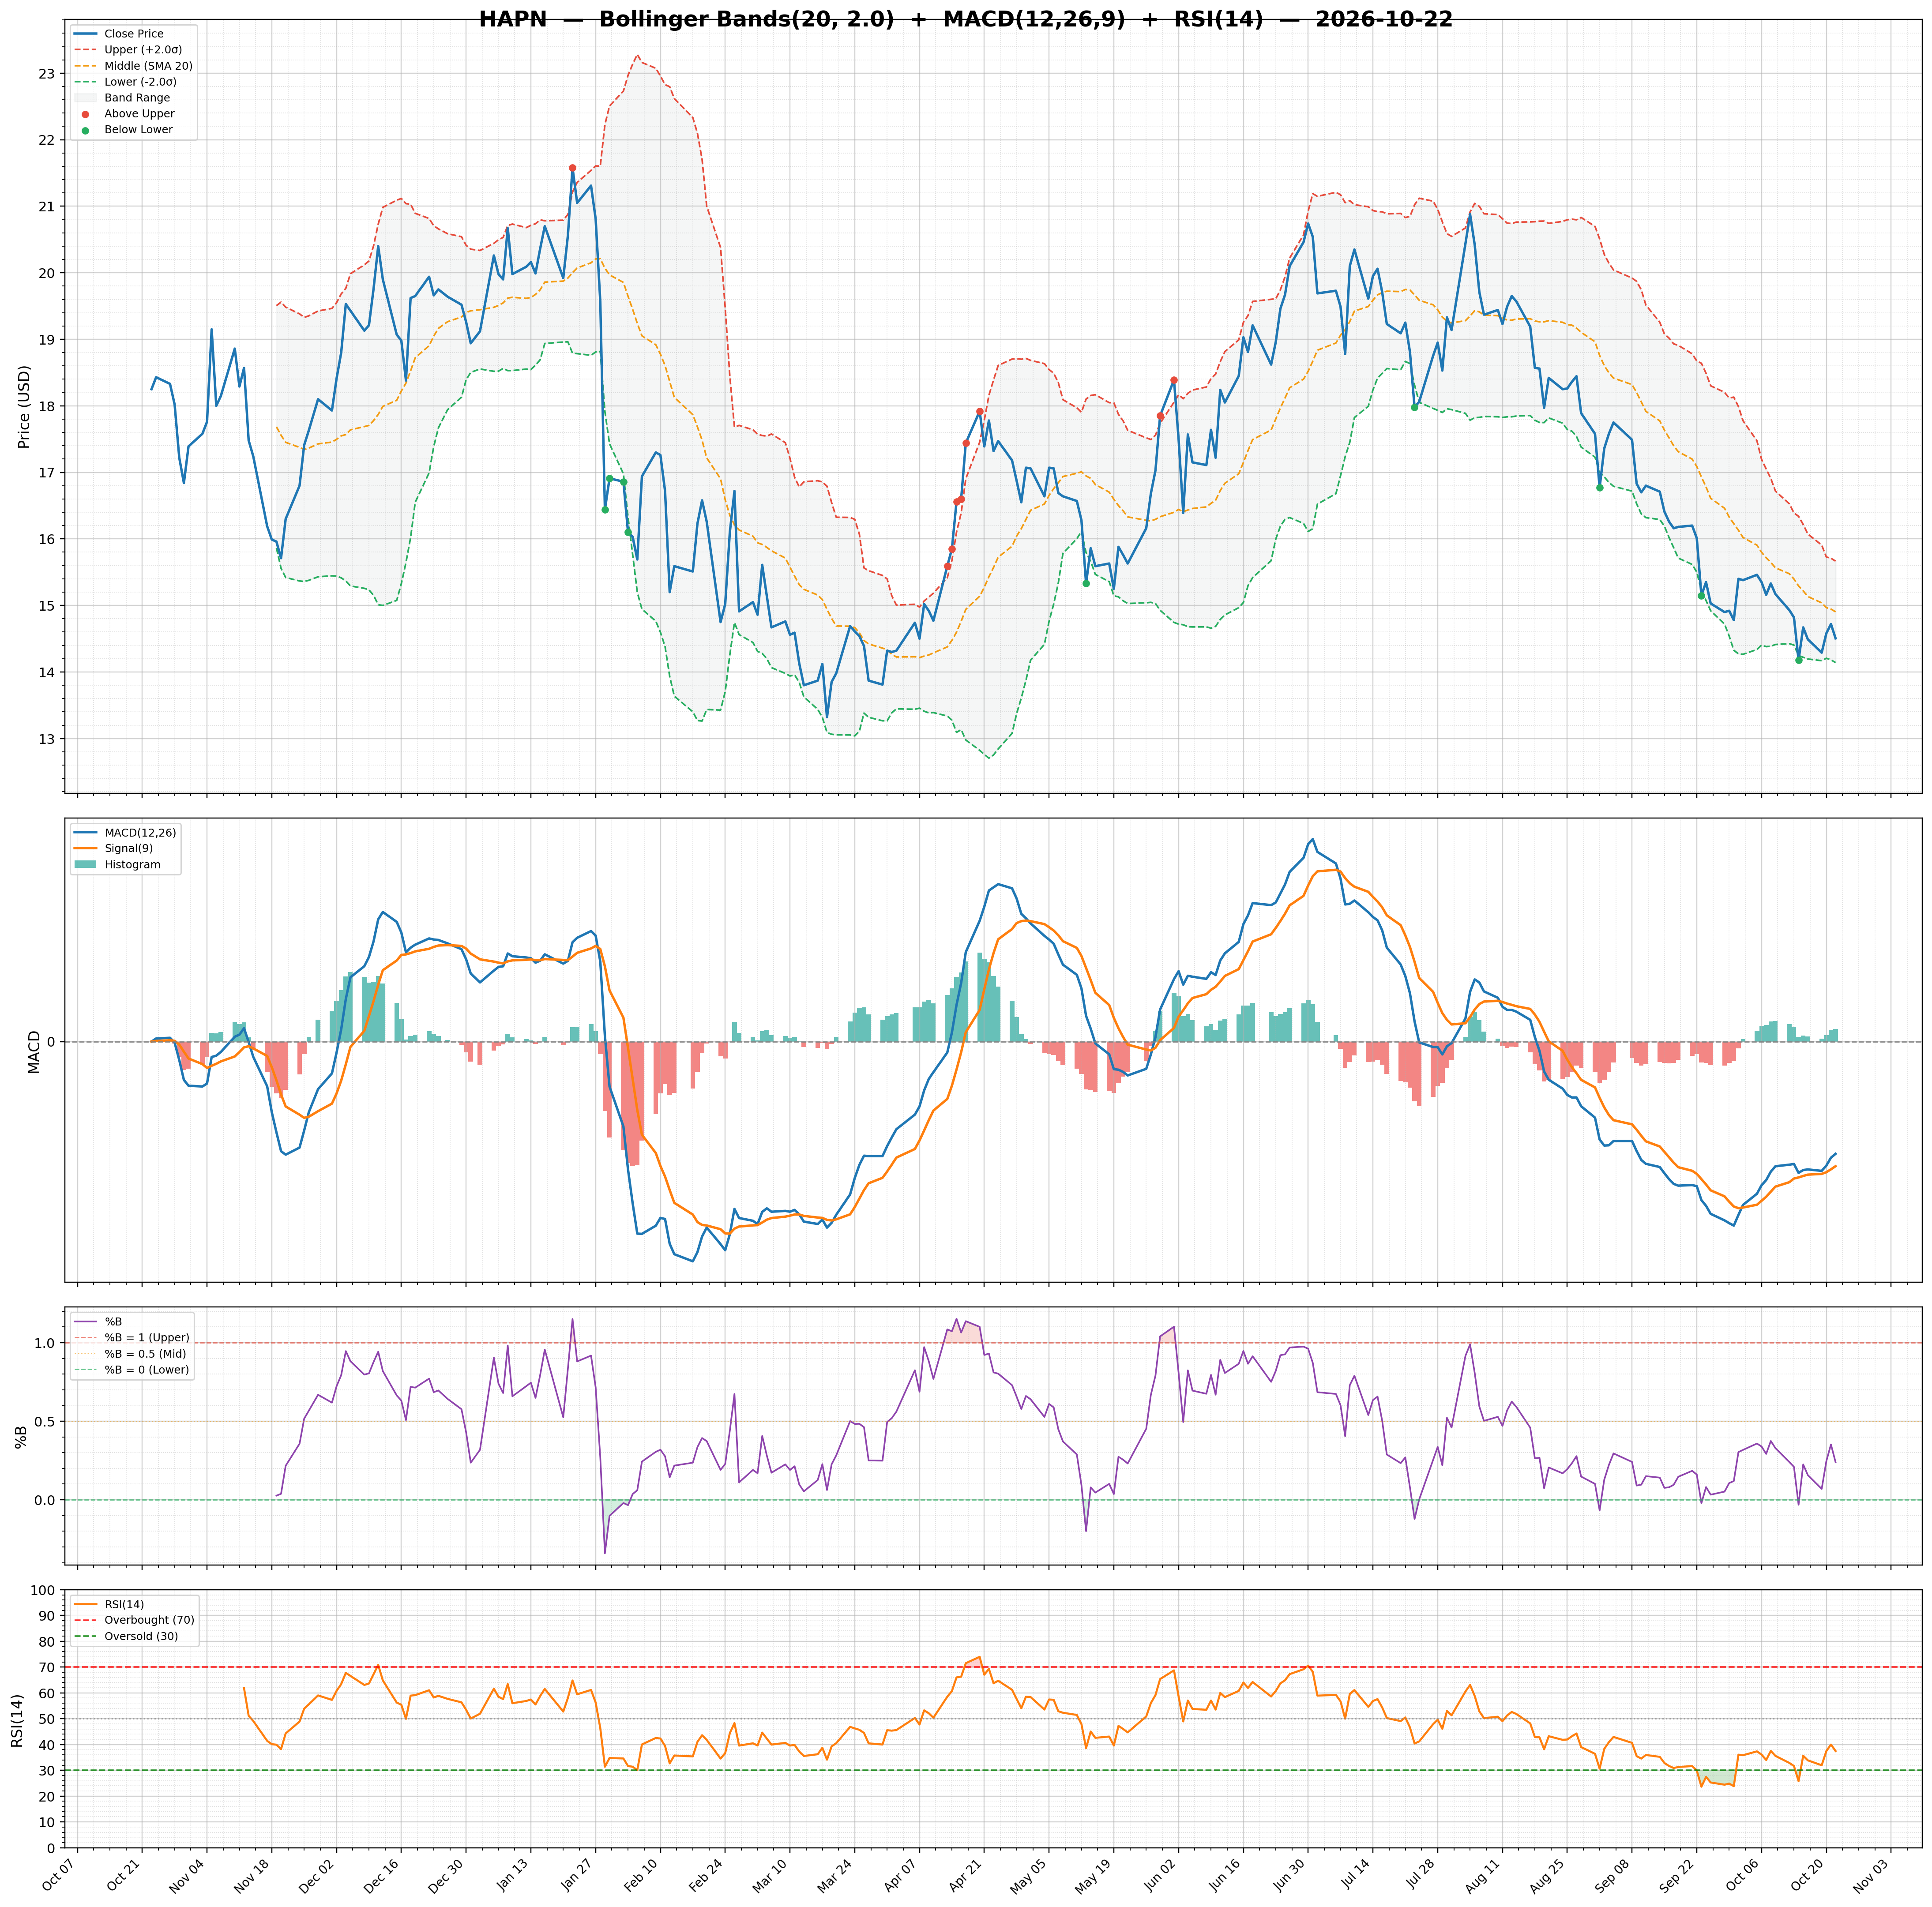
| RSI | 37.48 | Volume | 1.18M | Rating | strong_buy |
| Previous RSI | 39.98 | Avg Volume 20D | 2.2M | Target Mean | $24.50 |
| RSI Trend | Down | Relative Volume | 1.61 | Target High | $29.00 |
| MACD | -0.52 | Lower Band | 14.14 | Target Low | $20.00 |
| MACD Signal | -0.58 | Middle Band | 14.90 | Target Median | $25.00 |
| Histogram | 0.06 | Upper Band | 15.67 | Analysts | 8 |
| Previous Histogram | 0.05 | Bandwidth | 10.240 | Upside | 69.08% |
| Histogram Trend | Increasing | %B | 0.24 | ||