Hudson Technologies, Inc. (HDSN)
Basic Materials • Specialty Chemicals • $5.36 • MCap: 210,863,632
https://www.hudsontech.com • Hudson Technologies, Inc., through its subsidiary, Hudson Technologies Company, provides solutions to recurring problems within the refrigeration industry in the United States. The company offers refrigerant and industrial gas; refrigerant management services comprising primarily of reclamation of refrigerants, laboratory testing through its laboratory, and banking storage services; and RefrigerantSide Services comprising system decontamination to remove moisture, oils, and other contaminants intended to restore systems to designed capacity. It also provides diagnostic services for use in the prediction of potential problems in air conditioning, process cooling, and refrigeration systems; Chiller Chemistry, which integrates several fluid tests of an operating system and the corresponding laboratory results into an engineering report; Fluid Chemistry for use in identification of systems that require further examination; and SmartEnergy OPS, a system for measuring, modifying, and improving the efficiency of energy systems, including air conditioning and refrigeration systems, in industrial and commercial applications. In addition, the company provides a snapshot of a packaged chiller's operating efficiency and health through ChillSmart, a maintenance tool. Further, it is involved in the generation of carbon offset projects. The company serves commercial, industrial, and governmental customers, as well as refrigerant wholesalers, distributors, contractors, and refrigeration equipment manufacturers. Hudson Technologies, Inc. was founded in 1990 and is headquartered in Woodcliff Lake, New Jersey.
ET
| Score | Price | 52 Week & Averages | Relative Strength | Risk | |||||
|---|---|---|---|---|---|---|---|---|---|
| Total | 47 | Current | $5.36 | 52W High | $9.51 -43.64% | Relative Strength | -0.24 | Beta | 0.83 |
| Business Quality | 6 | Weekly | $5.04 6.35% | 52W Low | $4.84 10.74% | 3M | -0.15 | Short % | 0.06 |
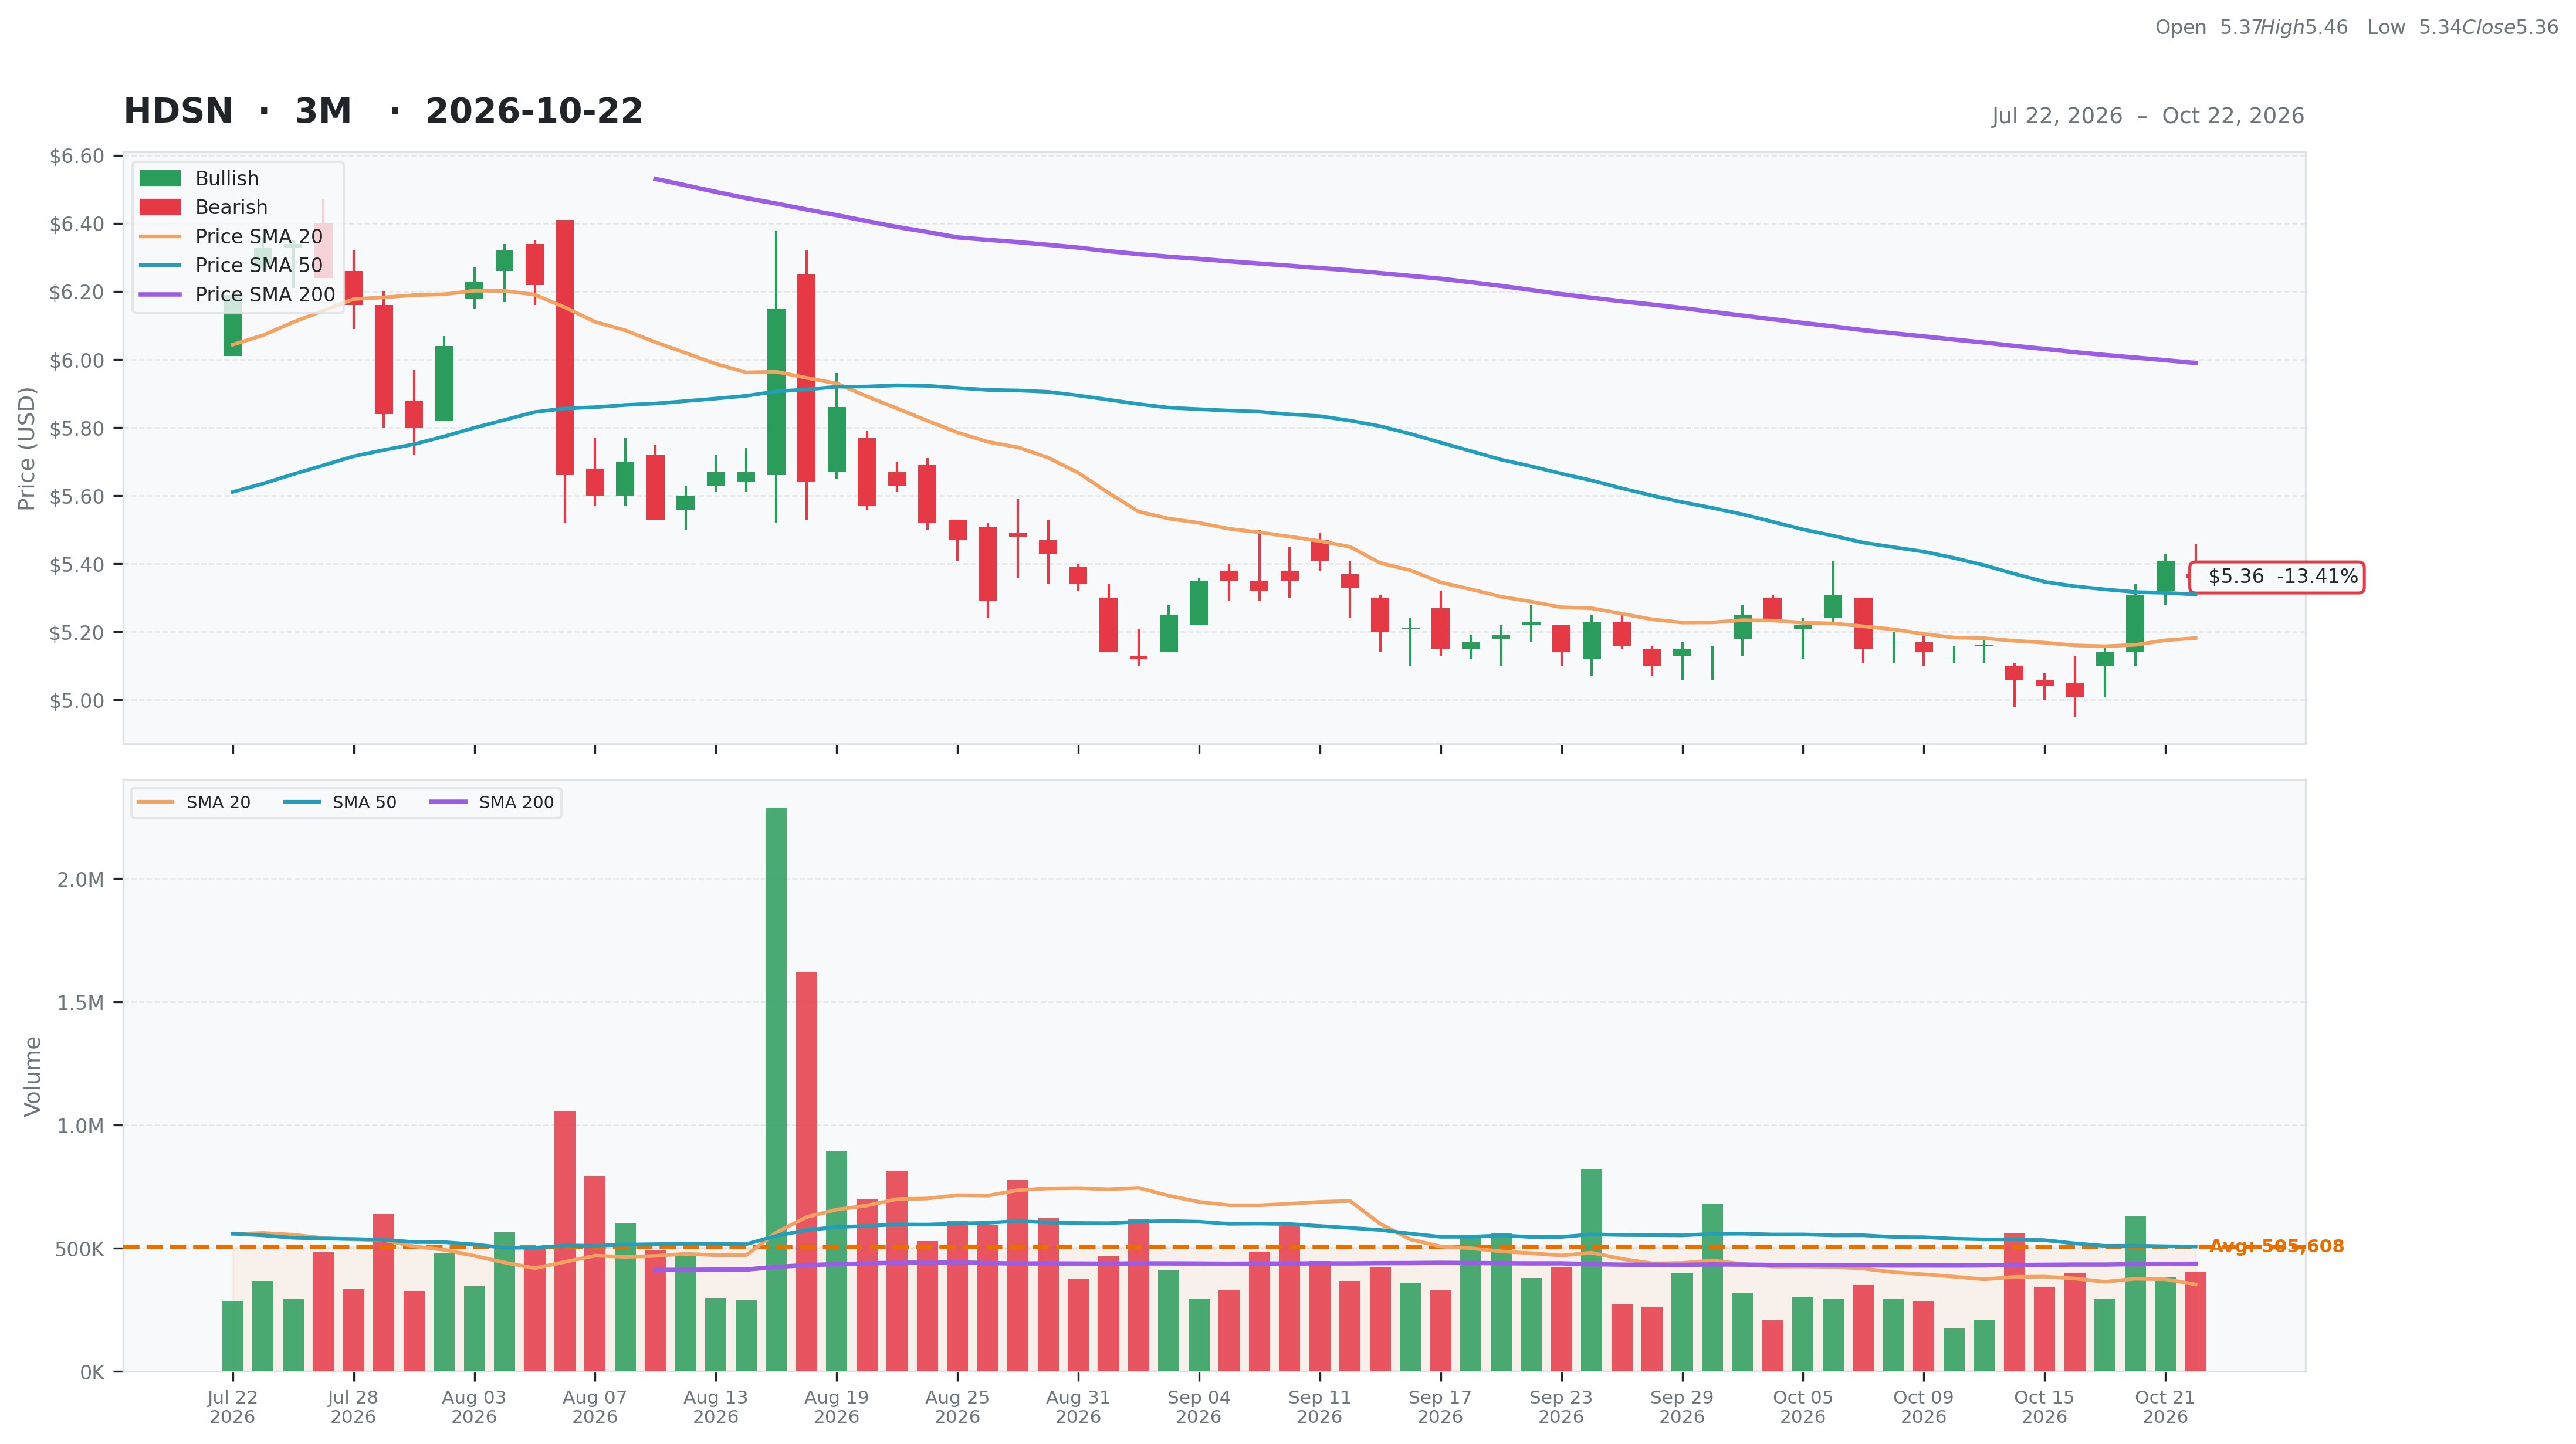
| Financial Strength | 11 | Monthly | $5.23 2.49% | Above 50DMA | $5.31 0.94% | 6M | -0.16 | Risk Score | 7 |
| Growth Outlook | 4 | Quarterly | $6.34 -15.46% | Above 200DMA | $5.99 -10.52% | 9M | -0.28 | ||
| Momentum | 2 | Yearly | $9.36 -42.74% | 12M | -0.44 | ||||
| Valuation | Financial Strength | Growth/Profitability | |||
|---|---|---|---|---|---|
| Trailing P/E | 25.05 | Cash | 26M | Revenue Growth | 0.08% |
| Forward P/E | 17.58 | Debt | 5M | Earnings Growth | -0.49% |
| PEG Ratio | 0.39 | Debt/Equity | 1.96 | Qtr Earnings Growth | -0.51% |
| Price/Sales | 0.82 | Current Ratio | 3.23 | Gross Margin | 0.23% |
| Price/Book | 0.87 | Quick Ratio | 1.12 | Operating Margin | 0.09% |
| EV/Revenue | 0.74 | Operating CF | -30M | Profit Margin | 0.04% |
| EV/EBITDA | 8.66 | Free CF | -39M | EBITDA Margin | 0.09% |
| Ent Value | 190M | Return on Assets | 0.03% | ||
| Return on Equity | 0.04% | ||||
| Technical | Volume & Bollinger Bands | Analyst | |||
|---|---|---|---|---|---|
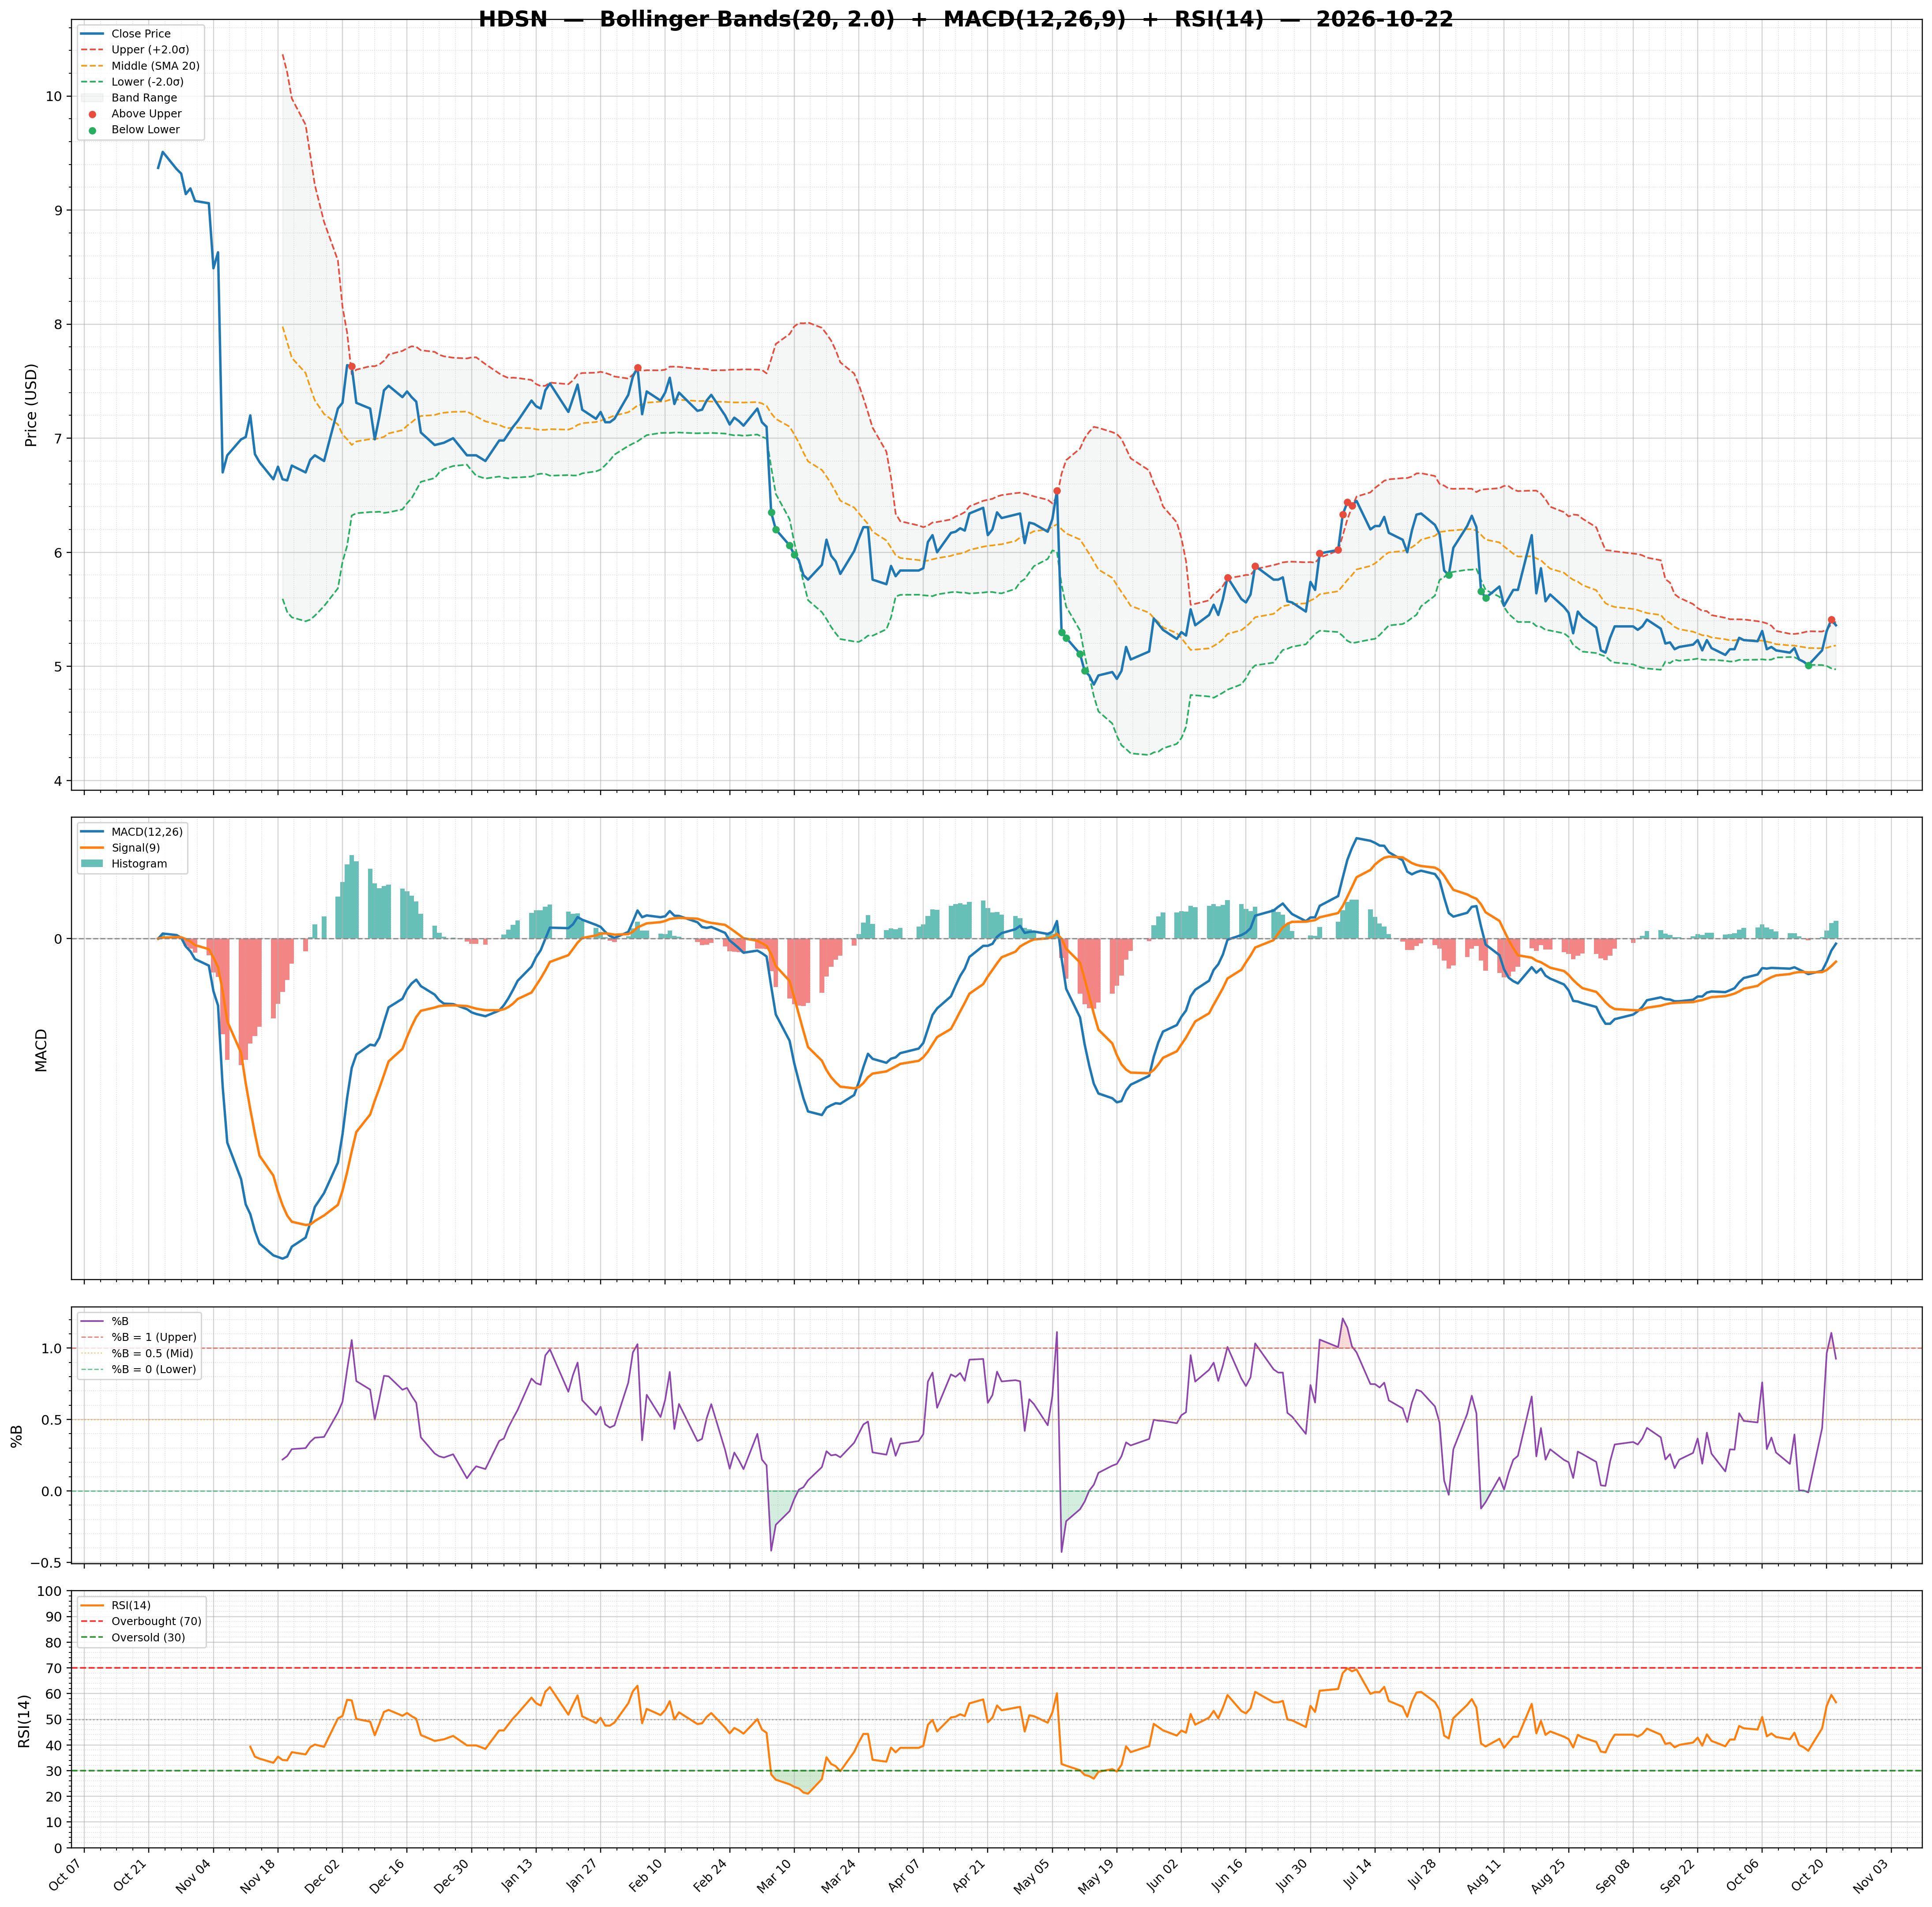
| RSI | 56.62 | Volume | 0.4M | Rating | none |
| Previous RSI | 59.50 | Avg Volume 20D | 0.35M | Target Mean | $7.31 |
| RSI Trend | Down | Relative Volume | 1.03 | Target High | $8.00 |
| MACD | -0.01 | Lower Band | 4.97 | Target Low | $7.00 |
| MACD Signal | -0.05 | Middle Band | 5.18 | Target Median | $7.12 |
| Histogram | 0.04 | Upper Band | 5.39 | Analysts | 4 |
| Previous Histogram | 0.03 | Bandwidth | 8.070 | Upside | 45.96% |
| Histogram Trend | Increasing | %B | 0.93 | ||