Hims & Hers Health, Inc. (HIMS)
Healthcare • Drug Manufacturers - Specialty & Generic • $29.13 • MCap: 6,549,107,200
https://www.hims.com • Hims & Hers Health, Inc. operates as a consumer-first health and wellness platform that connects consumers to licensed healthcare professionals in the United States, the United Kingdom, Canada, Germany, the Republic of Ireland, France, Spain, Australia, and internationally. The company offers a range of curated prescription and non-prescription health and wellness products and services available to purchase on its websites and mobile application directly by customers. It also provides personalized health and wellness products; over-the-counter drug and device products, cosmetics, and supplement products primarily focusing on general wellness, skincare, sexual health and wellness, and hair care under the Hims & Hers brand name; and laboratory testing services to measure a set of biomarkers. Additionally, it offers medical consultation, post-consultation support services, and delivery of laboratory testing results services. Further, the company provides treatments and products for various chronic conditions related to hormone health, weight loss, dermatology, and mental health. The company offers its products through retail partnerships, in stores, and online. The company was formerly known as Hims, Inc. and changed its name to Hims & Hers Health, Inc. in January 2021. The company was founded in 2017 and is based in San Francisco, California.
Watch List
| Score | Price | 52 Week & Averages | Relative Strength | Risk | |||||
|---|---|---|---|---|---|---|---|---|---|
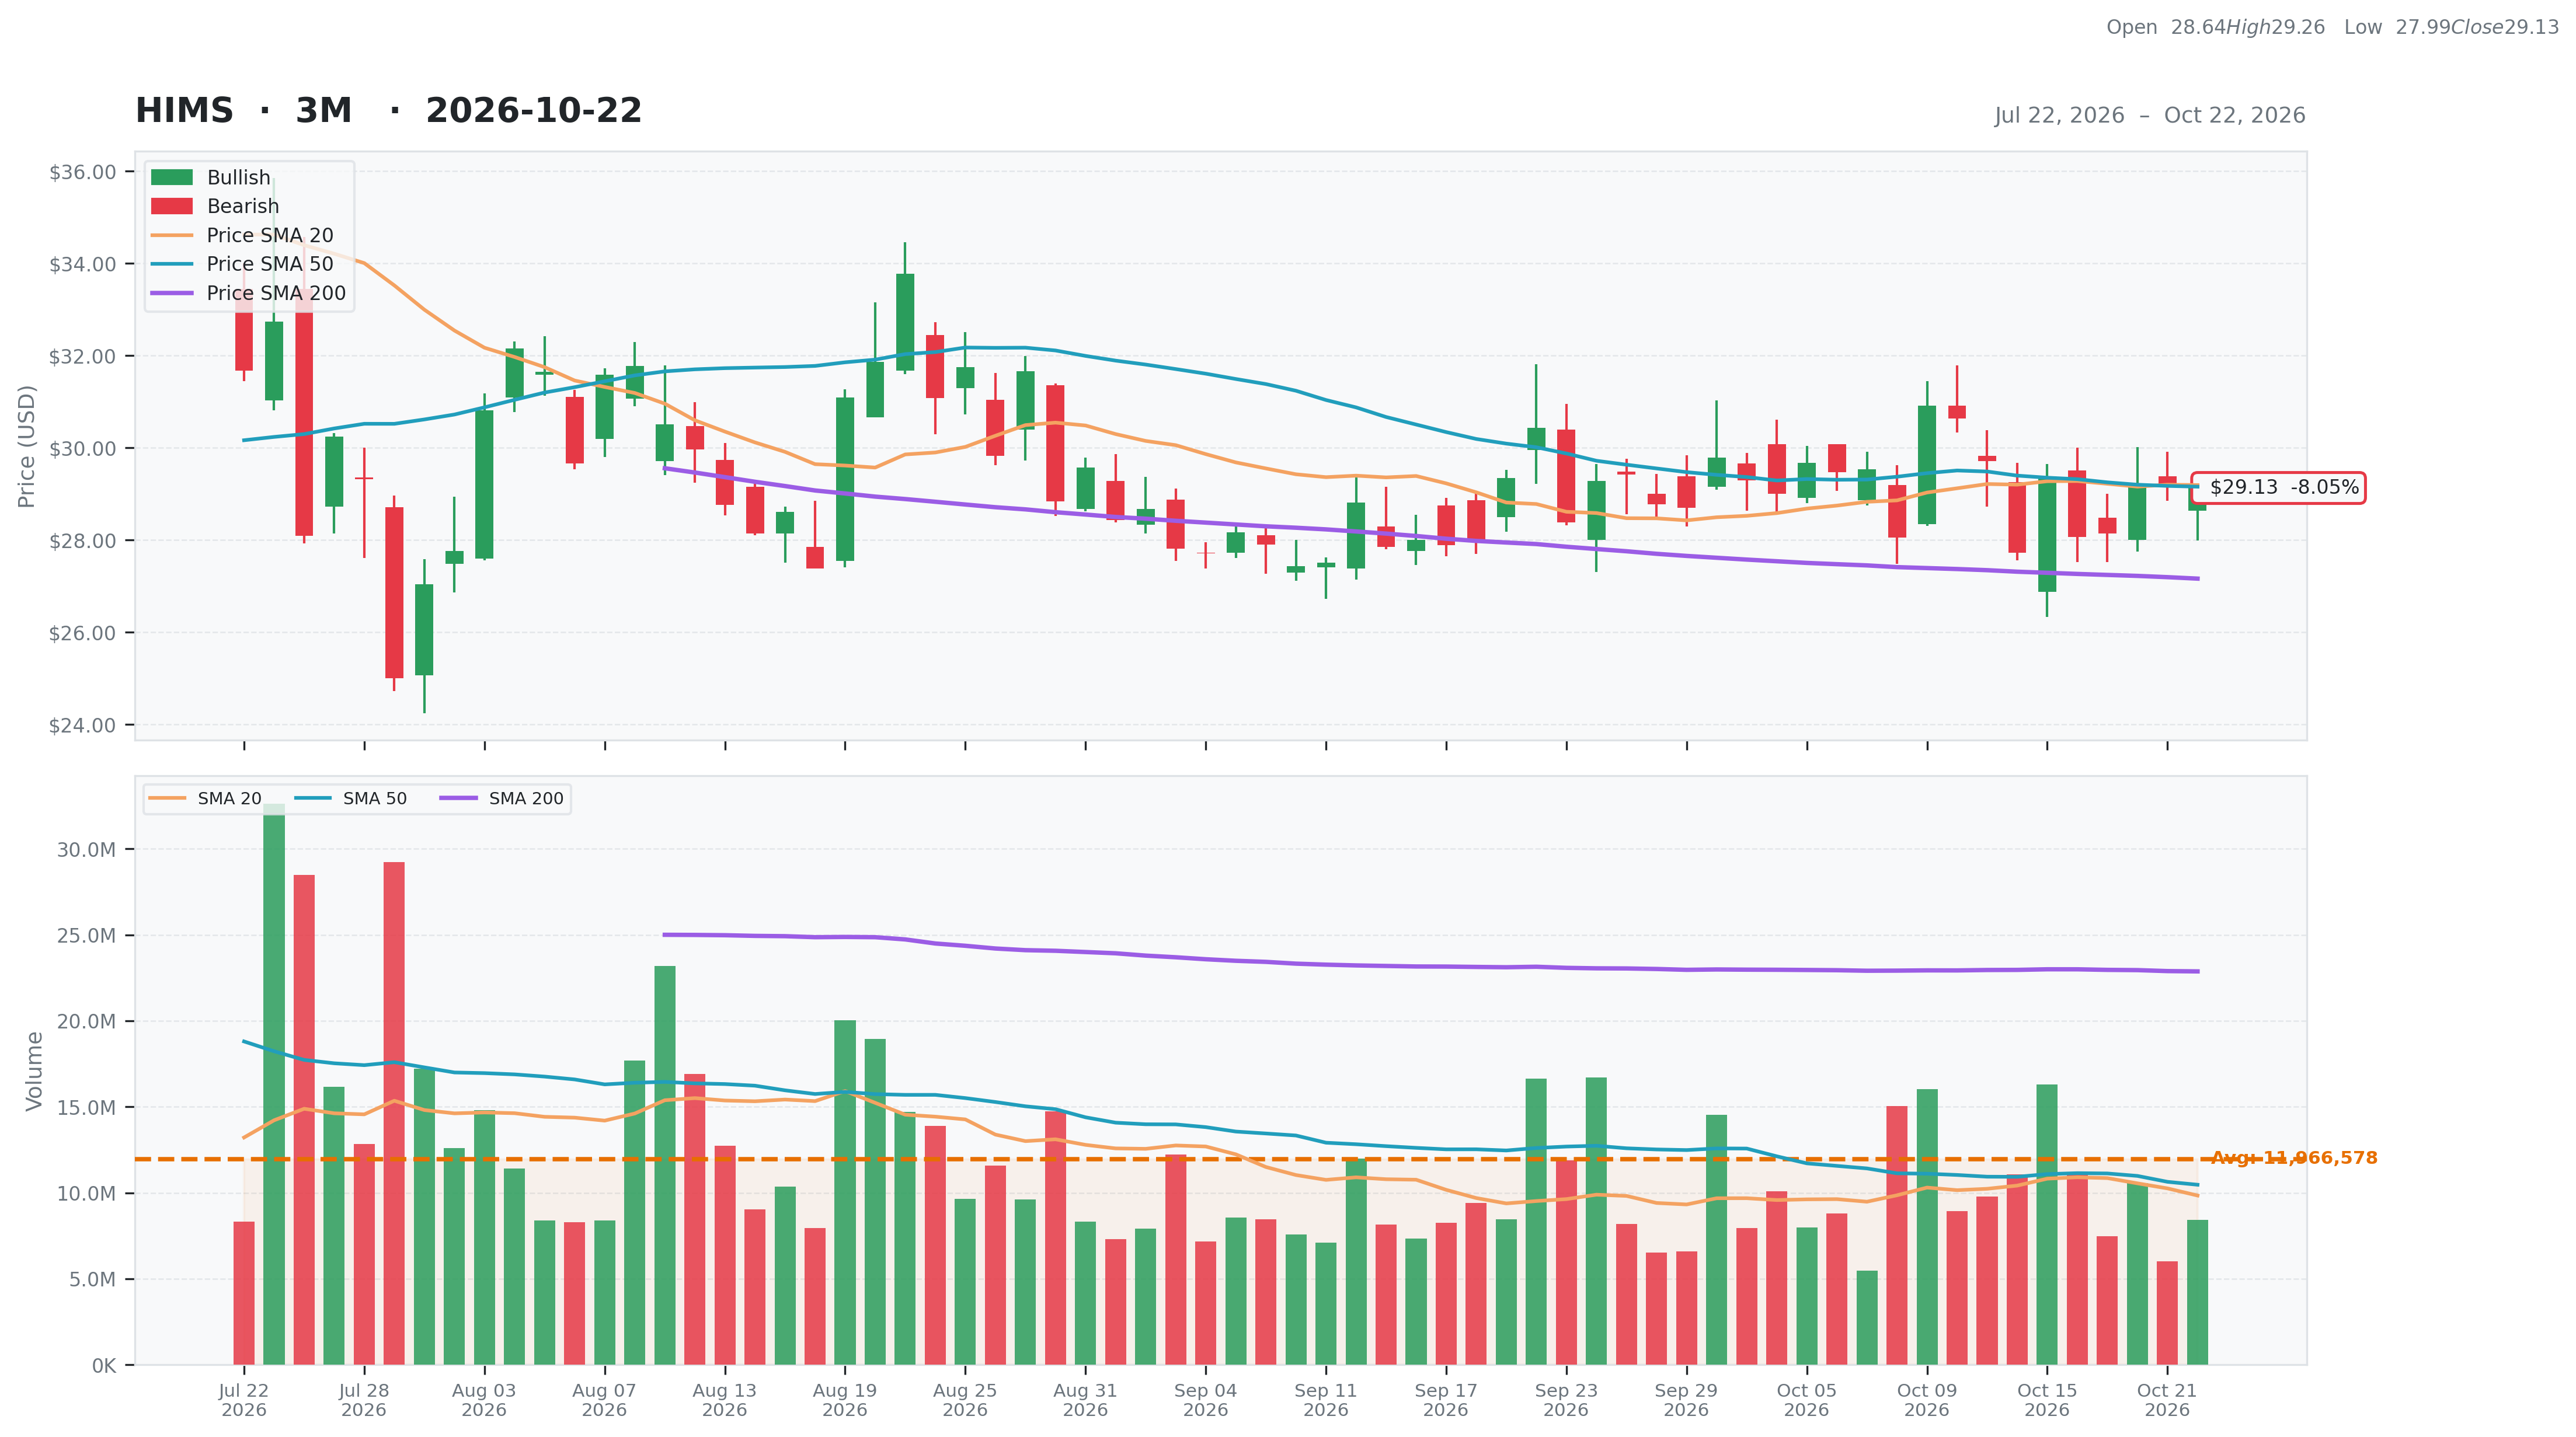
| Total | 26 | Current | $29.13 | 52W High | $48.78 -40.28% | Relative Strength | -0.07 | Beta | 2.43 |
| Business Quality | 10 | Weekly | $29.38 -0.85% | 52W Low | $14.52 100.62% | 3M | 0.04 | Short % | 0.28 |
| Financial Strength | 9 | Monthly | $30.43 -4.27% | Above 50DMA | $29.16 -0.10% | 6M | 0.03 | Risk Score | 9 |
| Growth Outlook | 1 | Quarterly | $28.09 3.70% | Above 200DMA | $27.16 7.23% | 9M | -0.05 | ||
| Momentum | 1 | Yearly | $48.23 -39.60% | 12M | -0.40 | ||||
| Valuation | Financial Strength | Growth/Profitability | |||
|---|---|---|---|---|---|
| Trailing P/E | N/A | Cash | 841M | Revenue Growth | 0.38% |
| Forward P/E | 38.07 | Debt | 1,546M | Earnings Growth | N/A |
| PEG Ratio | 2.68 | Debt/Equity | 477.13 | Qtr Earnings Growth | N/A |
| Price/Sales | 2.54 | Current Ratio | 0.93 | Gross Margin | 0.70% |
| Price/Book | 20.21 | Quick Ratio | 0.82 | Operating Margin | -0.13% |
| EV/Revenue | 2.81 | Operating CF | 263M | Profit Margin | -0.06% |
| EV/EBITDA | -712.81 | Free CF | 849M | EBITDA Margin | 0.00% |
| Ent Value | 7,254M | Return on Assets | -0.02% | ||
| Return on Equity | -0.32% | ||||
| Technical | Volume & Bollinger Bands | Analyst | |||
|---|---|---|---|---|---|
| RSI | 50.05 | Volume | 10.98M | Rating | hold |
| Previous RSI | 50.39 | Avg Volume 20D | 9.84M | Target Mean | $31.15 |
| RSI Trend | Down | Relative Volume | 0.84 | Target High | $42.00 |
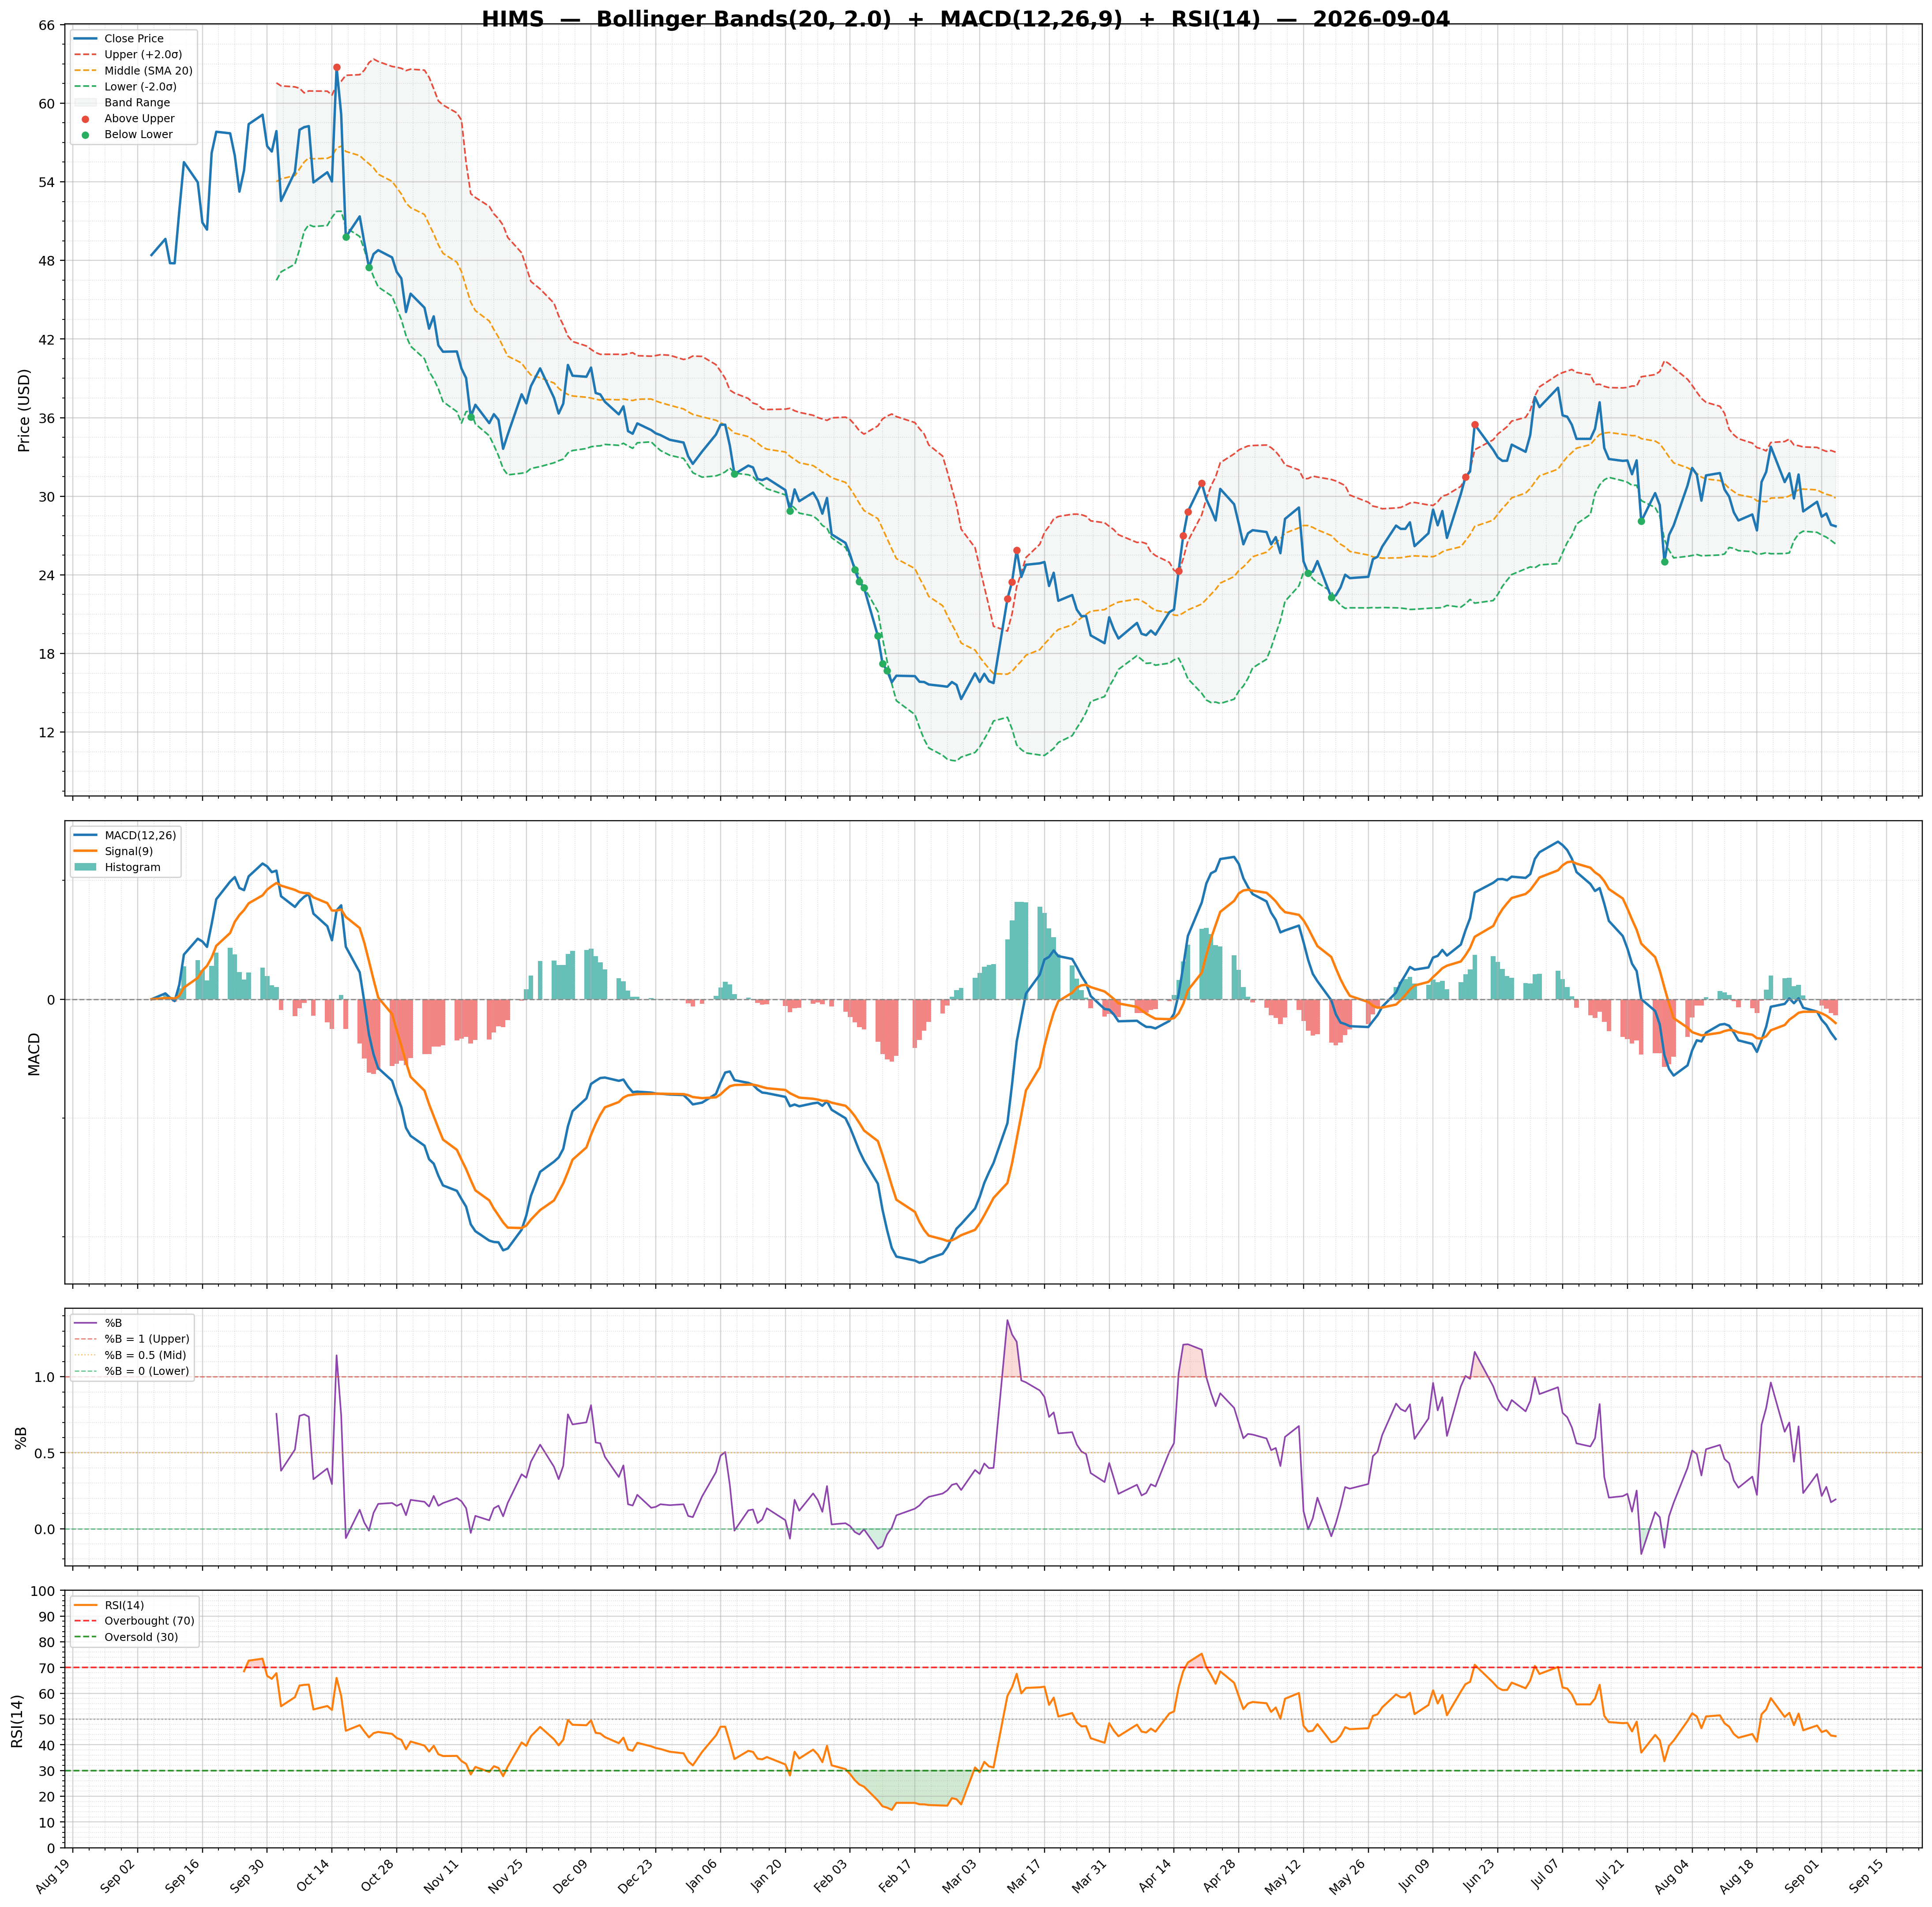
| MACD | -0.07 | Lower Band | 27.57 | Target Low | $23.00 |
| MACD Signal | -0.05 | Middle Band | 29.19 | Target Median | $31.00 |
| Histogram | -0.02 | Upper Band | 30.81 | Analysts | 13 |
| Previous Histogram | -0.04 | Bandwidth | 11.100 | Upside | 10.99% |
| Histogram Trend | Increasing | %B | 0.48 | ||