Harmonic Inc. (HLIT)
Technology • Communication Equipment • $10.09 • MCap: 1,165,920,256
https://www.harmonicinc.com • Harmonic Inc., together with its subsidiaries, provides broadband access solutions worldwide. The company provides software-based broadband access solution, including cOS software-based broadband access solutions to broadband operators, an end-to-end solution consisting of virtualized cloud-native software; hardware products include Oyster, Ripple and SeaStar DAA nodes; Reef and Wave PHY shelf products; pebble remote PHY Devices; and fin, pearl and pier OLT modules and devices; and cOS software-based broadband access solutions to broadband operators; and cOS central cloud services, a subscription service for cOS customers. It also provides technical support and professional services, such as maintenance and support, consulting, implementation, integration services, program management, technical design and planning, building and site preparation, integration and equipment installation, end-to-end system testing, and training, as well as SaaS-related support and deployment. It sells its products through its direct sales force, as well as through independent resellers and systems integrators. It also serves cable and telco operators. The company was incorporated in 1988 and is headquartered in San Jose, California.
Reversal Strategy
Notes
10/23/2026
BUY
| Score | Price | 52 Week & Averages | Relative Strength | Risk | |||||
|---|---|---|---|---|---|---|---|---|---|
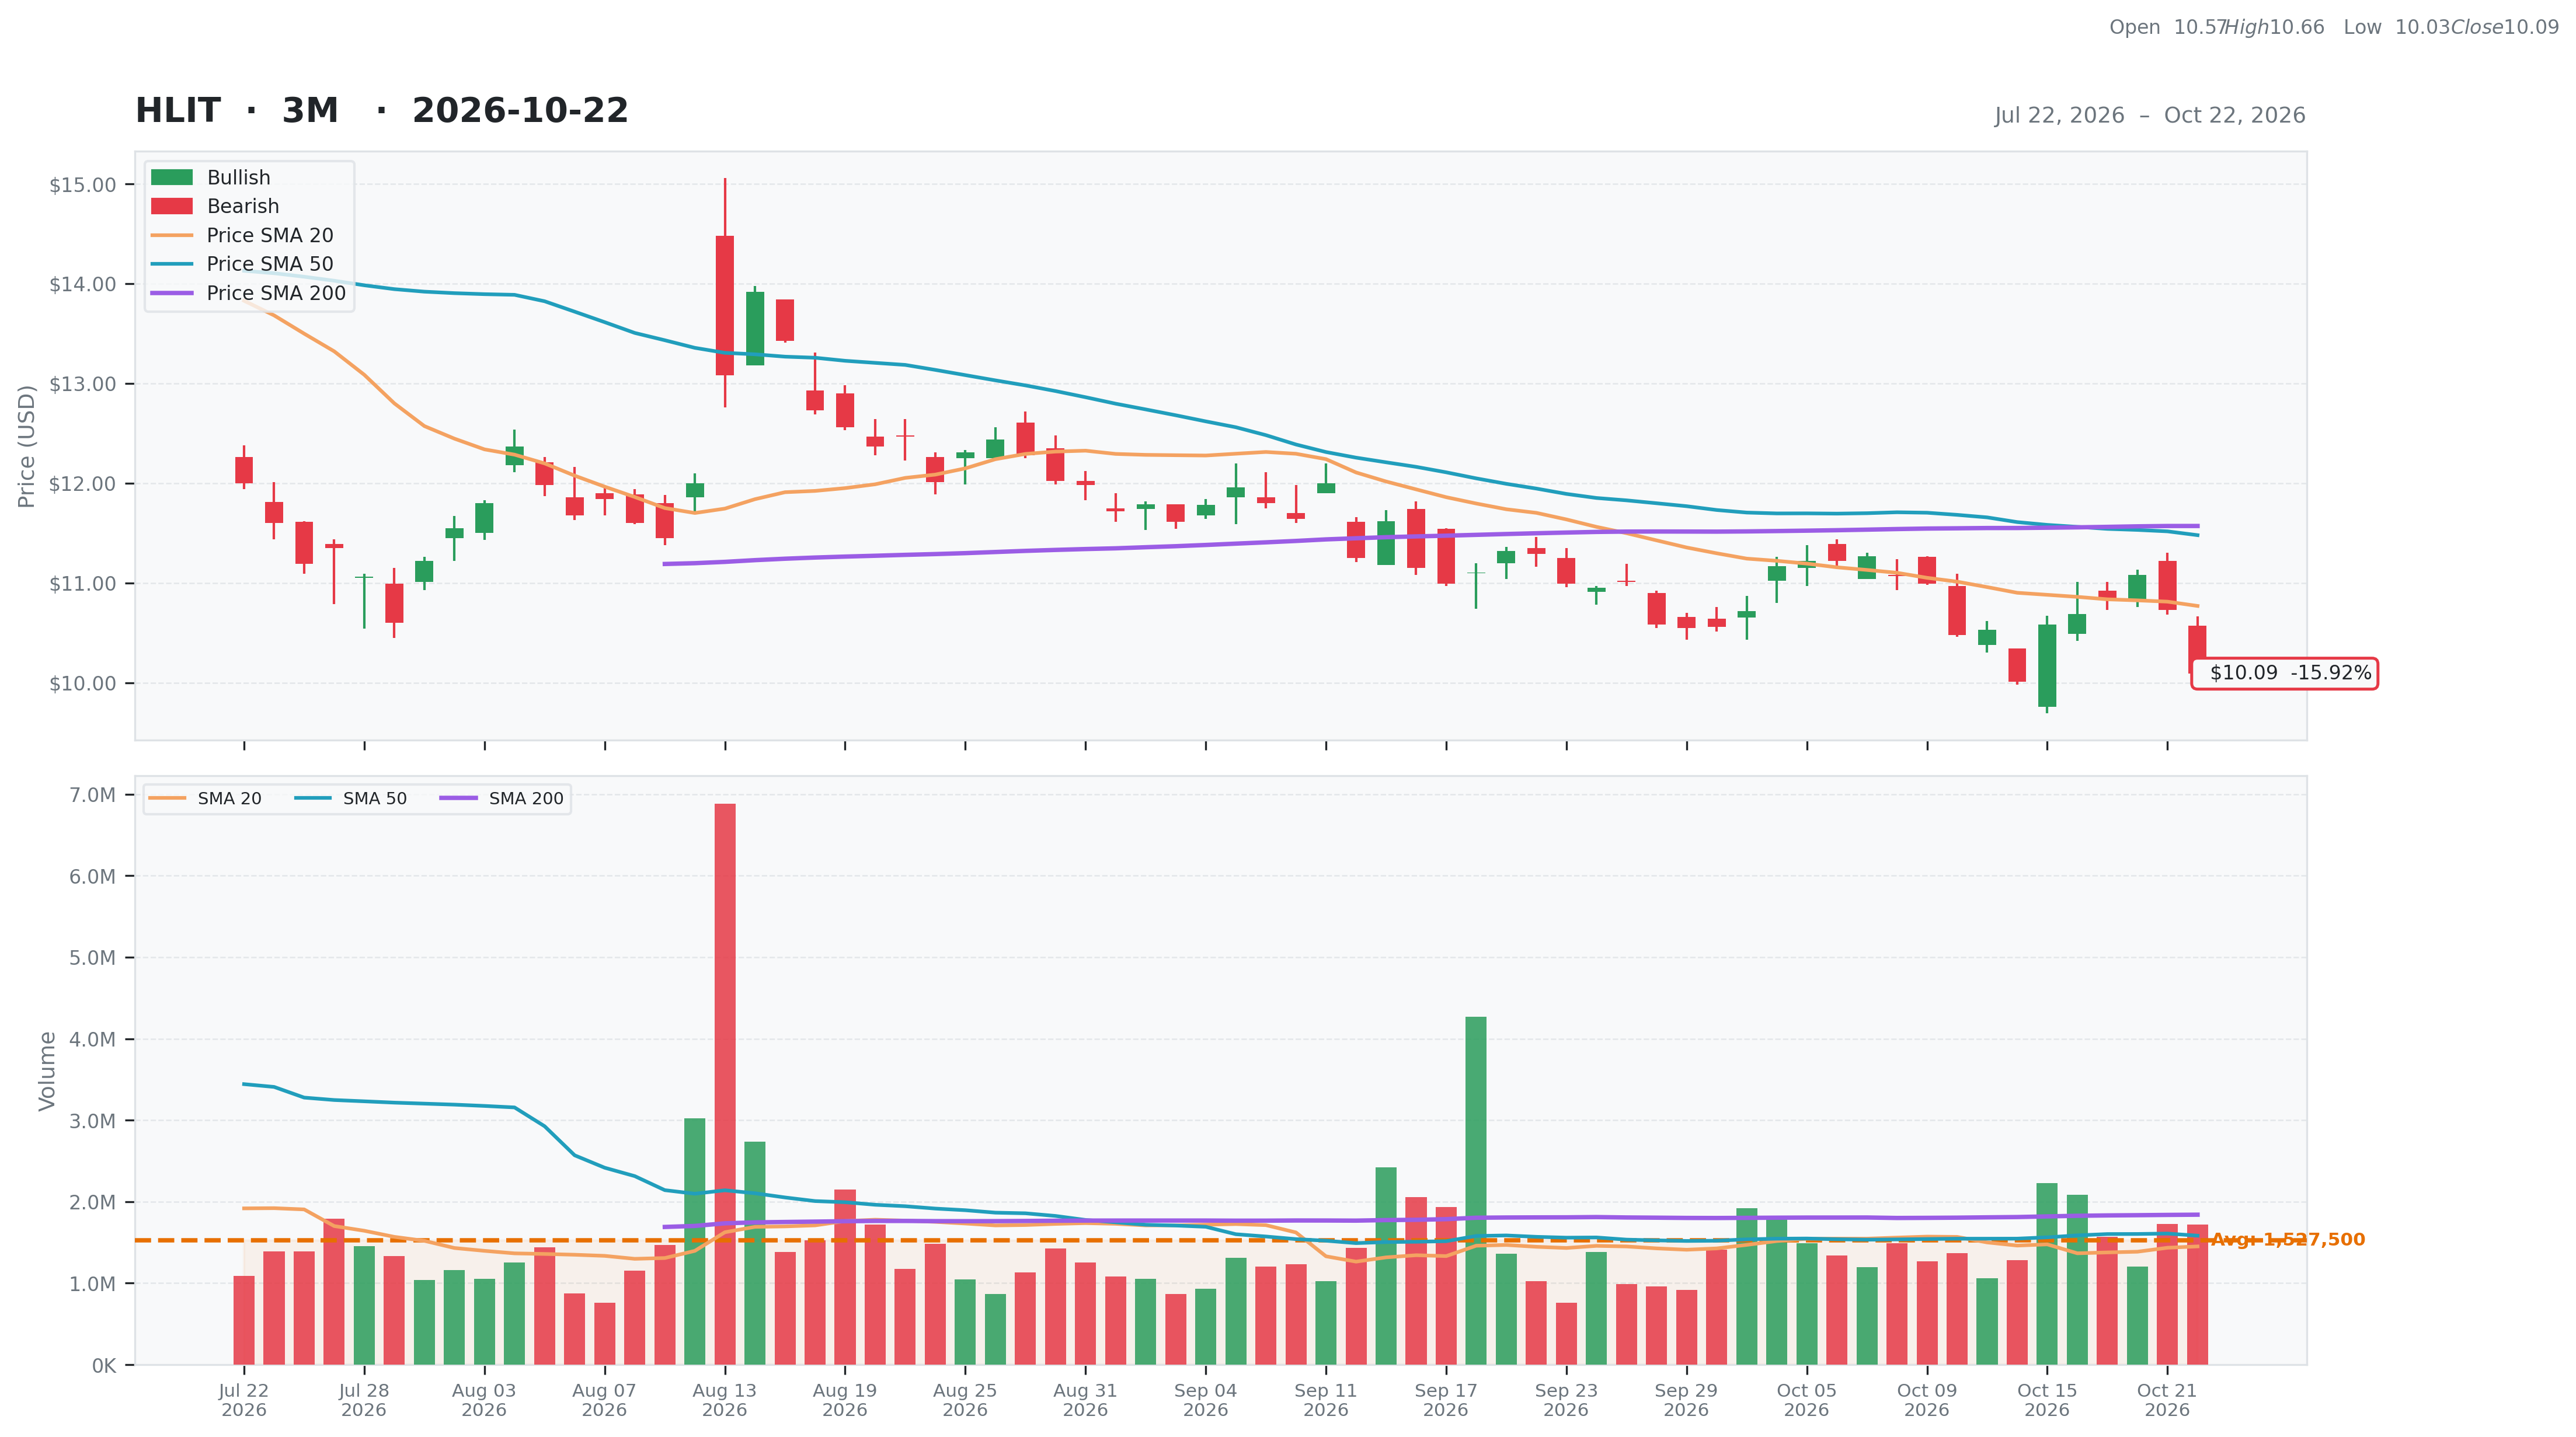
| Total | 55 | Current | $10.09 | 52W High | $17.11 -41.03% | Relative Strength | -0.06 | Beta | 1.34 |
| Business Quality | 15 | Weekly | $10.58 -4.63% | 52W Low | $8.85 14.01% | 3M | -0.10 | Short % | 0.09 |
| Financial Strength | 17 | Monthly | $11.29 -10.63% | Above 50DMA | $11.48 -12.10% | 6M | -0.03 | Risk Score | 1 |
| Growth Outlook | 5 | Quarterly | $11.19 -9.83% | Above 200DMA | $11.57 -12.80% | 9M | -0.04 | ||
| Momentum | 2 | Yearly | $10.47 -3.63% | 12M | -0.03 | ||||
| Valuation | Financial Strength | Growth/Profitability | |||
|---|---|---|---|---|---|
| Trailing P/E | 41.12 | Cash | 232M | Revenue Growth | 0.54% |
| Forward P/E | 13.23 | Debt | 130M | Earnings Growth | N/A |
| PEG Ratio | 1.84 | Debt/Equity | 36.11 | Qtr Earnings Growth | N/A |
| Price/Sales | 2.63 | Current Ratio | 3.05 | Gross Margin | 0.50% |
| Price/Book | 3.23 | Quick Ratio | 2.36 | Operating Margin | 0.18% |
| EV/Revenue | 2.40 | Operating CF | 62M | Profit Margin | -0.11% |
| EV/EBITDA | 16.61 | Free CF | 71M | EBITDA Margin | 0.14% |
| Ent Value | 1,064M | Return on Assets | 0.05% | ||
| Return on Equity | 0.07% | ||||
| Technical | Volume & Bollinger Bands | Analyst | |||
|---|---|---|---|---|---|
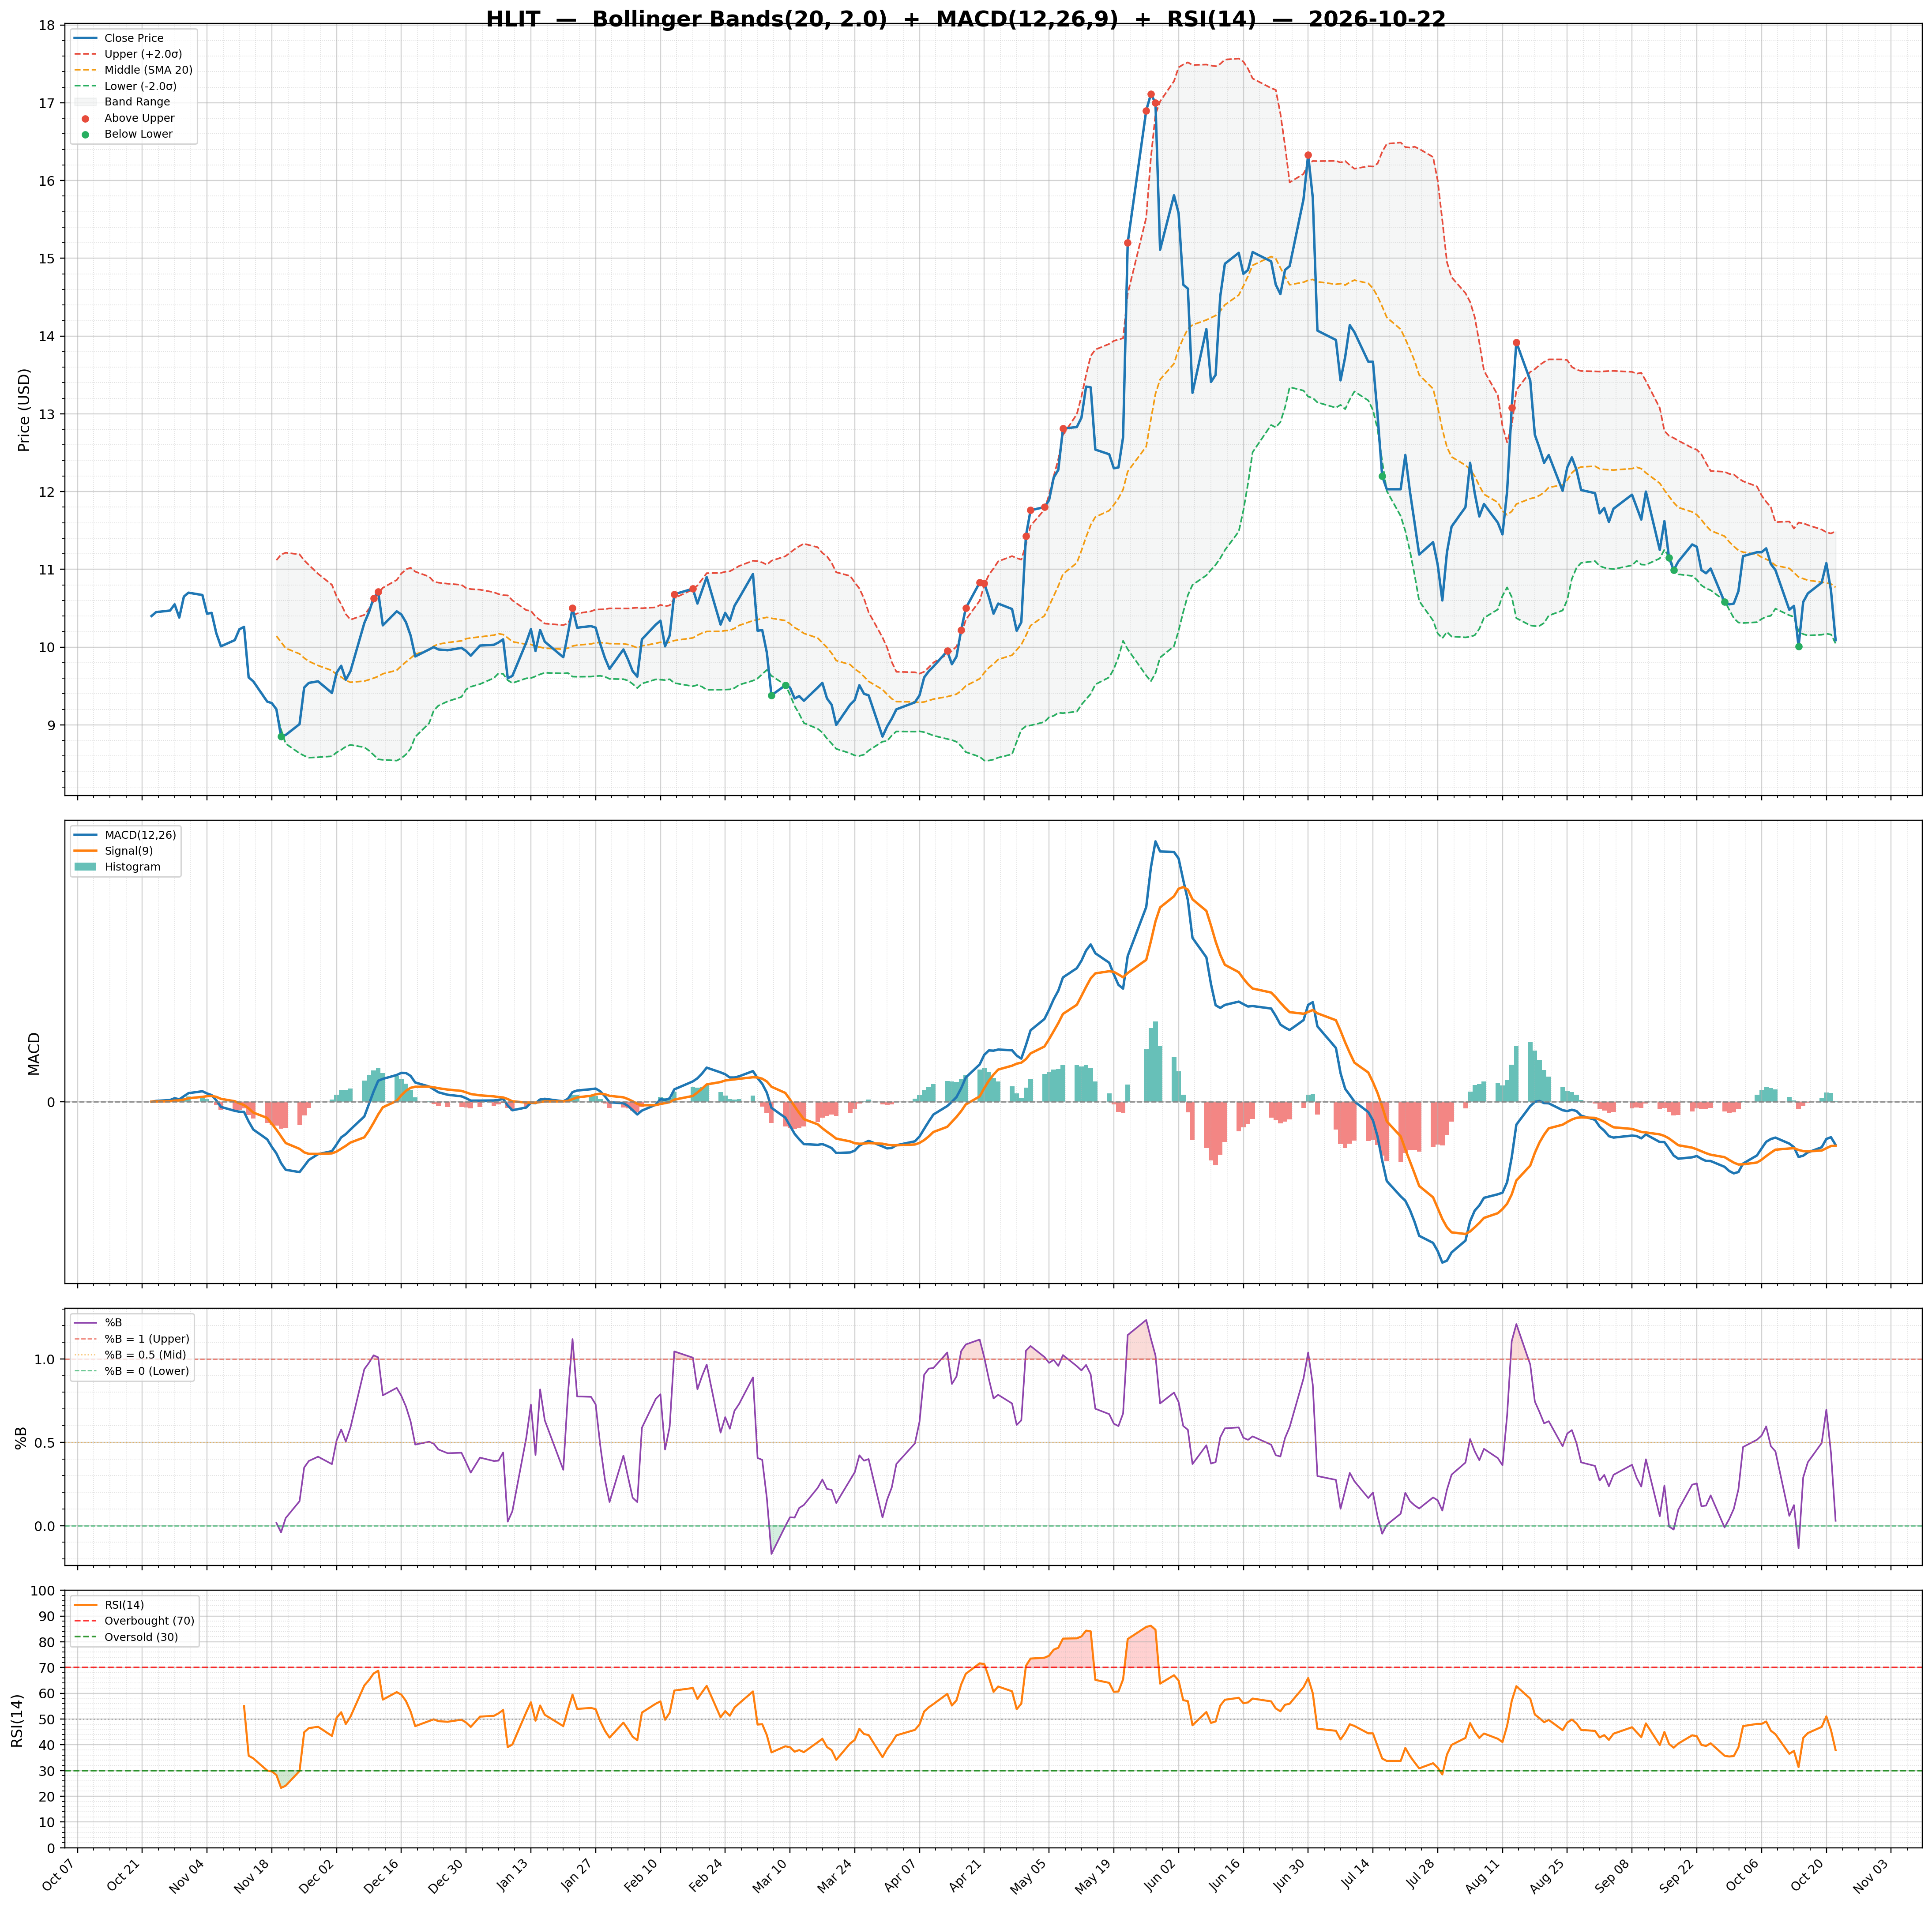
| RSI | 37.95 | Volume | 2.08M | Rating | buy |
| Previous RSI | 45.72 | Avg Volume 20D | 1.45M | Target Mean | $16.14 |
| RSI Trend | Down | Relative Volume | 1.10 | Target High | $20.00 |
| MACD | -0.23 | Lower Band | 10.05 | Target Low | $8.00 |
| MACD Signal | -0.24 | Middle Band | 10.77 | Target Median | $17.00 |
| Histogram | 0.00 | Upper Band | 11.49 | Analysts | 7 |
| Previous Histogram | 0.05 | Bandwidth | 13.390 | Upside | 51.01% |
| Histogram Trend | Decreasing | %B | 0.03 | ||